Saturday, June 8, 2013

Weekly Indicators: moving forward in first gear edition


 - by New Deal democrat

May monthly data reported this past week was dominated by yet another tepid jobs report of +175,000 with a slight increase in the unemployment rate due to more people entering the labor force. Average hourly earnings barely increased, so real earnings probably fell slightly for the month. The ISM reported that manufacturing contracted slightly, which services expanded at slightly better rate. Auto sales increased slightly for the month, but have been flat over a 6 month period. April factory orders also increased, but have also been flat for a 6 month period. Consumer credit increased. In the rear view mirrow, in the first quarter productivity increased, and unit labor costs fell sharply but only partially reversing a huge spike in the fourth quarter due to income being shifted forward into that quarter.

Let's start this week's look at the high frequency weekly indicators by focusing on employment metrics, which have become decidedly mixed:

Employment metrics

American Staffing Association Index
  • 92 down -2 w/w, down -0.5% YoY
Initial jobless claims
  •   346,000 down -8,000

  •   4 week average 352,500 up 5,500
Tax Withholding
  • $147.5 B for the last 20 reporting days vs. $138.8 B last year, up $8.7 B or +6.3%
In the last month, the ASA has deteriorated to being negative compared with last year, and had its worst comparison yet this week. After having a great 20-day comparison last week, this week tax withholding had its worst YoY comparison in several months. Initial claims remain within their recent range of between 325,000 to 375,000.

Transport

Railroad transport from the AAR
  • +4300 or +1.6% carloads YoY

  • -3300 or -2.0% carloads ex-coal

  • +5800 or +3.7% intermodal units

  • +12,000 or +2.5% YoY total loads
Shipping transport Rail transport has had four negative weeks in the last several months, but this week was positive.  The Harpex index has flattened after improving slowly from its January 1 low of 352. The Baltic Dry Index remains above its recent low.

Consumer spending Gallup's YoY comparisons remain extremely positive, as they have been for the last half a year.  The ICSC varied between +1.5% and +4.5% YoY in 2012, while Johnson Redbook was generally below +3%. This week both were in the upper part of those ranges.

Housing metrics

Housing prices
  • YoY this week +6.9%
Housing prices bottomed at the end of November 2011 on Housing Tracker, and averaged an increase of +2.0% to +2.5% YoY during 2012. This weeks's YoY increase made a new 6 year record.

Real estate loans, from the FRB H8 report:
  • unchanged w/w

  • up +0.6% YoY

  • +2.2% from its bottom
Loans turned up at the end of 2011 and averaged about 1% gains YoY through most of 2012.  In the last several months the comparisons have completely stalled.

Mortgage applications from the Mortgage Bankers Association:
  • -2% w/w purchase applications

  • +14% YoY purchase applications

  • -15% w/w refinance applications
Refinancing applications had their worst week in almost 6 months, due to higher interest rates, but purchase applications continue their slightly rising trend established earlier this year.

Interest rates and credit spreads
  •  4.90% BAA corporate bonds up +0.12%

  • 2.14% 10 year treasury bonds up +0.15%

  • 2.76% credit spread between corporates and treasuries down -.03%
Interest rates for corporate bonds, although rising strongly in the last month, have generally been falling since being just above 6% two years ago in January 2011, hitting a low of 4.46% in November 2012. On the other hand, Treasuries have returned in the last three weeks to their 2% high established in late 2011, compared with their low of 1.47% in July 2012. Spreads have varied between a high over 3.4% in June 2011 to a low under 2.75% in October 2012, so spreads are still a positive, and are only .01% above their 12 month low.

Money supply

M1
  • +0.4% w/w

  • -1.2% m/m

  • +13.3% YoY Real M1

M2
  • +0.1% w/w

  • +0.3% m/m

  • +5.7% YoY Real M2
Real M1 made a YoY high of about 20% in January 2012 and has generally been easing off since.  This week's YoY reading increased sharply for the second week in a row.  Real M2 also made a YoY high of about 10.5% in January 2012.  Its subsequent low was 4.5% in August 2012. It has increased slightly in the last few months and has stabilized since.

Oil prices and usage
  •  Oil $96.03 up $4.06 w/w

  • Gas $3.65 up +$0.01 w/w

  • Usage 4 week average YoY -0.8%
The price of a gallon of gas, after declining sharply in March and April, rose again in May. The 4 week average for gas usage remained negative after two positive YoY months several months ago.

Bank lending rates The TED spread is still near the low end of its 3 year range.  LIBOR remains close to a 3 year low.

JoC ECRI Commodity prices
  • down -0.02 to 124.82 w/w

  • +7.37 YoY
After several weeks of more positive signs, last week we returned to the pattern of gradual deterioration that began in February. This week most indicators remain positive and there were fewer negatives.

Temp staffing is becoming a larger concern as it declined again and remains below last year's rate. Also negative this week were mortgage refinancing and treasury bonds, reflecting the bond selloff. Real estate loans, commodities, and shipping were neutral. Gas usage remains negative but may continue to reflect increased efficiency. Gas prices increased sharply but we haven't moved into a constrictive price range yet. After having their best week in months last week, this week tax withholding had its worst comparison in months. Averaged out the two weeks are lukewarm.

The biggest positive remains very strong consumer spending. Positives included house prices, YoY purchase mortgage applications, money supply, and overnight bank rates. The spread between corporate and treasury bonds contracted. Weekly jobless claims improved. Rail had a very good week. It has been decidedly mixed over the last few months.

Last week I said that for me to be sold that the data is actually rolling over, I would want to see a sustained increase in jobless claims and a sustained deterioration in consumer spending. That wasn't happening as of last week, and it certainly didn't happen this week either. The economy still seems to be moving forward - but in first gear.

Have a nice weekend.

Friday, June 7, 2013

Weekend Weimar, Beagle and Pit Bull

You know the drill by now.

See you Monday; NDD will be here over the weekend.


What Barry Said

I've been reading Barry's blog for almost 10 years (dear God, has it been that long)?  Agree or disagree I always find his points well thought out and very well presented.  Today he makes a few very important points that should be repeated:

As we have discussed so very frequently, the monthly change in net jobs is the most over-emphasized, least important highly questionable data point you will find. NFP is a minor monthly rounding error a series subject to the oscillations of both the economy and the data assembly work performed by legions of BLS economists and statistical wonks. It is subject to corrections, revisions and re-benchmarking. It is produced by a model, as so astutely observed by Professor Box, that is wrong. However, it would be foolish not to recognize that the BLS model can be to the intelligent observer who understand context, quite useful.

OK -- I disagree with the birth/death model argument, but that's beside the point.  The monthly NFP data point -- and all of the hoopla that surrounds it in various forms -- is pure bullshit.  The numbers are revised on more than one occasion -- in some cases majorly so.  As I pointed out previously, the best employment model now is from the Atlanta Fed's Macroblog that highlights the very complex nature of this element of the economy.  It notes that employment is comprised of four different sets of statistics: leading indicators, employer behavior, overall confidence and utilization.  While leading indicators are doing well, all other metrics are in weak to moderately weak readings. Employers just aren't making the hires right now despite an increase in job openings advertisements and positions.  And our utilization is terrible.   And it is those readings that explain the basic problems of the jobs market right now. 

There are two more points that should be reiterated:

1) This is a post-credit crisis recovery which is progressing via a gradual improvement in balance sheets (a “beautiful de-leveraging” to quote Dalio), sub-par GDP growth, anemic job creation.

2) Secular changes in employment — huge improvements in productivity, baby boomers retiring, globalization — have all impacted the overall employment trends, mostly with a negative bias.

The first point has been made here ad nauseum -- but it needs to be repeated because there are a host of economic "commentators" who are, well, dumber than a post.  They continue to treat this recovery like a standard, "raise interest rates to slow inflation" recovery when in fact it's not.  Given the general economic backdrop, the economy is actually doing fairly well.


Also note that changes in US demography, business practices and overall globalization are having a tremendous impact.  Case in point.  Yesterday I had a late afternoon appointment, but thanks to my trusty I-Phone I was able to move two separate deals forward via text, email an phone.  This increase in productivity is economy wide and is lowering the need for labor in a big way.  Also to be considered as no small force is the retirement of the baby-boomers which is lowering overall workplace participation.

Let me add a further point.

4.) If some "analysts" are dumber than a post, Washington is proof positive that the lobotomy industry is alive and well somewhere on the east coast.

The fact that we're in the middle of a sequester with a decreasing deficit and 7%+ unemployment is beyond stupid.  When was the last time you heard anyone in Congress or the executive branch talk about the U6 unemployment rate, or the fact that we clearly have an employment problem in the US?  Me neither.  'Nuff said.

Anyway -- thanks to Barry for providing some great analysis over the years. 

May employment: a mixed report that isn't nearly good enough


- by New Deal democrat

May's employment report can best be described as a tepidly good report, that mainly took back losses we saw in several categories last month. You probably already know the headlines, +175,000 jobs added, and the unemployment rate ticked up .1 to 7.6%. Government subtracted -3000 from the 178,000 private jobs number. The broader U6 unemployment rate ticked down -.1 to 13.8% (putting us back at March's level).

As always for me, after the headline the next thing I want to do is look at the more leading numbers in the report which tell us about where the economy is likely to be a few months from now. This was generally good, but mainly in that April's bad numbers were reversed, putting us back a March levels:
  • temporary jobs - a leading indicator for jobs overall - increased by 25,600.

  • manufacturing jobs declined -8,000. This is the third month in a row of manufacturing job losses, and is a red flag

  • the number of people unemployed for 5 weeks or less - a better leading indicator than initial jobless claims - rose 232,000. This places it back in the caution zone nearly 300,000 off its lows.

  • the average manufacturing workweek rose +0.1 hour from 40.8 hours to 40.7 hours. This is one of the 10 components of the LEI and will affect that number positively.

  • construction jobs gained 7000.

Now here are some of the other important coincident indicators filling out our view of where we are now:
  • the average workweek was unchanged at 34.5 hours

  • overtime hours were also unchanged

  • The broad U-6 unemployment rate, that includes discouraged workers, fell back from its April level of 13.9% to its March level of 13.8%.

  • the index of aggregate hours worked in the economy, which last month had been reported to have fallen -0.4 from 98.2 to 97.8, was revised to a -0.1 fall, which was reversed with a +0.1 rise back to its March level of 98.3
Other news included:
  • the alternate jobs number contained in the more volatile household survey showed a gain of 319,000 jobs, which with April's +293,000, totals over +600,000 in two months.

  • 420,000 people entered the labor force, muting the impact of the slight increase in the unemployment rate.

  • Combined revisions to the March and April reports totalled -12,000.

  • average hourly earnings increased $.01 to $23.89. The YoY change rose from +1.9% to +2.0%. Since I expect May CPI to rise at least 0.2%, this will be a real albeit slight m/m decline.

This month's report can be filed under the catergory of "positive, but not nearly good enough," which basically describes the entire last 3 years. Most of the positive indicators outside of the headline number actually just take back last month's declines. The only - slight - silver lining in the ongoing losses in manufacturing jobs is that we don't rely on those any more for a functioning economy.

There's nothing to get excited about in this report, and while it is mainly positive, there are some warning signs that the metrics are stalling.

A Quick Point Before the NFP Release


The above 60 minute SPY chart shows the market to be in a disciplined sell-off.  Remember this as "market mavins" pontificate from on high.  In essence, we're in a standard pull back.

It's NFP Day!

Today the BLS announces the monthly employment numbers.

NDD will "run point" on our analysis; I'll add a few points as well.

Anyone want to wager a number?  I'll go 145,000.

Thursday, June 6, 2013

EU Depression Marches Onward


The unemployment rate continues to move higher.

Manufacturing numbers continue to print in negative numbers, although the trend is lessening
  • Final Eurozone Manufacturing PMI at 48.3 in May (flash: 47.8)
  • Downturns ease in all nations covered
  • Price deflationary pressures remain, as input costs and output prices fall further
Here's a chart of the data:


Everybody's still below 50.

Market/Economic Analysis: India

Like it's BRICs cousin Brazil, India is facing some fairly heavy problems.  I last discussed the Indian economy in April and noted they were not looking very promising.  First, they are dealing with slower growth and higher inflation.  But structural problems are now coming to the surface.  First, their infrastructure is in terrible shape and is now biting into growth:

Of all the problems blamed for the slowdown over the past two years – recession in Europe, lack of skills in India, burdensome labour laws, port congestion, corruption and bureaucracy – the electricity shortage is now regarded by government and business alike as among the most serious.

  “We used to think roads were the most important thing,” one government minister confided this week at a reception. “But it’s power, power, power.”
 
Economists who study the Indian economy – which has probably just overtaken Japan to become the world’s third largest measured by purchasing power parity, according to the Organisation for Economic Co-operation and Development – say that one of its peculiar weaknesses is the small size of its manufacturing sector.

And the government is struggling with questions about its overall legitimacy as allegations of corruption and graft continue:

Indian Prime Minister Manmohan Singh’s latest skirmish with corruption risks setting back efforts to spur growth, worsening a legislative logjam under a government set to pass the fewest bills ever in a full term.

Singh, 80, is grappling with renewed allegations that he has allowed corruption to fester after separate graft probes led to the May 10 dismissal of the law and railways ministers. Parliament ended two days early last week as opposition parties demanding the men’s resignation blocked proceedings, with proposals to open up the country’s pension and insurance industries to overseas investment still stalled. 

.....

Over the last four years, at least six ministers have resigned after being accused in corruption cases, with the opposition parties claiming this is the most graft-ridden government in India’s history. 

Both of these factors -- along with the general global slowdown -- is leading to slower GDP growth.  From the latest GDP report:

GDP at factor cost at constant (2004-05) prices in the year 2012-13 is now estimated at Rs. 55,05, 437 crore (as against Rs. 55,03,476 crore estimated earlier on 7th February, 2013), showing a growth rate of 5.0 percent over the First Revised Estimates of GDP for the year 2011-12 of Rs. 52,43,582 crore, released on 31th January 2013.

.....

Growth rates in various sectors are as follows: ‘agriculture, forestry and fishing’ (1.4 percent), ‘mining and quarrying’ (-3.1 percent), ‘manufacturing’ (2.6 percent), ‘electricity, gas and water supply’ (2.8 percent) ‘construction’ (4.4 percent), 'trade, hotels, transport and communication' (6.2 percent), 'financing, insurance, real estate and business services' (9.1 percent), and 'community, social and personal services' (4.0 percent).

News stories have noted that the combined effect of a weakened central government, high budget deficit and overall beaurocratic inefficiency are hindering growth:

Singh’s eight-month push to boost the economy has in recent weeks floundered as protests over alleged graft in government disrupted parliament, impeding bills seeking to lure foreign capital, simplify taxes and provide more land for industry. At the same time, a record current-account deficit is constraining Indian monetary easing as the global recovery falters.

“Growth is weak and I am skeptical about a sharp bounce-back anytime soon,” said Radhika Rao, an economist at DBS Bank Ltd. in Singapore. “The Reserve Bank of India will be cautious about retail inflation and the high current-account deficit.”

The central bank also believes the Indian economy is in weak shape:

On the domestic front, most Members were of the view that the overall demand situation is very weak. Industrial growth is subdued - new orders are expanding only modestly and instances have been reported where even after placing orders, clients are advising manufacturers not to deliver goods. Downgrading of companies by rating agencies has gone up by 30 per cent. The services sector is also weak and productivity in services and manufacturing sectors has been adversely affected, leading to supply constraints. The supply response is low, notwithstanding sizable unutilized capacity in the economy. Profit margins have been squeezed due to minimum wages rising with consequent wage pressures in the organized sector.

For a more detailed look, see this link from the central bank.

The latest Markit manufacturing and service report do paint a picture of an economy that is growing, albeit barely in the case of manufacturing.

Firs is the manufacturing report:

Operating conditions in the Indian manufacturing economy stagnated during May. The seasonally adjusted HSBC Purchasing Managers’ Index™ (PMI™) – an indicator derived from individual diffusion indices measuring changes in output, new orders, employment, suppliers’ delivery times and stocks of purchases – fell from 51.0 in April to 50.1 and was at a 50-month low.  

Reflective of weaker gains in incoming new work and persistent power outages, output decreased in May, the first decline registered since March 2009. That said, production fell only slightly. Order book volumes rose for the fiftieth consecutive month. The rate of expansion was, however, marginal and the slowest in that sequence. Panellists suggested that demand was maintained, but commented on increased competition for new work and tough market conditions overall, particularly at home. Encouragingly, foreign orders rose at an accelerated pace during May. Growth in export business was solid and the fastest since January. Monitored companies indicated strengthening demand from key export clients. Meanwhile, unfinished business levels increased, amid evidence of power and water shortages. Backlogs of work rose solidly and at the quickest pace in five months.

And then there is the services report, which was more bullish:

The seasonally adjusted HSBC Services Business Activity Index posted 53.6 in May, up from 50.7, pointing to a solid expansion in output, one that was the fastest in three months. This contrasted with a fall registered in manufacturing output, the first decline in 50 months.  May data pointed to higher levels of new work placed at private sector firms in India. The rate of expansion was moderate and little-changed from April. Service providers stated that demand was stronger and new products were launched. Manufacturers reported weaker gains in incoming new work, tough market conditions and increased competition.

Let's turn to the charts of the Indian ETF


The ETF is still trading between the 55 and 62 lever.  Momentum is fluctuating and prices are using the 200 day EMA line as technical support.

The main issue for the market is when will it break out of its range and what direction will it move in?


Wednesday, June 5, 2013

Mortgage Rates Rise; Mortgage Bonds Drop


Mortgage backed bonds have dropped below key support at the 108 price level.  Other parts of the chart add to the bearish interpretation.  Prices are below the 100 day EMA with the smaller EMAs moving lower.  The 10 and 20 day EMA have moved through the 20 day EMA and momentum is negative.

The Financial Times outlines the the potential problems:

The change could affect the US economy in two ways: by making new loans less affordable, it could damp the recent recovery in house prices; and it could reduce the number of Americans refinancing into cheaper mortgages, eliminating savings that have boosted consumer spending. 

Keith Gumbinger, vice-president of mortgage research company HSH, said: “The rise in the rate is enough to slow down the refinancing market, as even a small bump up in rates can put homeowners on the fence.”
Refinancing applications had already begun to decrease, falling 12 per cent in the week to May 24 according to the Mortgage Bankers’ Association – the largest single-week drop this year and back to their lowest level since December 2012.

However, other analysis disagrees.  This is from Wonkblog, citing Goldman research:

It also shows an initial reason for some optimism. At a 30-year fixed-rate mortgage rate of about 3.8 percent, the typical American homebuyer can afford a $279,000 house. That’s 45 percent more than the current price of houses. That suggests that affordability isn’t the thing holding Americans back from buying houses (instead, it may be such factors as tight credit standards, difficulty building up a down payment  or lack of confidence in future job prospects). It also implies that slight increases in the mortgage rate shouldn’t completely undermine the improvement in the housing market; the thing to watch is not rates per se, but what happens on those other factors that are drags on would-be homeowners.

And that bodes particularly well:  As we wrote last week, the rise in rates over the past month appears to be driven primarily by improving economic prospects. If that’s the case, even as homes become a bit more expensive, they will be doing so at the same time those other restraining factors dissipate. So rising mortgage rates, if they’re rising for good reasons, could actually be net positives for the housing market if they result from more people having jobs and being confident in their prospects.

Has Gold Found a Temporary Bottom?


The top chart is a daily chart of the GLD ETF, and it shows a potential bottom forming in the 130 area.  Don't get too excited by this development as the chart is still bearish overall.  The longer EMAs (200 and 50 day) are both moving lower and prices are using the shorter EMAs as technical resistance.  And even if we saw a rebound, the most likely areas of resistance would be the Fibonacci levels from the early October high and mid-April sell-off.

I believe the key to this chart is currently in the monthly numbers, which show that prices have broken a multi-year uptrend.  Also note the 130 price level is is important from a Fibonacci perspective.

Australia Keeps Rates Steady

The Australian Central Bank kept rates at 2.75% in their latest policy announcement:

At its meeting today, the Board decided to leave the cash rate unchanged at 2.75 per cent. 

.....

 In Australia, growth over the past year has been a bit below trend. The outlook published by the Bank last month is for a similar performance in the near term and recent data are consistent with this. The unemployment rate has edged higher over the past year and growth in labour costs has moderated. Inflation has been consistent with the medium-term target and is expected to remain so over the next one to two years. 

The easing in monetary policy over the past 18 months has supported interest-sensitive areas of spending and has been reflected in portfolio shifts by savers and higher asset values. Further effects can be expected over time. The pace of borrowing has thus far remained relatively subdued, though recently there have been some signs of increased demand for finance by households. The exchange rate has depreciated since the previous Board meeting, although, as the Board has noted for some time, it remains high considering the decline in export prices that has taken place over the past year and a half. 

I'm bearish on Australia and the above comments don't change my mind.  Growth is slowing a bit.  My guess is the central bank is keeping their powder dry in the event they need to add further fuel to the fire.

Let's take a look at the relevant ETFs while we're here.


There are three important developments on the weekly chart.  First, prices have broken the trend of the rally started in the spring of 2012.  Since this break, prices have fallen to a Fib fan level for technical support.  Most importantly, the weekly MACD has given a sell signal. 


The daily chart shows the the exact same developments, but adds the further issue of prices now being below the 200 day EMA,


Tuesday, June 4, 2013

Gross domestic income remains positive


. - by New Deal democrat

With the second estimate of quarterly GDP comes the estimate of Gross Domestic Income. Theoretically GDI should be the mirror image of GDP, and usually it is believed over time that GDP estimates tend to be revised towards the original GDI figure. So even though it is a look in the rear view mirror - the first quarter of 2013 in this case, it has an important quality of confirmation or caution.

For the first quarter GDI confirms that the economy remained in expansion, being reported at +3.7% annualized, or 0.9% for the quarter:


And here's real, inflation adjusted GDI:


While there was definitely some softness in 2011 and a soft quarter in 2012' the certainly is no declining trend, as shown in this YoY graph:


As I have said a number of times since the beginning of the year, left to its own devices, the economy wants to expand.

John Hinderaker Demonstrates His Economic Ignorance -- Unexpectedly!

For reasons unknown, John Hinderaker thinks he has the ability to provide meaningful economic analysis when in fact the exact opposite is the case.  In the time that I've been reading his blog (over 8 years now) he has yet to get even the most basic economic concept right.

His latest demonstration of economic ignorance is his piece, Manufacturing Drops -- unexpectedly.  After citing to a Bloomberg news article, he concludes the following:

America’s slow-to-nonexistent economic growth, of which today’s manufacturing data are one of many symptoms, is the result of bad government policies: out-of-control regulations, excessive and inefficient government spending, rising tax rates and the impending disaster of Obamacare, to name the most obvious ones. Until observers are willing to acknowledge the extent to which poor government drags down the economy, they will continue to be surprised by unexpected bad news.

First, let's look at the actual report to see what it actually says.

The report was issued today by Bradley J. Holcomb, CPSM, CPSD, chair of the Institute for Supply Management™ Manufacturing Business Survey Committee. "The PMI™ registered 49 percent, a decrease of 1.7 percentage points from April's reading of 50.7 percent, indicating contraction in manufacturing for the first time since November 2012 and only the second time since July 2009. This month's PMI™ reading is at its lowest level since June 2009, when it registered 45.8 percent. The New Orders Index decreased in May by 3.5 percentage points to 48.8 percent, and the Production Index decreased by 4.9 percentage points to 48.6 percent. The Employment Index registered 50.1 percent, a slight decrease of 0.1 percentage point compared to April's reading of 50.2 percent. The Prices Index registered 49.5 percent, decreasing 0.5 percentage point from April, indicating that overall raw materials prices decreased from last month. Several comments from the panel indicate a flattening or softening in demand due to a sluggish economy, both domestically and globally."

For anyone who reads these reports regularly, the opening paragraph is the standard ISM report opening paragraph providing an overview of the numbers therein.  The internals are moving lower, and most are printing in the "just negative" category. Notice the emboldened sentence at the end: sluggish global demand may be playing a factor.

Here's a chart of the overall data from the St. Louis FRED system:

 
For the last 12-13 months, the data has been printing right above the 50 level, indicating an economic expansion.  So, yes, the data has for one month moved into negative territory.

Let's look to the causes listed in the report's anecdotal comments section:
  • "Customers are anticipating resin price decreases and holding back orders." (Plastics & Rubber Products)
  • "Slight uptick in overall business but not substantial." (Textile Mills)
  • "Government spending has tightened, which has moved out program awards and caused some reduction in force." (Computer & Electronic Products)
  • "Market outlook is relatively flat, with some promise of raw materials inflation relaxing." (Electrical Equipment, Appliances & Components)
  • "General economy seems sluggish and pensive. Buyers are not buying much beyond lead times." (Fabricated Metal Products)
  • "Downturn in European and Chinese markets is having a negative effect on our business." (Machinery)
  • "We are having a difficult time hiring skilled employees." (Transportation Equipment)
  • "Business continues to increase, but over the past 20 days we have seen the trend flatten." (Furniture & Related Products)
  • "Market was holding strong until mid-month — then softened." (Wood Products)
  • "Decline in sales for FYQ2 over same period a year ago due to softer demand [in] both domestic and exports." (Chemical Products)
First, Hinderaker claims "inefficient government spending" is a cause of the ISM slowdown.  But the anecdotal comments say the exact opposite, instead citing a tightening in government spending as a reason for the slowdown.  The last GDP report made the exact same observation: [t]he increase in real GDP in the first quarter primarily reflected positive contributions from personal consumption expenditures (PCE), private inventory investment, residential fixed investment, nonresidential fixed investment, and exports that were partly offset by negative contributions from federal government spending and state and local government spending.   So a simple reading a few economic reports would have disabused Mr. Hinderaker of this contention. This is not analysis, but instead reading comprehension.

As for this spending being excessive, I've already demonstrated that Federal spending has in fact stalled -- see the chart in this article.  This information is confirmed by the BEA's latest GDP data.  In fact, federal spending is slowing to the point of making a meaningful dent in the budget deficit -- the development of which is conspicuously absent from Mr. Hinderaker's blog despite his protestation to being a fiscal hawk.

Also note the reference in the ISM report to a slowing global economy.  As readers of this blog know, the Chinese re-balancing and the EU depression are having ripple effects throughout the world economy.  As US manufacturing supplies both regions, simple logic would indicate these slowdowns are impacting US manufacturing.  Yet Mr. Hinderaker makes no mention of this widely known development in his "analysis."

As for the rising tax rates crushing growth, nothing could be further from the truth.  Here's a chart of total tax revenues as a percent of GDP, drawn from data provided by the CBO:


The data indicates that tax rates are among the lowest of the last 50 years.

Obviously unbeknownst to Mr. Hinderaker, the US is experiencing a post debt-deflation recovery.  It is also referred to as a balance sheet recession.  This was first outlined by Irving Fisher in the early 1930s (see the first post).  After an economy builds up too much debt, a slowdown forces liquidation.  This leads to the selling of assets, lowering prices, leading to the calling of more loans and a general slowdown of economic activity.  See also Japan for the last 20 years.  This is the reason for the slow growth.  This is the reason for the slow growth.  Anyone who actually reads economic history would know this. 

Hinderaker is a political wind-up doll: pull his string and he regurgitates the standard conservative party line.  He performs no analysis and and is remarkably devoid of meaningful economic insights.  His sole purpose is to continue particular themes, facts be damned.  And, as the facts demonstrate, he's again 100% wrong in his analysis.   


Market/Economic Analysis: Brazil

I've previous noted that Brazil faces the most unwanted dilemma of slower growth and higher inflation (see here and here).  It is not an economy or market that I would invest in right now; on April 18th I noted:

This rate increase has signaled to the market that Brazil has some fairly deep problems that need to be dealt with.  I wouldn't go long here until we get a far clearer read on inflation.

Unfortunately, the outlook has not improved since my last writing.   The biggest problem is that the old model of growth no longer works while the new model is lacking.  The recent departure of a high level government official highlighted the challenges.
The departure of Mr Barbosa will fuel concerns over the direction being taken by Dilma Rousseff, Brazil’s technocratic president. The so-called Lula model championed by Ms Rousseff’s predecessor and mentor, former president Luiz Inácio Lula da Silva, which generated fast growth by pumping up demand with wage rises and social welfare benefits, finally stuttered to a halt in 2011 after eight years.

Investors had pinned their hopes on the “Dilma model” – centralised, planned reform by a trained economist with an authoritative “chief executive-like” style, the opposite of the folksy charm of Mr Lula da Silva, who never completed primary school.

But critics say the result so far has been slow economic growth, excessive government intervention and ever-increasing public expenditure.

Moving on the current economic statistics, the central bank continues to raise rates to combat inflation:

Brazil's central bank raised its benchmark Selic rate by 50 basis points to 8.0 percent to help bring down inflation and "ensure that this trend will continue next year."

In a brief statement, the Central Bank of Brazil said its policy committee, known as Copom, had agreed on the rate rise unanimously and it did not issue a bias about the future trend of policy.

It is the second consecutive rate rise by Brazil's central bank following a 25 basis point rise in April, bringing this year's total rate increase to 75 basis points. In 2012 the central bank cut rates by 375 basis points in response to declining economic growth before freezing rates from November through March.

Today's rate rise was largely expected and follows recent warnings by the central bank's governor that he would do "what is needed, in a timely manner, to ensure inflation declines."

Obtaining inflation-fighting credibility is incredibly difficult for a central bank.  And once lost, it is very difficult to obtain again.  Compounding the problem for Brazil is they have a history of hyper-inflation.  As a result, the bank probably feels compelled at this point to raise rates, especially when faced with the following inflation situation:


Moving onto economic fundamentals, the recent central bank minutes highlight some of the central negative trends the bank is facing:

The Economic Activity Index of the BCB (IBC-Br) incorporates estimates for the monthly production of the three sectors of the economy, as well as for taxes on products, and constitutes important coincident indicator of economic activity. Considering seasonally adjusted data, the IBC-Br retreated by 0.5% in February, after increasing by 1.4% in January. Year-over-year, the economy grew 3.8% in January and 0.4% in February, with twelve-month trailing growth moving from 0.8% in January to 0.9% in February. The Consumer Confidence Index (ICC), from the Getúlio Vargas Foundation (FGV), retreated for the sixth consecutive month in March, considering seasonally adjusted data. On its turn, the Services Sector Confidence Index (ICS) increased in March, reflecting the improvement in the perception of the current situation. The industrial businessmen confidence, measured by the Industry Confidence Index (ICI), retreated in March, after three consecutive months of elevation. Regarding agriculture, the Agricultural Production Systematic Assessment, carried out by the IBGE, indicates that grains production should grow by 12.0% in 2013, relative to the 2012 harvest. 

.....

Manufacturing activity retreated 2.5% in February, after a 2.6% increase in January, according to the general industrial production series seasonally adjusted by the IBGE. Production decreased in 15 of the 27 branches of activity. Thus, the production grew 0.3% in the quarter ended in February, quarter-over-quarter. On its turn, industrial production accumulated in the last twelve months changed from -2.0% in January to -1.9% in February. According to data released by the National Confederation of Industry (CNI), real revenue in themanufacturing industry increased 0.5% in February, compared to the same month of the previous year, and the number of worked hours decreased 0.9%.

While the economy is hardly in the throes of a cataclysmic slowdown, there are clearly major issues facing the country.  The biggest is the decline in the "south-south" trade, or trade between raw material exporters (primarily in Latin America and Oceania) in the southern hemisphere and China. As Chinese growth slows and as China changes its economic model from one of exporting to the developing world to one based more on consumption, countries that have exported to China will see their respective GDP take a hit.  And Brazil is a case in point of the latter:

In relation to the fourth quarter of 2012, the GDP (Gross Domestic Product) at market prices posted a positive change of 0.6%, in the seasonally adjusted series.  The greatest highlight was agriculture, advancing 9.7%. Services grew 0.5%, whereas the industry fell 0.3%. In the comparison with the same period of 2012, there was a 1.9% increase in the GDP in the first quarter of the year. In the cumulative index of the four quarters ended in the second quarter of 2013, the GDP presented a growth of 1.2% in relation to the prior four quarters.  At current values, the GDP at market prices reached R$ 1,110.4 billion, of which R$ 940.4 billion were relative to the Value Added (VA) at basic prices and R$ 170.0 billion, to Taxes Less Subsidies on Products.   

Placing this information in the year over year context, we get the following chart:

The pace of growth has clearly slowed over the last 6-8 quarters. 

Let's turn to the Brazilian ETF, the EWZ:


Since the end of September 2012, the ETF has been trading between the 50 and 57.5 price level.  However, since the beginning of this year, there has been a slight downward trend to the candles.  This has been accompanied by a continual move lower in the MACD and CMF.  Prices are caught at the 200 day EMA since May.  But since the release of the GDP information, prices have dropped lower, printing several long bars on higher volume. 

Monday, June 3, 2013

More measures of the housing non-bubble


- by New Deal democrat

Last Friday I debunked a Zero Hedge post that claimed that median house prices as a multiple of disposable personal income were at new highs. In this post I'll look at a few more measures.

To begin with, almost all of the opinion claiming that there is a new housing bubble are relying on new home prices. Conversely, almost all the posts taking the contrary position are relying on the Case Shiller house price index. There's no doubt that the median price for a new home has shot up in the last year, as shown in this graph:


But the above graph isn't adjusted for inflation, or income, or affordability. Beyond that, new homes represent less than 10% of the overall market. With 90%+ of the market a lot closer to its recent lows than prior highs, I see little reason to worry that we are in a new bubble.

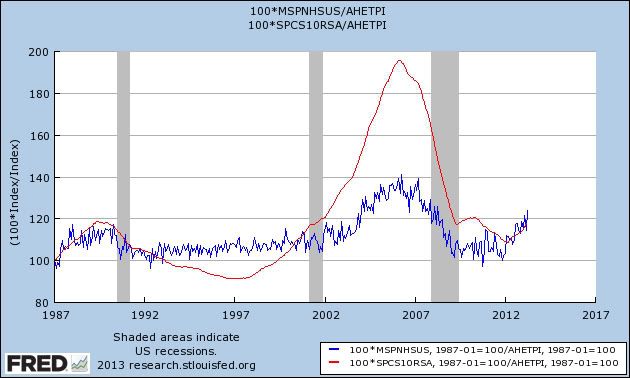
Let's look at a second measure of affordability, house prices as a multiple of average hourly wages. In the graph below, Case Shiller is in red and median new single family home prices are in blue:


While new home prices as a multiple of average wages are a little closer to their maximum than minimum values, the broader market shown by the Case Shiller index is still very inexpensive, equivalent of only 2002 values.

Next, in response to my article on Friday, I was pointed to the site Political Calculations, which claims that we are in a new bubble as measured by new home prices as a multiple of median household income. It looked to me like they were making the same mistake as Zero Hedge, but a commenter said I was wrong. To use the best data, I turned to Doug Short, who does have access to Sentier's monthly median household income data (which is the data source for Political Calculations as well). I asked Doug to do a nominal to nominal ratio, and here is what he got:


Doug also did a rolling 12 month average:


To be fair, this data does look more bubblicious, although really only two months' of data are close to the 2006 top. Keep in mind, however, that this is only the new single family home data. There is also a second issue with using the Sentier data, and that is thet the "households" whose income is being measured includes all headed by someone 16 or above - including retirees. Since the Boomer generation is retiring at the rate of 10,000 a day, and retirees have lower incomes than working households, the Sentier data is skewed in the same way that the employment-to-population data is, since we can expect that a greater share of households are retirees for the last 10 years, and that trend is going to continue.

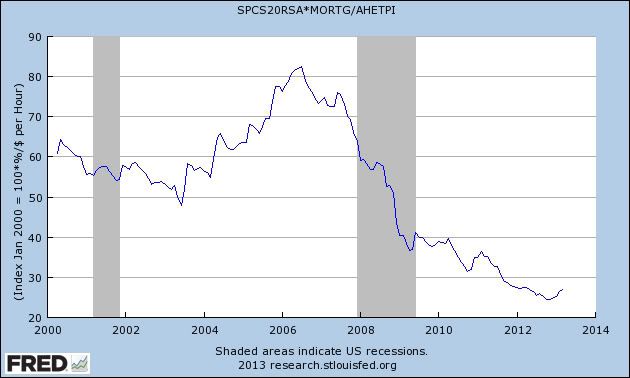
Finally, a commenter asked me to take a look at the effect of mortgage rates. So in the next graph, I've takent he Case Shiller sales data and multiplied by the 30 year mortgage rate. Thus, the higher the mortgage payment, the more unaffordable the price of the house. Here's the result:


That un-bubbly result is only amblified when we also measure the result by the average wage. First, here's the Case Shiller result:


And now, here is the result as applied to the median price of a new single family home:


Could new home prices, being very volatile on a monthly basis, retrace most of their run up in the last six months? Of course! But measured by the mortgage payment an owner earning the average wage must pay, whether we use the broad Case Shiller index, or the narrower median new home sales price index, house prices are about as far from a bubble as you can get. .

Australian Industry In Pro-Longed Contraction

From the latest Australian Industry Groups' PMI release:

The latest seasonally adjusted Australian Industry Group Australian Performance of Manufacturing Index (Australian PMI®) rose 7.1 points to 43.8 in May. It recovered much of April’s sharp decline, to be broadly in line with the average (negative) level seen over the past year.

■ This marks the 23rd consecutive month of contraction in the sector (with 50 points marking the separation between expansion and contraction). Interest rate cuts by the RBA over the past year appear to have had little impact on activity levels thus far.
 

The capacity utilisation rate is now below 70%, which is only just above the levels recorded during the GFC. And although still registering expansion (readings above 50 points), the input prices and wages growth sub-indexes fell to their lowest levels since June 2009.
 

■ Impediments noted by manufacturers in May included: continued weakness in housing construction; low levels of business confidence and investment intentions; rising energy costs; the high Australian dollar; public sector spending contractions; fierce competition from imports; flat local demand; and reduced confidence due to the Federal Budget and impending election.
 

Here's a chart of the data:


 There are several points to note from the above report.

First, the sector is in a long-term contraction that is almost two years long.  More importantly, the standard method used by central banks to encourage growth (a drop in interest rates) is not having an effect.  This tells us that cost of capital is not an issue; instead, the problem is deeper.

The number of "impediments" listed in the report is very broad and can't be easily dismissed or cured.  Also remember that the Australian economy is part of the "south-south" trade -- the southern hemisphere pattern of raw material exporters supply China's manufacturing engine. 


Even Krgthulu nods


- by New Deal democrat

Paul Krugman, yesterday:
So as I see it, we should first of all be evaluating models, not individuals; obviously we need people to interpret those entrails models, but we’re looking for the right economic framework ....

So, as I’ve made very clear on this blog, my view is that a pretty standard IS-LMish macro model has done very well in recent years.
Paul Krugman, October 13, 2009:
[T]his is a really, really bad time to be relying on conventional indicators.
....

So historical correlations, to the extent that they exist — and as Shedlock points out, ECRI is claiming a much better record than it really has — can’t be counted on to prevail. There’s really no alternative to making fundamental analyses of the macro situation.
Perhaps others will disabuse me, but it seems clear to me that this is:
  • (a) a direct contradiction, on
  • (b) a pretty fundamental point.
Either we should or should not have paid attention to models of economic behavior. Now, in retrospect, Krugman is saying that we should have, but four years ago it certainly seems that he took a strong stand that we shouldn't. If a Nobel Prize winner, over time, isn't sure on this point, how can we poor mortals be expected to put our trust in economists?

P.S. In 2009 ECRI responded to Krugman, making a gentleman's bet that one year later they would be proven more right than Shedlock. I kept track, and ECRI won the bet.

Condolences, Thoughts and Prayers of Support For Stirling Newberry

Stirling Newberry is without a doubt one of the smartest people I have ever met.  I had the good fortune of sitting on a panel with him a few years ago.  While I had spent an inordinate amount of time preparing my presentation, he got up -- with no notes -- and gave a doctoral presentation on the then state of the economic debate from memory.  Its fair to say he's forgotten more about history and economics then most people remember.  He's also the person most responsible for my becoming an economic blogger.

Unfortunately, Stirling has had a stroke.

We wish you all the best and hope for a speedy recovery.


Market/Economic Analysis: US

Let's start with a look at the economic news of last week.

The good: The Case Shiller home price index increased 10.8% Y/O/Y and 1.38% M/O/M.  Putting it bluntly, housing is making a comeback.  While this price increase has been the basis for claims of a new housing bubble, NDD and I demonstrated that prices are not out of control relative to DPI and that the increase in price is really a function of declining inventory (see here and here).

The second estimate of US GDP printed at 2.4% for 1Q13.  Here's the money quote from the report:

The increase in real GDP in the first quarter primarily reflected positive contributions from personal consumption expenditures (PCE), private inventory investment, residential fixed investment, nonresidential fixed investment, and exports that were partly offset by negative contributions from federal government spending and state and local government spending. Imports, which are a subtraction in the calculation of GDP, increased. 

The acceleration in real GDP in the first quarter primarily reflected an upturn in private inventory investment, an acceleration in PCE, a smaller decrease in federal government spending, and an upturn in exports that were partly offset by an upturn in imports and a deceleration in nonresidential fixed investment.

The Chicago PMI Increased from 49 to 58.7, a mammoth increase.  The internals for this report also increased at sharp rates. 

And finally, "The Thomson Reuters/University of Michigan final index of sentiment increased to 84.5 in May, the strongest since July 2007, from 76.4 a month earlier. The median forecast in a Bloomberg survey called for the gauge to hold at its preliminary reading of 83.7."


The Bad: While the Richmond Fed did increase, it moved from -6 to -2, meaning this region is still in a mild contraction.  Unfortunately, most of the internals are still negative as well.  The Texas manufacturing index is also printing at a negative level, moving from -15.6 to -10.5.  However, the internals of this report are better, indicating stronger moved ahead are possible. 

The worst piece of news came on the consumer front.  

Personal income decreased $5.6 billion, or less than 0.1 percent, and disposable personal income (DPI) decreased $16.1 billion, or 0.1 percent, in April, according to the Bureau of Economic Analysis. Personal consumption expenditures (PCE) decreased $20.5 billion, or 0.2 percent.   In March, personal income increased $36.2 billion, or 0.3 percent, DPI increased $25.4 billion, or 0.2 percent, and PCE increased $14.2 billion, or 0.1 percent, based on revised estimates. 

Real disposable income increased 0.1 percent in April, compared with an increase of 0.3 percent in March. Real PCE increased 0.1 percent, compared with an increase of 0.2 percent.

Given that we're in an environment when unemployment is over 7%, this is to be expected.  However, there is only so far or fast an economy that is 70% based on consumer spending can advance when it prints income and spending numbers like those printed this month.


Let's turn to the markets.


Despite all the hand-wringing regarding Friday's close, the chart shows prices are simply in a downward channel.  There are several logical price targets for this downtrend: 160 -- the price level established in mid-April, the red trend line connecting early January and mid-April lows and 155, which is a Fib level.  The high volume and MACD indicate more downward moves are probable.


As I noted last week, the belly of the treasury curve is right at critical support.  The reason for the drop is investors and traders are now seriously considering the possibility of the Fed tapering off its bond buying program:

Treasuries recorded the steepest monthly loss since 2009 amid speculation the Federal Reserve could curtail its unprecedented monetary stimulus program if recent improvement in domestic economic data is sustainable. 

U.S. government debt tumbled 1.8 percent in the month through May 30, the most since December 2009, according to Bank of America Merrill Lynch index data. Yields extended gains yesterday after a report showed consumer confidence rose in May to the highest level since 2007. A government report on June 7 is forecast to show the U.S. added 165,000 jobs in May and the unemployment rate remained at a four-year low of 7.5 percent. 


The dollar retreated last week, falling through the 22.6 level established in March and finding support at the 61.8% Fib level.  The 50 day EMA is also providing technical support.  Also note the selling signal given by the MACD.

The dollar is considered a safe haven currency.  As equity markets are still getting attention, it makes sense that we'll see the dollar sell-off a bit. 

Sunday, June 2, 2013

A note for Sunday: political and economic ennui; or, the Grand Piecemeal Bargain


- by New Deal democrat

Note: regular nerdy economic blogging will resume tomorrow.


Digby says that:
 The online left has seen a steep decline in traffic since the election ..., which indicates to me that our audience in general is simply not interested in following politics at the moment
....
We've been through a number of elections, crises, other ups and downs over the past decade but I've not seen anything like the drop in interest over the past few months.... [T]he liberal audience is tuning out and one can only  assume it's because they don't like what they see in our politics.
There's been a similar decline in traffic at economic blogs over time as well, for similar but not identical reasons.

In both cases I think the largest portion of the problem is ennui: the listlessness that comes from a feeling of lack of present or anticipated movement.

In the case of the economic blogosphere, the reason for the ennui seems straightforward. The economy is plodding forward, like a car stuck in first gear. It's moving in the right direction, but going way too slowly. And it shows no signs of changing substantially in the future. Almost nobody is calling for a boom. Even more surprising, almost nobody is calling for an outright recession either (Hussman seems to have thrown in the towel, and does ECRI even count anymore?). Once a month we get a little excited about the employment report, and that's about it. There's not a lot of reason for the average person with an interest in how the economy is doing and how it might be affecting them to suddenly need to pay attention.

In the case of the progressive political blogosphere, a brief expansion on Digby's point seems in order. A large part is that the GOP House is blocking all action, which Digby points out. It's also worth noting that there's enough personally vitriolic history among left bloggers that many have simply retreated into the comfort of their own corners. Hence the continual and continuing erosion of active participants at Kos's blog.

But beyond that, what is the new and exciting idea, or at least an idea that would substantially benefit most Americans, that the democratic party wants to pass? Nothing, that's what. About the only thing on Obama's second term agenda seems to be immigration reform, and even that boils down to how much a few GOP Congresscritters can be moved beyond the position that "all illegal aliens, and their children, even the ones born here, should be rounded up en masse and deported back to Latin America." Can you think of anything else? Even something being clamored for enthusiastically by the left netroots? I can't.

It isn't that the right is enacting anything either. They can obstruct, but they can't make any major affirmative moves.

So what we've wound up with is the Grand Piecemeal Bargain of the sequester - the thing that was supposed to be so awful that it would never be permitted to happen, but has been in effect for 3 months and is only going to continue to get worse. There won't be any "Grand Bargain" unless the GOP learns how to embrace Obama's ever escalating capitulations. What there will be is a death by 1000 sequestered cuts of America's safety net. That won't include any significant sacrifices by the rich, the military, or large corporations. It also won't include cuts to large, visible middle class programs, unless the GOP can figure out a way to make sure the democrats own them, and enough democrats are stupid enough to go ahead and own them (and be ready for the Democratic Gotterdammerung that will absolutely follow). It will continue to suck ever more to be poor.

Once upon a time, the progressive blogosphere believed in "Crashing the Gates." Anyone noiticed Kos crashing any gates recently? He really, really doesn't want to come out swinging against Obama, so he pretended to be shocked, just shocked, by Obama's explicit budget proposal to make cuts to Social Security. Do you see anybody trying to mount a progressive insurgency in the democratic party in 2014 or even 2016? I don't.

So we are left with the reality of the Grand Piecemeal Bargain. Who wants to tune it for that?