Saturday, August 6, 2011
Weekly Indicators: signs of a rebound edition
This past week was bookmarked by the conclusion of this episode of idiocy in Washington on Monday, which at the end of Friday bore its rancid fruit in the downgrade of the US's credit rating. Such is the consequence economic hostage-taking and capitulating thereto. The other big news was a positive surprise in July nonfarm payrolls and upward revisions to May and June. Motor vehicle sales for July also improved. Real personal spending was flat, and real income increased .03%. On the other hand, manufacturing's poor streak continued with a surprisingly poor ISM report and durable goods. ISM services also declined.
Oh, and there was a stock market crashette on Thursday.
This week I want to reiterate why I look at high-frequency indicators. Simply put, by the time you get two monthly data points, at least 7 weekly data points (x 11 series) have been reported. If those show a clear continuation or break in trend, you will know about it long before it is apparent as a trend in the monthly data. This year, the weekly data began to show serious signs of a stall by the end of March, while most commentators were still complacent.
This week, for the second week in a row, the high-frequency weekly indicators show signs of a rebound. Eight were positive, two were neutral, and only one was negative.
First, let's look at the positive signs:
The BLS reported Initial jobless claims of 400,000. The four week average decreased to 407,750. Jobless claims have now broken out to the downside from their recent range of 410,000 - 430,000. With the exception of two months earlier this year, initial jobless claims are at their best level since 2007.
With the exception of some weakness in May and June, same store sales have been holding up all year like a champ. This week the ICSC reported that same store sales for the week of July 30 increased 4.0% YoY, and increased 0.3% week over week. Shoppertrak reported a 4.1% YoY increase for the week ending July 30 and a WoW increase of 0.5%. This is the sixth week in a row of a strong rebound for the ICSC, joined for the third week by Shoppertrak.
The Mortgage Bankers' Association reported that seasonally adjusted mortgage applications increased 5.1% last week. For the 9th time in 10 weeks, the YoY comparison in purchase mortgages was positive, up 5.9% YoY. Refinancing also increased 7.8% w/w.
If home buying data has turned positive YoY in the last few months, home prices declines have become less negative. YoY weekly median asking house prices from 54 metropolitan areas at Housing Tracker showed that the asking prices declined -3.8% YoY. The areas with double-digit YoY% declines decreased by one to 7. The areas with YoY% increases in price increased by two to 10. This continues the record of improving YoY comparisons in this series. By way of comparison, just a couple of months ago only 3 or 4 areas had actual increases, and well over 10 had decreases. At the beginning of this year, only one metro area was showing YoY increases.
Both Real M1 and Real M2 are solidly bullish. M1 increased 1.1% w/w, and also increased 1.6% m/m, and 14.7% YoY, so Real M1 was up 11.3%. M2 increased 0.2% w/w, and also increased 2.0% m/m, and 7.9% YoY, so Real M2 was up 4.5%.
Comparing the entire month of July m/m and YoY, M1 was up 2.5% m/m and 10.6% YoY, so Real M1 was up 7.2%. M2 was up 2.2% m/m and 7.6% YoY, so Real M2 was up 4.2%.
Withholding tax payments have rebounded strongly from with their May - June stall. Adjusting +1.07% due to the 2011 tax compromise, the Daily Treasury Statement showed that for the first 3 days of August 2011, $32.76 B was collected vs. $31.9 B a year ago, for an increase of $7.8 B. For the last 20 days, $148.9 B was collected vs. $130.1 B a year ago, for an increase of $18.8 B, or 14.5%.
Weekly BAA commercial bond rates decreased .03% to 5.72%. Contrastingly, yields on 10 year treasury bonds remained the same at 2.97%. This continues to indicate slowly increasing deflationary fears, but an actual decrease in relative distress in the corporate market.
Finally, Oil finished at $86.63 a barrel on Friday. This is the lowest price since last November, and is nearly $10 below its recession-trigger level.
Two series remained neutral or mixed:
The American Staffing Association Index remained steady at 88. This trend of this series for the year remains worse than 2007, but slightly better than the early recession of 2008 - and just slightly better than a complete stall.
The American Association of Railroads reported that total carloads increased 0.3% YoY, up 1500 carloads to 533,300 YoY for the week ending July 30. Intermodal traffic (a proxy for imports and exports) was up 7600 carloads, or 3.3% YoY. The remaining baseline plus cyclical traffic was down 6000 carloads, or -2.0% YoY%. This is the second time in four weeks that this series has gone negative. Using the breakdown that Railfax graciously provided to me, baseline traffic was down 11,400 carloads, or -6.0% YoY, while cyclical traffic was up 5400 carloads, or +5.0% YoY.
Finally, one important series remained very negative:
Gas at the pump rose another $.01 to $3.71 a gallon. Gasoline usage at 9218 M gallons was -2.8% lower than last year's 9477. This is the sixth week in a row that gasoline usage has been significantly less than last year. Further, with the exception of 3 weeks, this comparison has been negative YoY since the week of March 12. This series, more than any other, presaged economic weakness this year. It will be interesting to see what happens as Oil's decline from $115 several months ago to $86 now filters through into prices at the gasoline pump.
At the beginning of this year, I believed that high and rising Oil prices, and idiocy in Washington, would bring the economy to a standstill by midyear. For now, Oil has backed off. Will the downgrade in the US's credit rating chasten the idiots, at least to do no further harm?
Enjoy your weekend!
Friday, August 5, 2011
Post Debt Ceiling Reads
Sell the Bounce
Heading for a Double Dip Recession?
Market's Major Trend Now Down
We Need Infrastructure Spending and Extension of Unemployment Benefits to Spur Demand
Market Meltdown Ahead?
Debt Deal Darkens Fragile US Outlook
Averages Cross 200 day SMA
On the Edge ... Again
Assessing the Damage
Possibility of a Recession Increasing
Stocks Pricing in New Recession
Where's the fear?
To hear much of the breathless commentary yesterday, the world is on the verge of another 2008-style financial seizure, where nobody is willing to loan anybody else any money for fear that their counterparty (typically, a European bank) could suddenly be found insolvent.
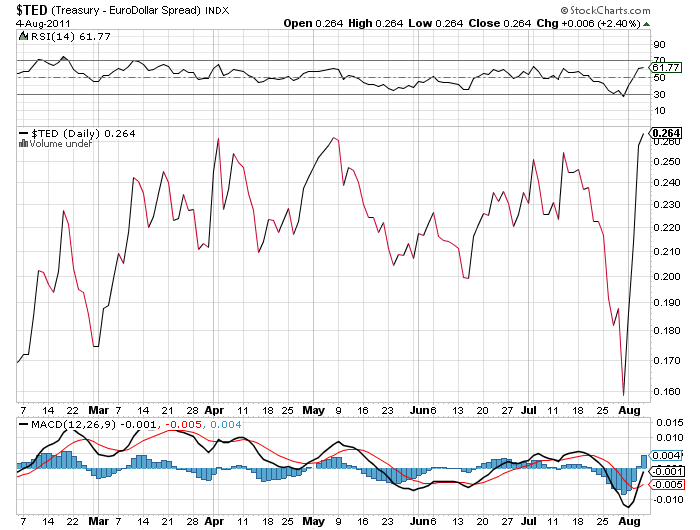
Indeed, if one looks at the six month trend in several measures of banking risk often cited in 2008 - the TED spread and the LIBOR rate - there certainly has been a spike.
Here is the recent TED spread:
and here is the recent LIBOR rate:
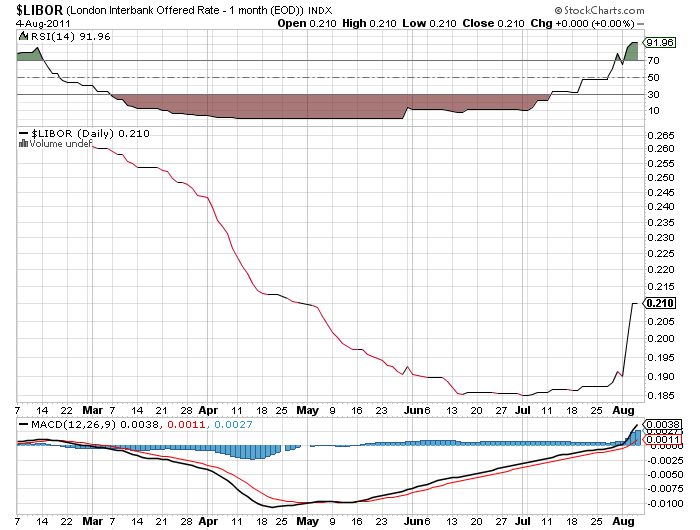
ZOMG, the banking system is seizing up!!!
Right?
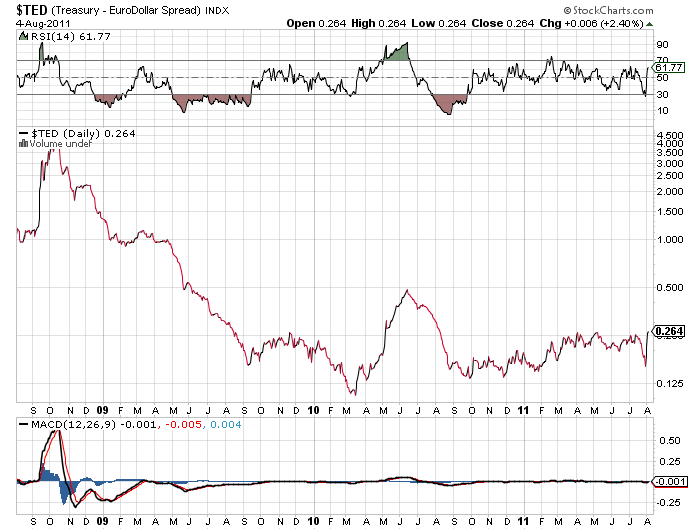
Well, if you take a longer term look, not so much ....
Here is the three year history of the TED spread:
and here is the three year graph of LIBOR:
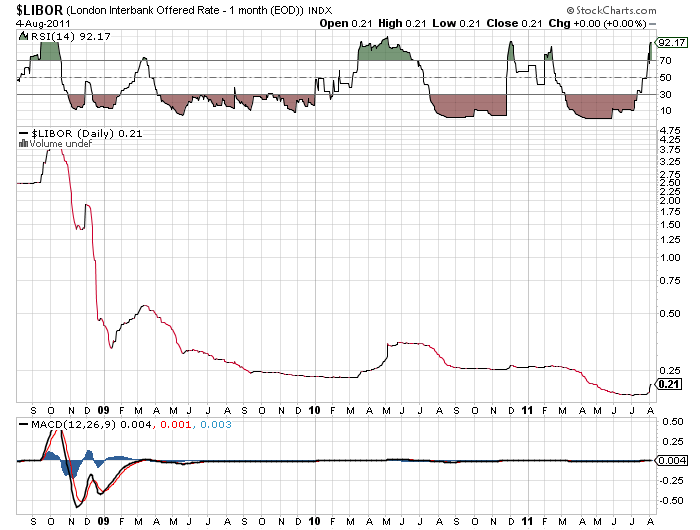
Neither of these measures of banking risk have even approached their summer 2010 highs, and aren't even in the same league as their 2008 readings. Simply put, whatever happened yesterday had nothing to do with fear of banks suddenly becoming insolvent a la the crisis of 2008. To repeat, these readings show no meaningful increase in fear of a financial system meltdown.
Instead of putting their money under mattresses, the clear winner this past week has been bonds. Ironically, for all of the idiocy surrounding the US debt limit, US treasury bond prices have been skyrocketing (and yields falling to near their 2008 lows).
But it isn't just government bonds. Here is a graph of BAA corporate bonds going back 25 years:

Indeed, BAA corporate bonds are now yielding their lowest rate since 1966 - 45 years ago!
Recently I've also highlighted the Dow Jones Bond Average as a good leading indicator in deflationary eras such as the 1920s and 1930s, and pointed out that it both peaked and troughed in advance of stocks in the 2008-09 recession. Here is a graph of the DJ Corporate Bond Index for the last five years through Wednesday:
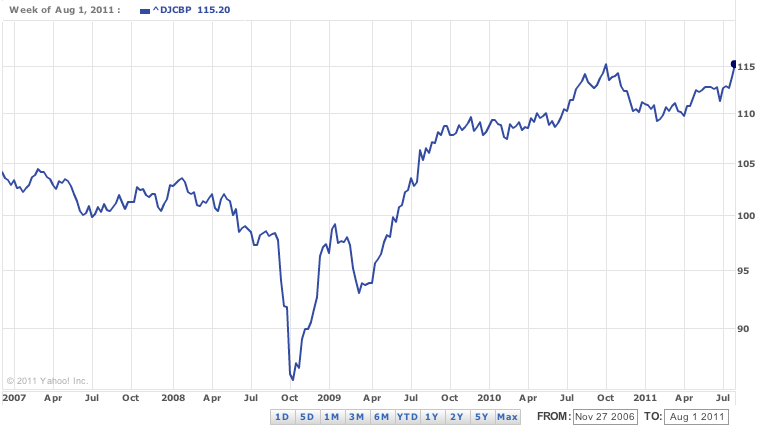
This series made a 5 year high on Wednesday. It surged another .72 yesterday to 115.92 - close to its all time high.
If we are on the verge of another destructive recession, some B grade corporations will default on their bonds. And yet the markets show no such fear.
+117,000 on Payrolls; Unemployment Rate to 9.1%
Employers added more jobs than forecast in July, the jobless rate fell and wages climbed, easing concern the U.S. economy is grinding to a halt.Payrolls rose by 117,000 workers after a 46,000 increase in June that was more than originally estimated, Labor Department data showed today in Washington. The median estimate in a Bloomberg News survey called for a July gain of 85,000. The jobless rate dropped to 9.1 percent as more Americans left the labor force, while average hourly earnings climbed 0.4 percent.
Job gains may need to accelerate further to bolster consumer spending, which rose last quarter at the slowest pace in two years. Weaker growth puts more pressure on Federal Reserve policy makers meeting next week to try to steer the world’s largest economy away from another recession at a time when inflation is also accelerating.
“The labor market, despite some gains, remains in a rather fragile state,” Chris Rupkey, chief financial economist at Bank of Tokyo-Mitsubishi UFJ Ltd. in New York, said before the report. Rupkey projected payrolls would increase by 130,000. “Businesses remain cautious and it will take a number of years before the unemployment rate gets back to pre-recession levels. The anxiety level is high and risks of a slowdown are everywhere.”
Right now, the BLS website is down so I can't look at the underlying data.
This not a great report, but it is fair and in line with what I wrote yesterday regarding the economy. We're not in great shape, but we're also not looking at Armageddon.
What the Hell Happened in the Markets Yesterday?
So -- what the hell happened yesterday? There was huge confluence of events in the market.
1.) The EU Commission President stated the EU issues were no longer contained to the periphery. There are a lot of issues between the various countries here that are beyond my knowledge, but Spain and Italy are now having problems with their respective bond yield (their yields are blowing out) indicating investors are concerned about those economies.
2.) The US economic news has been growing increasingly negative for the last few months. This started with the US manufacturing sector, which was hit by the supply slowdown that started in Japan. Then we had the last two employment reports, which were far weaker than anticipated. This was followed by a massive downward revision to first quarter GDP and a weak 2 quarter GDP print. We've also seen consumer spending slow. However, as I noted yesterday, the overall economic numbers show a weak US economy at this point, but not a recessionary environment.
3.) Market participants have uniformly panned the debt deal package as counter-productive in the current economic environment. Once the debt deal was signed, the markets started tanking -- and have been ever since.
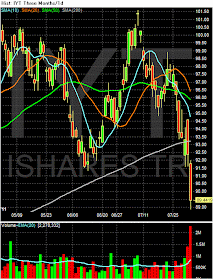
4.) Several markets were already through important technical levels, which aggravated the market's weak position and accelerated the selling. This led to computerized sales adding further downward pressure. Below are the charts of the major equity tracking ETFs, which all show technical weakness:


Thursday, August 4, 2011
An Appraisal of the Current US Economic Situation
However, let's pull the camera back a bit a take a look at the 30,000 macro view and see what the numbers say. In other words, let's look at the data rather than the hyperbole.
Let's start with the most recent Beige Book, which has data through July 15:
Consumer spending increased overall, with modest growth of nonauto retail sales in a majority of Districts. Falling gasoline prices throughout most of this reporting period may have encouraged a pickup in shopping trips and some additional spending since the previous Beige Book. Price pressures from food, energy, cotton, and other supplier inputs continued to squeeze retail margins. Auto sales slowed a little since the previous Beige Book, with inventories still lean due to Japanese supply chain disruptions. The summer tourism season has started off stronger than last year in most areas unaffected by severe weather.Activity among nonfinancial service sectors improved overall in most Districts. Of the five Districts reporting on transportation services, volumes were mostly up. Manufacturing activity expanded overall, with two Districts growing at a somewhat faster rate since the last Beige Book, many Districts reporting steady or slowing growth, and two Districts reporting little change. Among firms reporting on near-term expectations, the manufacturing outlook remained generally optimistic, but capital spending plans were somewhat more cautious.
Most residential real estate activity was little changed and remained weak, although construction and activity in the residential rental market continued to improve since the previous Beige Book. For six Districts, activity in the nonresidential real estate market has improved slightly for specific submarkets, although conditions generally remained weak across all twelve Districts. Since the last Beige Book, overall loan volumes have increased in three Districts, decreased in two Districts, and were relatively flat, often with mixed trends across the banks' portfolios, in five Districts. Credit quality was steady or improving.
The consumer is in fair shape. He is spending a bit, but not a lot. Gas prices are dropping which may be encouraging some activity. Both the service and manufacturing sectors are still increasing, although manufacturing is slowing. Real estate is still weak.
Let's look at some broad data.
Real PCEs are now above their previous highs. However, they have dropped the last three months. Put another way
After growing at a decent pace for the last year and a half, they have clearly slowed. Another way to say this is aggregate demand is clearly dropping, which is a sign the overall pace of economic activity is slowing. However, also note there is a roughly two year intervening period of growth in this number, indicating expansion.
Real retail sales slow a stalling of upward momentum, but no serious downward move.
The ISM aggregate manufacturing index is nearing 50. However, this part of the economy is still expanding, albeit at a slower pace. In addition, note the period of expansion between the last recession and the current readings which show a two year period of expansion.
Let's look at the anecdotal information from the latest ISM report on manufacturing:
There are a few trends in the above data.
- "Inflation pressures have finally slowed down." (Chemical Products)
- "With products sold internationally, the business conditions we are currently experiencing are declining from abnormally [high] record-breaking levels. Business conditions are currently flattening to more normal volumes, while trending slightly downward." (Machinery)
- "Market conditions — Europe weak, U.S. soft, Asia strong." (Computer & Electronic Products)
- "Demand from automotive manufacturers continues to improve." (Fabricated Metal Products)
- "Export sales very strong, while domestic sales are sluggish." (Paper Products)
- "The looming debt ceiling has government agencies backing away from spending. Forecasting a slowdown in demand in the short term." (Transportation Equipment)
- "Generally seeing a slowdown, which is typical this time of year. Hopeful that this is seasonal only." (Plastics & Rubber Products)
- "Most industrial customers seem to be sustaining their business. Export orders continue to remain strong. Price pressures persist, especially with commodity materials." (Chemical Products)
-- The US and Europe are weak
-- Asia is still strong
-- Price pressures from rising commodity prices are slowing
-- The debt ceiling debate was a net negative for the economy
One point of concern in the latest report is the drop in new orders to a level of 49, which shows contraction. That could lead to a negative ISM print in the next 2-3 reports.
Let's turn to the ISM service index
This number is still positive and turned higher by a few points in the latest report. Let's look at the anecdotal points from the same:
"Sales and customer traffic recovered slightly, pulling even with last year after trending lower for several months. Discretionary spending per customer has continued to decline in all areas of the operation." (Arts, Entertainment & Recreation)
- "Sales volumes are steady. Input costs are increasing." (Agriculture, Forestry, Fishing & Hunting)
- "Business outlook remains steady, but concerns about the second half of the year remain." (Professional, Scientific & Technical Services)
- "Municipal government has not bounced back at a similar pace to the private sector." (Public Administration)
- "New home construction is still very slow. Repair and remodel is the only bright spot." (Wholesale Trade)
- "Commodities cooling off and dropping a bit." (Retail Trade)
The above comments indicate a moderate pace of expansion with concern about the next 6 months. But there is no indication of a serious contraction.
Both new and existing home sales appear to be bumping along a bottom -- and have been for the last few years. However, it's hard to see how we can have a serious contraction with both of these numbers already in the doldrums.
The point is that the economy is weak and has been for some time. The recent GDP revision indicate the first half of this year was considerably weaker than first thought. However, there are currently no signs of an impending financial or economic Armageddon. There are serious concerns that the budget deal certainly did not help our current situation in any way, shape or form. In fact it probably added to downside economic pressure. But as of now there is no sign we'll be repeating anything like 2007-2008.
The Failure of Austerity
The trouble in Italy and Spain came amid more signs that European economies are rapidly slowing as nations across the continent tighten their fiscal belts to combat high debt loads. At the same time, economists warn, the spending cuts in the U.S. debt agreement could undercut the anemic U.S. economic recovery. Concerns about slower growth are already rattling global markets and raising the prospect that European countries will have an even harder time than anticipated restoring themselves to health.And then there is this:
“The U.S. debt ceiling debate has, I think, really eroded confidence among consumers and businesses in addition to creating uncertainty,” Stock said in an interview. “The resolution of uncertainty with the compromise doesn’t restore with it the view of legislative competence in economic management.”
I have a GREAT idea. While the economy is already weak, let's embrace austerity! That will slow growth even more and increase out debt to GDP ratio so we can then engage in even more austerity to slow the economy even more ....
Jobless claims: a ray of light through the dark clouds
There's certainly been a lot of bad economic news lately, so it is worth noting that with this morning's initial jobless claims data, the 4 week average of initial claims has broken out of its recent 410,000 - 430,000 average to the downside: 407,750.
This is the lowest average number of claims in 4 years, with the exception of mid-February through mid-April of this year.
---
P.S. to Doomers: You're still cherry picking your sources. The Pied Piper of Doom has another copy-and-paste job featuring Krugman's article, "Hope is not a plan".
The Doomers are out in force with statements like, "as we doomers said plenty of times we hoped we were wrong, but we feared we we gonna be right. We were right, damn.........."
So guess which lines from Krugman's column were conveniently omitted from the Doomgasm this morning? If you guessed,
Larry Summers puts the odds [ of renewed recession] at one in three; I might be slightly more optimistic, but the risk is very realyou're right. Krugman sees less than a one in three chance of an actual double-dip.
For all of the bad news (and the debt deal makes it worse), there are very few economic series actually rolling over to the downside, and there are a few important ones breaking out to the upside. More next week.
Can Anyone Find A Credible Economist Who Is Projecting Increased GDP From the Debt Deal?
Can anyone find a credible economic projection showing increased economic activity as a result of the debt deal? This eliminates "think tanks" and hard partisans like John Taylor and Professor Perry. Also -- are they just saying "we'll see increased growth" or are they also printing their assumptions? Without their assumptions their projections are garbage.
- J.P. Morgan: "we continue to believe federal fiscal policy will subtract around 1.5%-points from GDP growth in 2012"
- Tim Duy's "simple model": "0.6 and 0.7 percent, respectively, for the final two quarters of [2011]," and getting worse in 2012.
- Macroadvisers (h/t Brad DeLong): "a modest 0.1 percentage point of GDP growth in FY 2012," with the damage to be done by the Gang of 12 "No Revenooers" to cause death and destruction as Obama prepares to leave for Bachmann-Perry Overdrive (the MA graphic shows about 1/8th of 1%).
- Ryan Avent (on his Twitter feed yesterday): "Assuming no extension of the payroll tax cut or UI benefits, the US is looking at a 2% of GDP effective fiscal tightening over the next year." (NOTE: Later details appear to be that this is basically 2.6% decline from tightening, 0.5% cyclical gain, netting to around 2%. Reference also made to JPMC survey above.)
Please, post them in the comments so I can see their models.
Thursday Oil Market Analysis
Yesterday, all speculative commodities took a hit as the markets started to seriously consider the possibility of a US default. Right now, this trumps the overall supply and demand situation. Should a default occur, expect prices to move lower, as a default will slow economic growth and thereby lower overall demand. However, if a default is avoided, expect the upward trajectory to continue.For the last month, my central thesis for the oil market was it would continue to move higher based on the increase in Asian demand and the U.S.' "summer driving season." Even though Asia is slowing, it is still growing at high rates, increasing demand.
This thesis ran into two problems last week. The US printed a very weak GDP report with sharp downward revisions to the first quarter GDP. The US debt deal will decrease US growth over the next few quarters, lowering overall demand (more on this later today). As such, oil moved sharply lower last week. Let's look at the charts:

On the 5 minute chart, prices are clearly moving lower. They have continually broken through support to move to new lows and are now in a downard sloping channel.

The daily chart shows the action in sharp detail. After getting just above the 50 day EMA, prices broke their upward trend line and moved sharply lower. Now prices are below all the EMAs (especially the 200 day EMA) and all the shorter EMAs are moving lower. The MACD has also given a sell signal.
The next key level of support is 90/bbl. Should prices move lower, we'll have to go back on the chart to fine support and resistance.
Wednesday, August 3, 2011
The Washington Lobotomy Factory Proves Itself
And that's where the rub is. Instead of engaging in a nice infrastructure program which will lead to decades of growth where we can borrow at incredibly cheap interest rates, put a ton of blue collar people back to work, lower the unemployment rate, solve the problem of our deteriorating infrastructure and start to increase aggregate demand we do the exact opposite.
And that's why I call it the Washington Lobotomy factory. It's completely backward and governed by stupidity.
BTW: thanks for the upcoming slow growth, guys. It'll be a pleasure.
Shanghai still leads
With Monday's surprise steep decline in the ISM manufacturing index from 55.3 all the way down to 50.9 (right at the inflection point between expansion and contraction), it is clear that manufacturing, which had led the recovery since 2009, has stalled.
The simple fact is that US manufacturing has stalled because Asian growth is stalling. Asian central banks are raising rates and trying to reduce leverage to control widespread inflation there. Bonddad pointed out about a month ago that the yield curve in India has inverted, as a result of those efforts.
One of my central tenets for the last few years has been that leadership of the global economy has passed from the US to China. This means that the Shanghai stock market, not Wall Street, leads. If you want to know where US manufacturing activity is heading, look to where China has been.
Here is a graph showing the Shanghai stock market performance for the last 3 years (orange) compared with the S&P 500 (green):
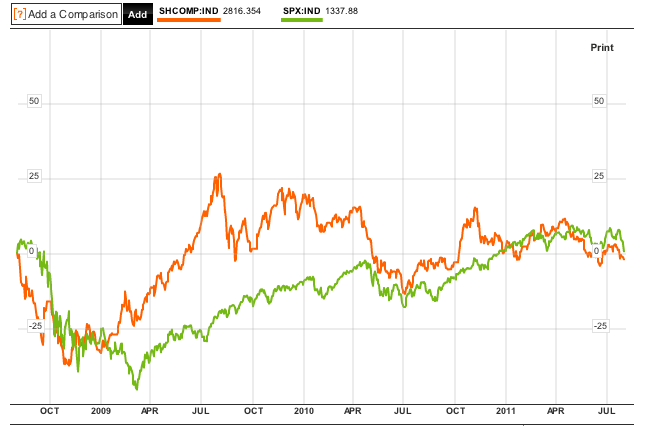
Note that Shanghai bottomed in November 2008, not March 2009 as happened in the US. China's market peaked in mid-2009, with a secondary peak last October. The US market continued to rise but has been unable to break through its April 2011 highs so far. Shanghai is down about 15% since its peak of last October - a classic decline in an economy where money is being tightened to tame inflation. The US market is off less than 10% so far.
So long as China cools, do not expect any re-acceleration in US manufacturing growth.
Wednesday Commodity Round-Up


Broader Markets Move Into Bear Market Territory
Tuesday, August 2, 2011
Why the Budget Deal Will Hurt the Economy -- Perhaps Badly
Ezra Klein:
The idea, in other words, is not about whether the government spends money better than individuals. After all, a lot of the policies advocated by the Keynesians, like the Making Work Pay tax cut, put money into the hands of individuals so that they can spend it. The idea is that the government has a role to play when, because of a “convulsive downturn,” a crisis begins feeding on itself.Keynes — and others who later elaborated on his work, like Hyman Minsky — taught us that although markets are usually self-correcting, they occasionally enter destructive feedback loops in which a shock to, say, the financial system scares business and consumers so badly that they hoard money, which worsens the damage to the system, which further persuades other economic players to hoard, and so on and so forth.
In that situation, the role of the government is to break the cycle. Because businesses and consumers have stopped spending, the government breaks the cycle by spending. As clean as that theory is, it turned out to be a hard sell.
And that hoarding is exactly what is wrong with the current economy.
Let's back up a bit. The economy is a circular flow of funds between business and consumers. Business pays consumers wages which consumers then spend on goods and services. This is one of the reasons the GDP equation (which is C+I+X+G) contains the C and I variables. (C)onsumer spending shows us how one half of the equation is working and (I)nvestment shows us how much money business is spending. But what's important to this situation is there must be momentum -- that is, there must be money flowing from business to consumers at a certain pace.
However, what happens if the pace of transactions slows down? For example, suppose the entire financial system is on the verge of collapse -- like 1929 (and 1930 and 1931) and 2008. What happens then? People become scared so they start hoarding money. This in turn leads to a slowing economy as the velocity of transactions starts to slow. Now, let's add a perpetually high unemployment rate to the equation, where people are continually concerned they won't have a job next month. This increases the propensity to slow consumption as people start to build their personal stash for what they perceive to be their coming layoff.
And this slowdown and increased hoarding is exactly where we are right now. There is some economic velocity -- but very little. Hence the slow GDP readings we've gotten for the last two quarters. In addition, we can see the lack of velocity in three economic statistics: person savings, business cash balances and monetary velocity.
The personal savings rate is a double edged sword. In the current environment it is both good -- because it indicates that people are delaying consumption, providing a cushion for the future and paying down debt -- and bad, because it indicates people are slowing their consumption -- which we've seen in the low year over year PCEs of this expansion. When PCEs account for 70% of economic growth, you need consumers to spend.
The above chart of checkable accounts and currency for non-financial corporate business shows that businesses have massive amounts of cash on hand. A fair amount of the gradual increase over the last 50 years is the natural increase in money supply that occurs as the economy has grown in actual size. But notice the massive, disproportionate spike that occurred after the end of the last recession. That tells us that businesses are also hoarding cash.
Finally, consider the following charts of money velocity for M1, M2 and MZM:
Money velocity shows the speed at which money is moving through the economy. M1 has been declining since the beginning of the recession and M2 and MZM are near historical lows. That tells us there is literally no movement of money through the economy, indicating the volume of transactions is very slow.
So sum up the current situation, businesses and individuals are hoarding cash - meaning they aren't spending it. We also see that from the incredibly low monetary velocity, which tells us the pace of transactions is incredibly low.
Hence, we need an actor to increase the economic velocity, which is where Keynes comes in. He argued that in times when there is massive hoarding (such as now) the government can step into the shoes of previous economic actors and get funds flowing again. It can also increase spending on things like infrastructure which lowers unemployment and thereby gets people spending again. And yet -- at the exact time when the economy needs a jolt to start moving -- we've decided to take money off the table, to further decrease the velocity of transactions in the economy.
From an economic perspective, especially considering the very weak GDP prints of the last two quarters, the budget deal is literally the perfect wrong move to engage in.
July employment preview
First of all, if Jimmy Hoover Obama has any honor, he will do as LBJ did in March 1968 and announce that he is no longer seeking renomination to a second term. One-and-fifteen football coaches typically do not spend a lot of time telling the fans how they hope to improve their record in the next season. In researching pre-WW2 economic indicators, I came across a quote by Prof. Geoffrey Moore that the 1937 recession came on very fast with little warning. Politically-induced contraction can strike literally overnight. Beyond that, I have little to say beyond what Profs. Thoma, Krugman, and DeLong, and Armando, Digby, and Riverdaughter have already said.
In the meantime, since I haven't spent much time on this lately, let me bring you up to date on some employment metrics, in anticipation of this Friday's July jobs report.
First, here is an updated scatterplot graph showing the relationship between initial jobless claims and private nonfarm payrolls for the last five years. Red is the descent into the recession, blue is from the monthly nadir for jobs in March 2009, and pink is the last two months :
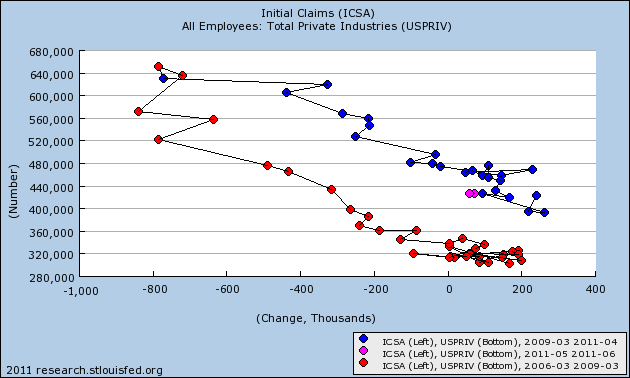
Currently expectations are for 75,000 private jobs to have been added in July. Initial jobless claims did decline in July, but if we are descending into a double-dip, expect the pink line to be extended to the left over the next few months.
In a similar vein, here is the updated Thumbcharts graph comparing the YoY 6-month average of initial jobless claims with the YoY average of jobs (i.e., comparing 0-6 months ago with 12-18 months ago). This relationship has held up rather well in the last few months:
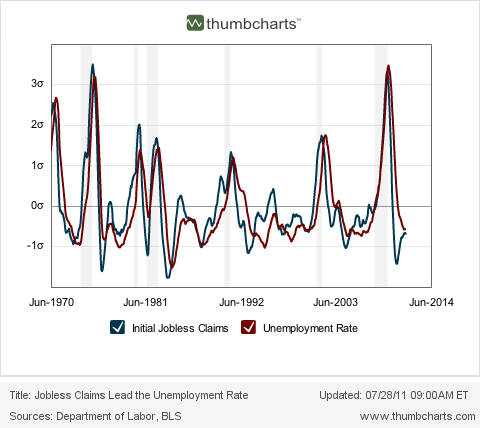
Since this graph tells us that the YoY jobs metric is likely to remain very positive, it suggests that outright negative numbers should not be expected yet.
Next, here are updated comparisons of real retail sales and GDP with nonfarm payrolls.
Here are real retail sales:
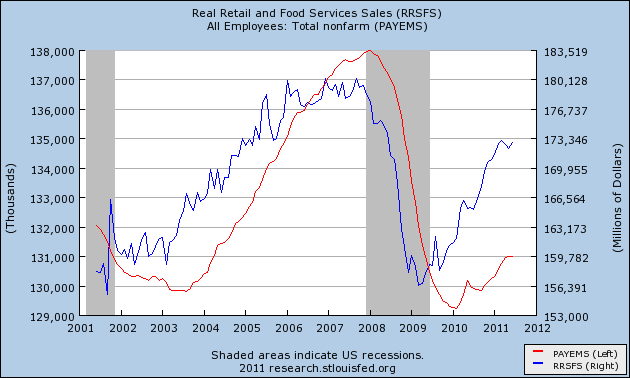
Real retail sales have not made significant improvements in the last few months, but they haven't turned negative either. As they have a 60 year record of leading the jobs numbers, I would not expect anything worse than a stall in job growth at this time.
Here is the YoY% comparison, to the same effect:
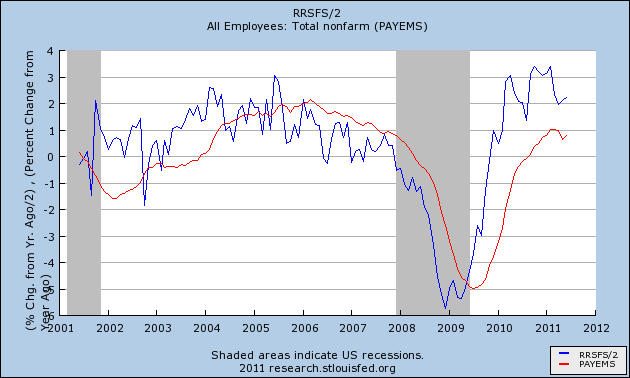
But on the other hand, here is GDP compared with jobs:
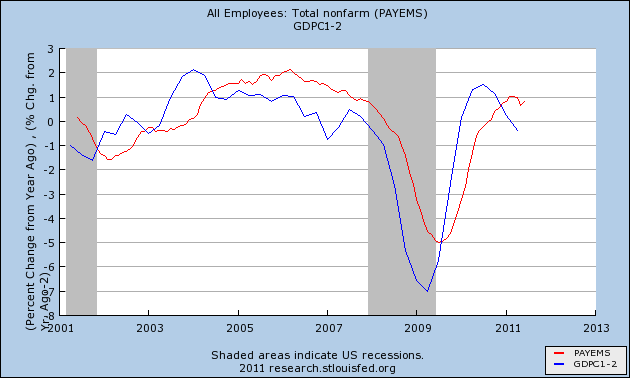
GDP also has a well-known relationship with jobs, for example see Prof. Menzie Chinn's discussion of Okun's law as applied to the recent GDP revisions. The GDP numbers predict an entirely different, and worse, scenario, of continued deterioration in the jobs picture (Note: since this graph measures YoY% change, deterioration might just mean "less positive" numbers than a year ago, vs. outright losses.)
In fact, since the beginning of the year a very sharp divergence between GDP and real retail sales has developed. Here is the graph:
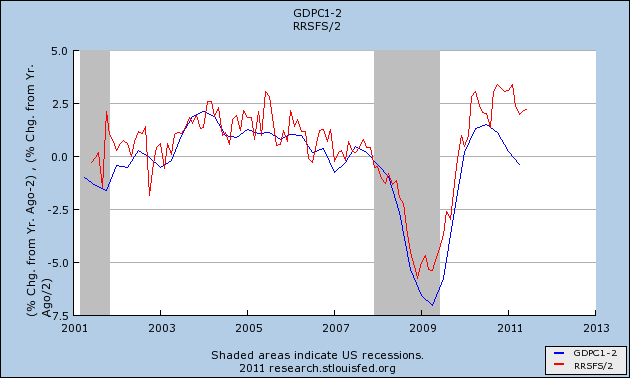
It is difficult to reconcile this divergence, but I suspect it has to do with energy costs and with the sudden stall in manufacturing after the Japanese tsunami.
The above relationships give us differing results. I would put the range of reason anywhere between about -60,000 jobs to +140,000 based on what we know now, with the most likely range between 0 and +80,000.
A Quick Note on the Markets
Monday, August 1, 2011
Treasury Tuesdays
Neither market has any firm direction right now and is instead at the mercy of macro economic and political events. There is no trade that I can see right now.A lot can happen over a week. The debt ceiling debate resolution has resolved a few important things.
1.) It has taken a great destabilizer off the table -- namely, the prospect of a US government default. This has removed a big downward pull in the market.
2.) #1 will increase the importance of economic news to the financial markets -- and that news has been disproportionately bad over the last month to month and a half. As such Treasuries now look like an attractive investment.
3.) We still have the EU situation to worry about, which means point #1 is that much more importance.
4.) There is little concern the Fed will lower rates anytime soon, which removes downward pressure.
5.) Inflation is low, which also lowers sell-side pressures.
In short, there is a tremendous amount of upward fundamental pressure right now in the Treasury market.
Neither market has any firm direction right now and is instead at the mercy of macro economic and political events. There is no trade that I can see right now.

The five minute chart shows a tight consolidation range between 97 and 97.7 that lasted for seven days. However, prices gapped higher on Friday, gapped lower at today's open but then rallied on the weak ISM reading.

The prices action for the last two days shows that prices have moved through key resistance and are approaching yearly highs.

The A/D and CMF indicate money is flowing into the market, while the MACD has given a buy signal.
The primary fundamental that concerns me with moving into this security is the yearly high, which could still provide upside resistance. But a move through that level would be a buy signal, as the fundamental situation has turned bond market bullish.


