Click for a larger image.
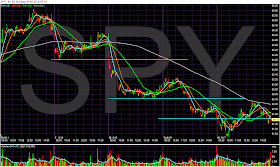
Notice how the market has been in a lower high/lower low pattern since last Thursday. However, today prices advanced through previous lows before running into resistance at the 200 minute SMA. Let's take a closer look at the last three days of action

After falling in the first hour and a half of trading prices moved higher until about 1:40 when they broke the upward sloping trend line. Volume then escalated as prices fell.
The IWMs are remarkably similar:

However, notice the QQQQs formed more of a trading pattern over the last few days.

So -- what does this mean? One of the averages isn't confirming.