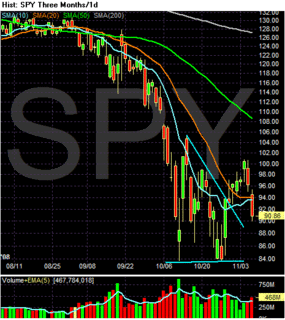
The triangle consolidation that occurred in October looked like a bottoming pattern. However, today's action leads to an alternate conclusion about where the market is going. The main issue with this chart now is prices moved through the 10 and 20 day SMA on high volume today. Also note the chart has printed two long candles in a row indicating strong movement.
The downward move in prices means the shorter SMAs will be moving lower as well. In addition, the 10 day SMA might not cross over the 20 day SMA.
Bottom line: this is still a bearish chart and the idea we would be rallying off of the triangle consolidation pattern is in jeopardy.