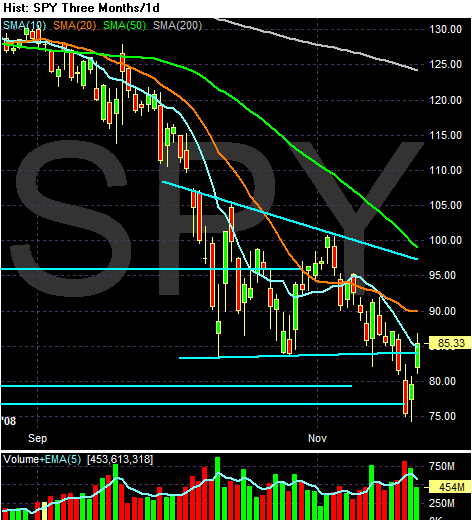
Notice the following on the daily chart:
ON THE BULLISH SIDE
-- Prices rebounded from lows established in 2002/2003. In other words, technical support held
-- Prices moved through 84 which was a a point of technical resistance
-- Prices moved through the 10 say SMA
BUT
-- All the SMAs are moving lower
-- The shorter SMAs are below the longer SMAs
Bottom line: this is a bearish chart
In response to the question of the day -- do I think we're consolidating right now, the answer is no. The four market sectors that account for the largest percentage of the market all have incredibly bearish charts right now. That concerns me greatly.