Saturday, December 8, 2007
Back Tomorrow
Tomorrow I'll run the weekly charts for last week. Until then, don't think about the markets or the economy. In fact, think about anything but those two things.
Friday, December 7, 2007
Weekend Weimer and Beagle.
It's that time of the week. The markets are closed. Think about anything but the markets
Here are two pictures of my Weimers looking out the window. I call this the Weimer window. Now you know why.


And here is a picture of the future Mr$. Bonddad's Beagle Scooby. This is after she has pinned me.

Here are two pictures of my Weimers looking out the window. I call this the Weimer window. Now you know why.


And here is a picture of the future Mr$. Bonddad's Beagle Scooby. This is after she has pinned me.

Retailers Have Tough Holiday Season Ahead
From Bloomberg:
As I've said many times, predicting the demise of the US consumer is a very difficult prediction. Americans love to shop and will do anything to keep shopping.
That being said, consider the following:
Fed President Yellen made the following observation in her latest speech related to equity withdrawals:
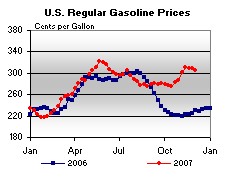
In addition, gas prices are much higher this year than last year:
Traders have noticed all of this, as evidenced by the retail ETF:
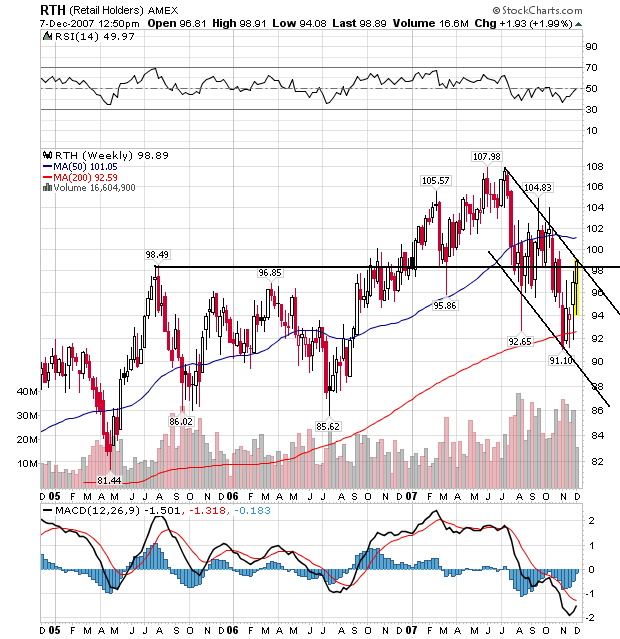
The retail ETF has been heading lower in a downward sloping channel since the beginning of January. The EFT is close to an important technical barrier. If it continues to move higher it could signal an end to the downtrend. The oversold reading on the MACD would indicate that is possible right now, and the RSI is at 50 implying the index could go either way.
Retail is an incredibly difficult sector to read -- at least for me. There are a ton of conflicting signals right now along with the overall propensity of the US consumer to shop.
U.S. retailers may struggle to boost sales this month as consumers grappling with lower home values and higher food and energy costs shun full-priced goods.
Target Corp., the second-largest U.S. discount chain, said yesterday that it needs sales to ``meaningfully improve'' in December to achieve fourth-quarter profit growth. J.C. Penney Co., the third-biggest department-store chain, expects sales at stores open at least 12 months to fall for the five weeks through Jan. 5.
Retailers may cut prices further during what the National Retail Federation in Washington forecasts will be the slowest holiday shopping season in five years. Consumers contending with defaults on mortgages and higher costs for milk and gasoline may wait until closer to Christmas to spend, hoping for discounts of 50 percent or more on sweaters and electronics.
``I don't think there's going to be anything that's going to take the focus away from price,'' said Christian Andreach, who helps manage more than $15 billion at Manning & Napier Advisors Inc. in Fairport, New York. ``Everyone's pretty much aware of the negatives.''
As I've said many times, predicting the demise of the US consumer is a very difficult prediction. Americans love to shop and will do anything to keep shopping.
That being said, consider the following:
U.S. homeowners’ real estate equity dropped a record $128.5 billion, or 1.2%, in the third quarter to $10.6 trillion as home prices fell and mortgage debt rose. That’s the second quarterly decline after surging 38% from 2002 through the end of last year. In the second quarter of this year, homeowners’ equity dropped by $31.4 billion from the peak, $10.7 trillion, reached in the first quarter.
Fed President Yellen made the following observation in her latest speech related to equity withdrawals:
At the same time, the fall in house prices may constrain consumer spending by changing the value of mortgage equity; less equity, for example, reduces the quantity of funds available for credit-constrained consumers to borrow through home equity loans or to withdraw through refinancing.
In addition, gas prices are much higher this year than last year:

Traders have noticed all of this, as evidenced by the retail ETF:

The retail ETF has been heading lower in a downward sloping channel since the beginning of January. The EFT is close to an important technical barrier. If it continues to move higher it could signal an end to the downtrend. The oversold reading on the MACD would indicate that is possible right now, and the RSI is at 50 implying the index could go either way.
Retail is an incredibly difficult sector to read -- at least for me. There are a ton of conflicting signals right now along with the overall propensity of the US consumer to shop.
Jobs Up 94,000
From the BLS:
let's look at little deeper into the report.
Construction dropped 24,000. That makes a whole lot more sense considering the housing market's overall situation. This number has been remarkably resilient despite the housing market slowdown. I think the primary reason is the shift to commercial real estate development, but I could be wrong.
Manufacturing dropped 11,000. While the US has lost a ton of manufacturing jobs, it has also gained a lot in productivity. And then there's the exports picture which is incredibly strong. Simply put, I think US manufacturing is doing more with less.
Retail added 24,000. Thank the Ghost of Christmas past.
Professional services added 30,000 -- a nice bump. Government added 30,000 and leisure and hospitality added 26,000.
This report isn't great, but it's not terrible either. All in all I'd call it fair.
Nonfarm payroll employment continued to trend up in November (94,000), and the unemployment rate held at 4.7 percent, the Bureau of Labor Statistics of the U.S. Department of Labor reported today. Job growth continued in professional and technical services, health care, and food services. Employment continued to decline in manufacturing and also fell in several housing-related industries, including construction, credit intermediation, and real estate. Average hourly earnings rose by 8 cents over the month.
let's look at little deeper into the report.
Construction dropped 24,000. That makes a whole lot more sense considering the housing market's overall situation. This number has been remarkably resilient despite the housing market slowdown. I think the primary reason is the shift to commercial real estate development, but I could be wrong.
Manufacturing dropped 11,000. While the US has lost a ton of manufacturing jobs, it has also gained a lot in productivity. And then there's the exports picture which is incredibly strong. Simply put, I think US manufacturing is doing more with less.
Retail added 24,000. Thank the Ghost of Christmas past.
Professional services added 30,000 -- a nice bump. Government added 30,000 and leisure and hospitality added 26,000.
This report isn't great, but it's not terrible either. All in all I'd call it fair.
Thursday, December 6, 2007
The Paulsen Plan -- Not Impressed
After reading a ton of news accounts, I am unimpressed. This plan has a ton of holes in it.
First:
Not binding. That means if a servicer wants out, there is nothing keeping them from going. However, if they leave there will probably be a lot of bad press. That may keep them in whether they want to or not. But a binding commitment would be far more solid.
Secondly
Remember, what we're trying to avoid here is a flood of foreclosed properties on the market that would swell the super-glut of available home inventory to painful levels that would literally crash prices. Projections are for 1.2 million foreclosures next year. If this plan only helps 240,000 not enough people will be helped to prevent that from happening.
The Wall Street Journal Offered a more Optimistic view of the number that would receive help:
It looks to me like the plan is saying "refinance people with a credit score below 660, and tell those above to tough it out." If that is true, than we still have 600,000 who may have problems when rates reset. My guess is that will still have a negative impact on the existing homes inventory. Remember -- there is already a 10.8 month supply of existing homes for sale at the national level. The absolute number is near a record. What we're trying to stop is a a further swelling of an already bloated inventory level. With 600,000 still having to deal with an adjustable rate mortgage, I'm just not sure we've dealt with that.
Third:
This is an incredibly astute point. The problems we're currently experiencing have occurred before resets occurred. In other words, this plan won't solve the current problem.
The real problems?
First there is the Fed. Alan "throw cheap money at any problem" Greenspan. The bottom line of interest rates is simple. When you lower interest rates to below 0% after adjusting for inflation, you're encouraging reckless borrowing. At those rates, money is literally growing on trees. I love the way classical economists feign complete ignorance of basic supply and demand when it makes them look bad. "Yo -- Alan! You lowered the cost of money to nothing. What in the hell do you think that will do to demand?" For Greenspan to sit back and claim he had no idea a bubble would happen is at best disingenuous.
Second -- the ratings agencies should be dealt with harshly. The key lynch pin in this whole situation is the ability to sell sub-prime backed paper to as many investors as possible. That means you need a good credit rating. While I'm sure all the agencies will swear on the Bible they did the best job they could, consider the number of downgrades we've seen lately. Frankly, to me it looks like a whole lot of CYA going on.
On that note -- as my screen name implies I use to be a bond broker. During my time in the market I dealt with mortgage-backed collateral and structures. The whole securitization process is -- in my opinion -- a great idea and process. But this whole mess is giving it an incredibly bad name -- and one it does not deserve. But it would not be getting a bad name if the ratings agencies had remembered one important point: when you're carving cash flows out of weak collateral, you have to always remember it's weak collateral and no amount of slicing and dicing will change that. If this paper had been properly rated from the beginning, then only higher risk investors would have been buying this paper. And that would have solved a whole lot of problems up front. Instead, everybody was buying this stuff -- and that's a prime reason we're having all of these problems.
And finally, there are the mortgage brokers. Here's the central problem with the advent of consumer friendly modern mortgage products:
That's the central issue. I have to wonder how many people who bought option ARMs or interest only loans actually understood what they were buying. And just because they don't get it doesn't mean they're stupid - it just means they don't understand a fairly arcane and obscure financial tool (like about 98% of the people out there). But when a mortgage broker -- who probably gets a higher commission for selling a higher interest rate product -- talks about those great teaser rates and then says, "you can refinance in five years" how many people are going to say no? Or better yet, how many people are going to admit their own ignorance about something and ask questions? The point is the lending industry has a great deal of responsibility here too. And I would bet there are some mortgage brokers who are having trouble sleeping at night for the crap they sold (and I hope they continue to have those problems). The point is the lending industry needs an overhaul in a big way; that will prevent this problem from happening again.
The real problems -- lax interest rate policy, corrupt ratings agencies and questionable lending practices -- are completely unanswered. And that's why the Paulsen Plan -- or the Paulsen Put -- won't solve this problem.
First:
The plan seeks to combat a rising tide of foreclosures by making it easier for lenders to freeze the "starter" interest rate for certain borrowers for five years. The initiative includes an agreement, brokered by Bush administration officials, between the loan servicers who would administer a rate freeze and the investors to whom the mortgage debt has been sold. The agreement sets conditions under which rates on certain loans could be temporarily frozen. It isn't binding, but because it has the support of major investors, it is expected to give loan servicers much more flexibility to quickly rework some loans and direct other borrowers toward refinancings.
Not binding. That means if a servicer wants out, there is nothing keeping them from going. However, if they leave there will probably be a lot of bad press. That may keep them in whether they want to or not. But a binding commitment would be far more solid.
Secondly
Among those sure to be disappointed are borrowers whose introductory rates expire before Jan. 1. About $57 billion in subprime loans were scheduled to be reset at higher rates in the final three months of this year, according to estimates by First American LoanPerformance.
Mortgage companies could also exclude borrowers who they conclude are making enough money to afford higher monthly payments. Barclays Capital — extrapolating from a similar program recently unveiled in California — estimates that only about 12 percent of all subprime borrowers, or 240,000 homeowners, would get relief.
Remember, what we're trying to avoid here is a flood of foreclosed properties on the market that would swell the super-glut of available home inventory to painful levels that would literally crash prices. Projections are for 1.2 million foreclosures next year. If this plan only helps 240,000 not enough people will be helped to prevent that from happening.
The Wall Street Journal Offered a more Optimistic view of the number that would receive help:
The 1.2 million borrowers relatively current in their mortgages will be considered for the government-endorsed program. They will pass through the next set of screening to determine whether they can refinance at more-favorable mortgage rates. Some 600,000 borrowers are expected to qualify. These borrowers are expected to be offered counseling and a fast track to secure refinanced mortgages.
The remaining 600,000 won't qualify to refinance their existing mortgage, the alliance estimates. Such borrowers' loan servicers or counselors would determine whether they can afford to pay the higher interest rates once their introductory rates expire. The servicers will assume that those with better credit scores and more equity can afford to pay when their existing loans adjust upward. They would receive no special assistance.
It looks to me like the plan is saying "refinance people with a credit score below 660, and tell those above to tough it out." If that is true, than we still have 600,000 who may have problems when rates reset. My guess is that will still have a negative impact on the existing homes inventory. Remember -- there is already a 10.8 month supply of existing homes for sale at the national level. The absolute number is near a record. What we're trying to stop is a a further swelling of an already bloated inventory level. With 600,000 still having to deal with an adjustable rate mortgage, I'm just not sure we've dealt with that.
Third:
The assumption is that resetting rates causes delinquency and default. I am not sure this is correct. Research suggests that falling house prices and loans to folks without the income to pay are the leading issues. Delinquency research published in the September 2007 IMF Global Financial Stability Report (pdf) suggests trouble starts before interest rates reset upward. The chart (Figure 1.6) below makes this clear. The below data suggest that as we move forward in time, more folks are defaulting faster and faster. These defaults are not predominantly the result of resets. We know this because a rising portion of people are missing payments before rates change.
This is an incredibly astute point. The problems we're currently experiencing have occurred before resets occurred. In other words, this plan won't solve the current problem.
The real problems?
• The FOMC, who took rates down to historic lows, and left them there for a year;
• Ratings agencies, (not unlike the equity scandal of the 1990s) were in cahoots with underwriters, to the detriment of investors;
• The Federal Reserve, in their capacity of over-seers of the Banking industry, failed to supervise the rampant issuance of irresponsible debt;
First there is the Fed. Alan "throw cheap money at any problem" Greenspan. The bottom line of interest rates is simple. When you lower interest rates to below 0% after adjusting for inflation, you're encouraging reckless borrowing. At those rates, money is literally growing on trees. I love the way classical economists feign complete ignorance of basic supply and demand when it makes them look bad. "Yo -- Alan! You lowered the cost of money to nothing. What in the hell do you think that will do to demand?" For Greenspan to sit back and claim he had no idea a bubble would happen is at best disingenuous.
Second -- the ratings agencies should be dealt with harshly. The key lynch pin in this whole situation is the ability to sell sub-prime backed paper to as many investors as possible. That means you need a good credit rating. While I'm sure all the agencies will swear on the Bible they did the best job they could, consider the number of downgrades we've seen lately. Frankly, to me it looks like a whole lot of CYA going on.
On that note -- as my screen name implies I use to be a bond broker. During my time in the market I dealt with mortgage-backed collateral and structures. The whole securitization process is -- in my opinion -- a great idea and process. But this whole mess is giving it an incredibly bad name -- and one it does not deserve. But it would not be getting a bad name if the ratings agencies had remembered one important point: when you're carving cash flows out of weak collateral, you have to always remember it's weak collateral and no amount of slicing and dicing will change that. If this paper had been properly rated from the beginning, then only higher risk investors would have been buying this paper. And that would have solved a whole lot of problems up front. Instead, everybody was buying this stuff -- and that's a prime reason we're having all of these problems.
And finally, there are the mortgage brokers. Here's the central problem with the advent of consumer friendly modern mortgage products:
Even some smart people overestimate the average borrower's sophistication in these matters—as evidenced by Alan Greenspan's 2004 speech in which he argued that more Americans would benefit from taking out adjustable-rate mortgages. It's a thesis that makes theoretical sense, but seems to assume the average homebuyer understands interest-rate risk as well as someone trading LIBOR (London Interbank Offered Rate) futures at Goldman Sachs.
That's the central issue. I have to wonder how many people who bought option ARMs or interest only loans actually understood what they were buying. And just because they don't get it doesn't mean they're stupid - it just means they don't understand a fairly arcane and obscure financial tool (like about 98% of the people out there). But when a mortgage broker -- who probably gets a higher commission for selling a higher interest rate product -- talks about those great teaser rates and then says, "you can refinance in five years" how many people are going to say no? Or better yet, how many people are going to admit their own ignorance about something and ask questions? The point is the lending industry has a great deal of responsibility here too. And I would bet there are some mortgage brokers who are having trouble sleeping at night for the crap they sold (and I hope they continue to have those problems). The point is the lending industry needs an overhaul in a big way; that will prevent this problem from happening again.
The real problems -- lax interest rate policy, corrupt ratings agencies and questionable lending practices -- are completely unanswered. And that's why the Paulsen Plan -- or the Paulsen Put -- won't solve this problem.
Today's Markets
They like it! They really like it! The markets were very happy with the Paulsen plan.
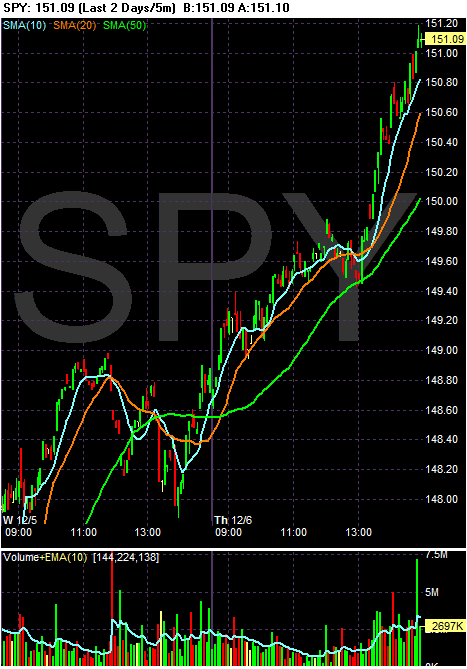
The SPYs rose until the lunch hour then really exploded upwards after the Paulsen announcement. Also note the volume spike at the end. This indicates enthusiasm continued into the end of trading. It also indicates traders are willing to hold positions overnight, which is a sign of confidence.
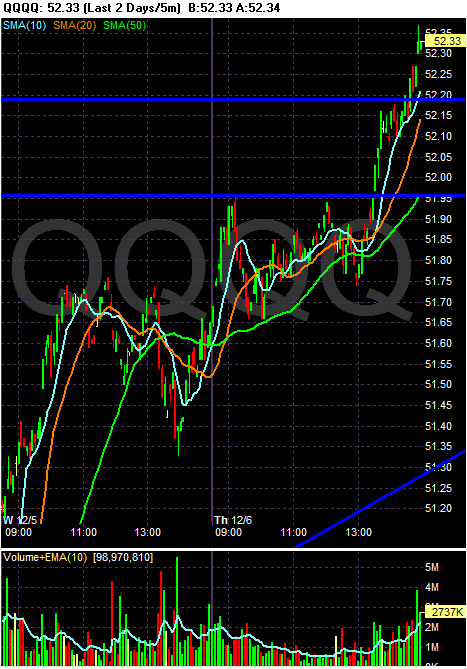
The QQQQs gapped up at the open, but meandered until the Paulsen announcement. But after the announcement they were also very pleased and rallied. Like the SPYs, we had a volume spike at the end which is encouraging.
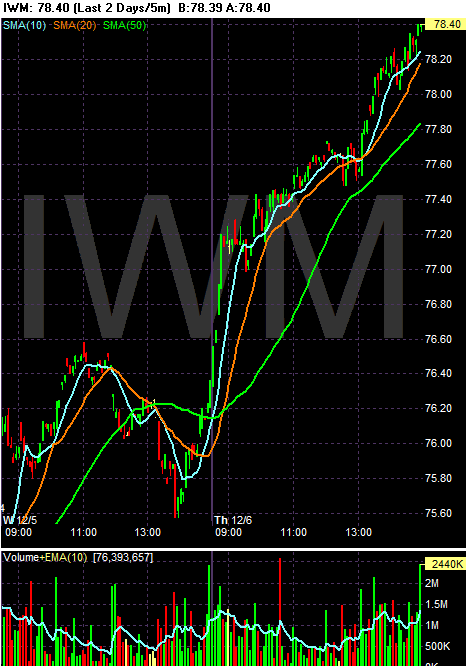
The Russell 2000 was more like the SPYs. The IWMs opened with strong upward volume, slowed a bit and then rallied into the close. They also had a strong end of the session volume spike.
Notice that all three averages closed on heavy volume. Traders are confident the job report tomorrow will be positive.
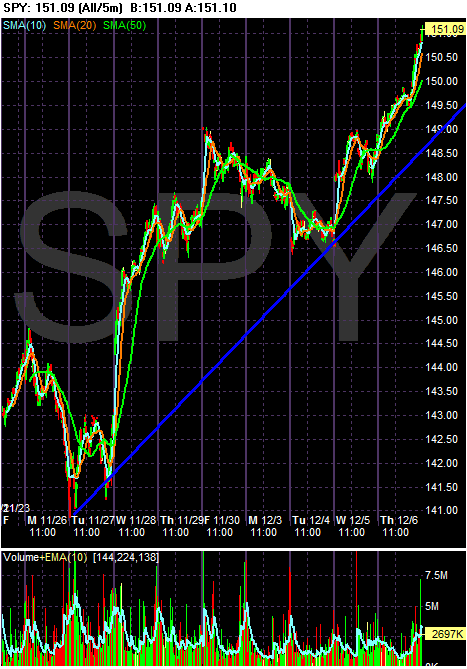
Notice on the 10-day SPY chart he have an uptrend in place. But I still want to caution -- this is a messy uptrend. All of the gaps over the last few days -- gaps in both directions -- are still on the chart. There is still a ton of volatility in this chart.
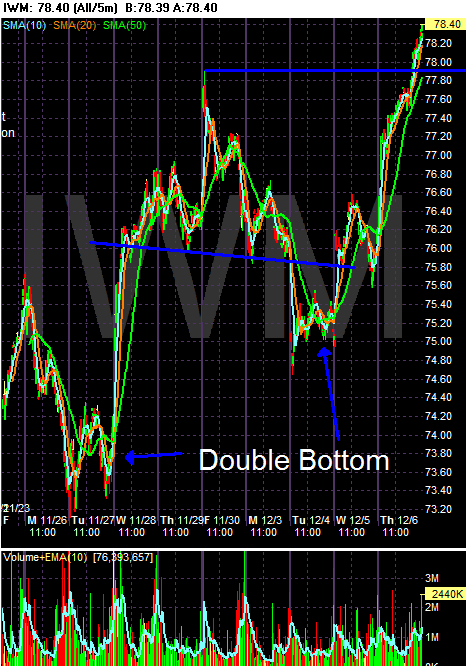
Over the last 10 days, the Russell 2000 formed a double bottom, rose to a head and shoulders reversal pattern, fell to another double bottom and then rallied through resistance on today's price action. But like the SPYs -- there is still a ton of volatility on this chart. This chart has changed directions three times in the last 10 days. That's a lot of traders changing their minds about the market.
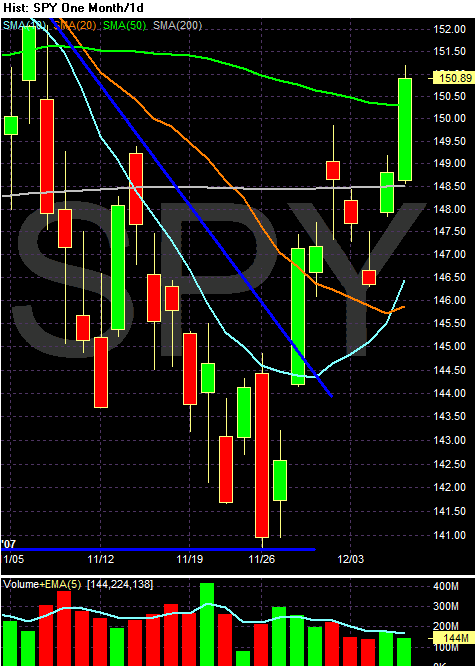
On the SPYs daily chart notice the index has
1.) Moved through downside resistance
2.) Moved through the 10 day SMA
3.) Moved through the 20 day SMA
4.) Moved through the 50 day SMA
5.) Moved through the 200 day SMA
6.) Printed two strong upward moving bars
7.) Gapped up three times
8.) Gapped down twine.
In other words, it's time to ask the question, "has the index reversed from its downward trajectory?" The technical information would indicate yes, the index has reversed. The moves through the moving averages and previous resistance levels indicates the markets are heading higher right now.
BUT -- AND IT'S A REALLY BIG BUT
This could all change on the employment report tomorrow. That is a huge wild card in the markets.
Also remember, we have seen a ton of gaps in both directions. It's a very precipitous rally that could change at a moments notice.
And finally, the economic backdrop is still very questionable. While everyone is anticipating a Fed rate cut, people seem to be forgetting the reason behind the rate cut. The Fed is not cutting rates because they want to give the markets a Christmas present. The Fed will cut rates because they are concerned about the housing market, a possible economic slowdown and credit markets that are grinding to a year-end halt. And those are fundamental reasons to sell the market, not buy it.
So, if the rally continues, it probably has a time limit that could come very quickly.

The SPYs rose until the lunch hour then really exploded upwards after the Paulsen announcement. Also note the volume spike at the end. This indicates enthusiasm continued into the end of trading. It also indicates traders are willing to hold positions overnight, which is a sign of confidence.

The QQQQs gapped up at the open, but meandered until the Paulsen announcement. But after the announcement they were also very pleased and rallied. Like the SPYs, we had a volume spike at the end which is encouraging.

The Russell 2000 was more like the SPYs. The IWMs opened with strong upward volume, slowed a bit and then rallied into the close. They also had a strong end of the session volume spike.
Notice that all three averages closed on heavy volume. Traders are confident the job report tomorrow will be positive.

Notice on the 10-day SPY chart he have an uptrend in place. But I still want to caution -- this is a messy uptrend. All of the gaps over the last few days -- gaps in both directions -- are still on the chart. There is still a ton of volatility in this chart.

Over the last 10 days, the Russell 2000 formed a double bottom, rose to a head and shoulders reversal pattern, fell to another double bottom and then rallied through resistance on today's price action. But like the SPYs -- there is still a ton of volatility on this chart. This chart has changed directions three times in the last 10 days. That's a lot of traders changing their minds about the market.

On the SPYs daily chart notice the index has
1.) Moved through downside resistance
2.) Moved through the 10 day SMA
3.) Moved through the 20 day SMA
4.) Moved through the 50 day SMA
5.) Moved through the 200 day SMA
6.) Printed two strong upward moving bars
7.) Gapped up three times
8.) Gapped down twine.
In other words, it's time to ask the question, "has the index reversed from its downward trajectory?" The technical information would indicate yes, the index has reversed. The moves through the moving averages and previous resistance levels indicates the markets are heading higher right now.
BUT -- AND IT'S A REALLY BIG BUT
This could all change on the employment report tomorrow. That is a huge wild card in the markets.
Also remember, we have seen a ton of gaps in both directions. It's a very precipitous rally that could change at a moments notice.
And finally, the economic backdrop is still very questionable. While everyone is anticipating a Fed rate cut, people seem to be forgetting the reason behind the rate cut. The Fed is not cutting rates because they want to give the markets a Christmas present. The Fed will cut rates because they are concerned about the housing market, a possible economic slowdown and credit markets that are grinding to a year-end halt. And those are fundamental reasons to sell the market, not buy it.
So, if the rally continues, it probably has a time limit that could come very quickly.
Media Appearance
I'll be on KTLK.com at 4PM CST to discuss the Paulsen plan.
I'll do a market wrap afterwards. I have a lot of reading to do until then.
I'll do a market wrap afterwards. I have a lot of reading to do until then.
Mortgage Delinquencies Hit 20 year High = the Paulsen Put
From Bloomberg:
Now you know why Paulsen acted despite his non-interventionist political philosophy. In other words, markets are great when they don't threaten a financial meltdown. When the economy might slip into a recession because of market forces, it's time to act.
Call it the Paulsen put.
The number of Americans who fell behind on their mortgage payments rose to a 20-year high in the third quarter as borrowers were unable to refinance or sell their homes.
The share of all home loans with payments more than 30 days late, including prime and fixed-rate loans, rose to a seasonally adjusted 5.59 percent, the highest since 1986, the Mortgage Bankers Association said in a report today. New foreclosures hit an all-time high for a second consecutive quarter.
The surge in foreclosures is expanding the inventory of unsold homes and contributing to the decline in housing demand. Sales of new and previously owned homes probably will drop to 5.09 million next year, 32 percent below the 2005 peak of 7.46 million, according to Frank Nothaft, chief economist of Freddie Mac, the second largest U.S. mortgage buyer. About 40 percent of lenders have increased standards for their most creditworthy borrowers, according to a Federal Reserve study in October.
``These are the first numbers we've seen that combine the meltdown of the credit markets with the drop in home prices,'' said Jay Brinkmann, vice president of research and economics for the Washington-based bankers trade group.
Now you know why Paulsen acted despite his non-interventionist political philosophy. In other words, markets are great when they don't threaten a financial meltdown. When the economy might slip into a recession because of market forces, it's time to act.
Call it the Paulsen put.
Read This Now
Read this story now. Barry explains the problems with the birth/death model better than I ever could.
US Economic Problems in a Nutshell
From the WSJ:
That about sums it up. Here are some corresponding charts:
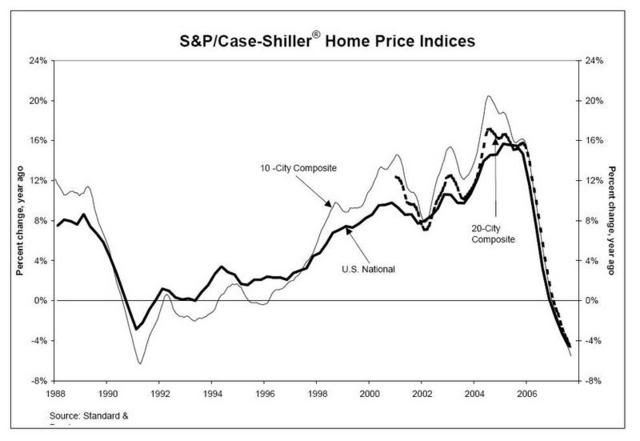
Home Prices:
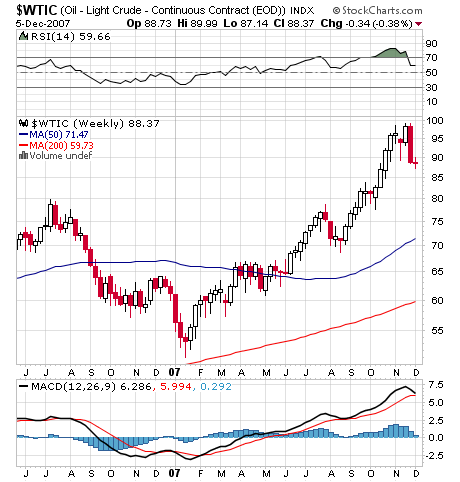
Higher energy prices:
Prices at the pump:

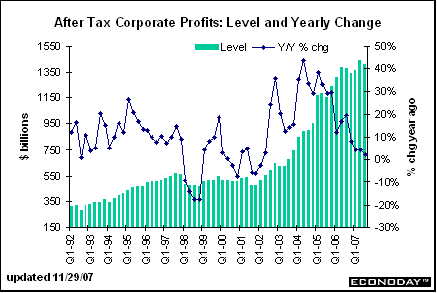
Corporate Profits:
Retail sales:
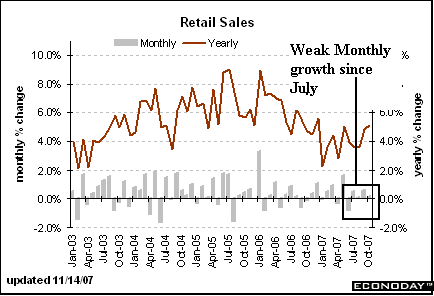
What's with all the gloom about the U.S. economy? The problem is that we have two problems. One is that the economy is slouching toward recession or, at best, slow growth. It's the consequence of falling house prices, higher energy prices, flagging consumers and shrinking profits.
That about sums it up. Here are some corresponding charts:
Home Prices:

Higher energy prices:

Prices at the pump:

Corporate Profits:

Retail sales:

Is Big Pharma In Trouble?
From the WSJ:
This story brings back some really old memories for me. When I was a little kid -- as in maybe 7-8 years old -- I remember my Dad talking about investments he had made in Merck and Bristol Meyers. He used the dividend reinvestment plan. He thought these companies would be the next wave of super-big US companies in the mold of GE.
At the time he was right. In the mid-1970s big pharma was just getting ready to take off.
Which brings us to today. One of the themes I'm seeing in the market is a flight to safety. Stocks like P&G and Johnson and Johnson are seeing renewed buying interest as investors perceive them to be safer investments in a turbulent market.
However, big pharma really hasn't benefited from this run in a major way. But let's back up. First, here is a long-term chart of PPH -- the Pharmaceutical ETF.
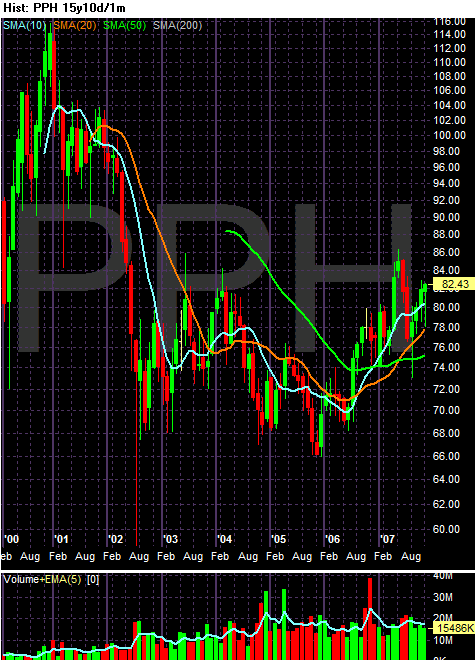
This sector has languished for most of this entire, 5-year rally.
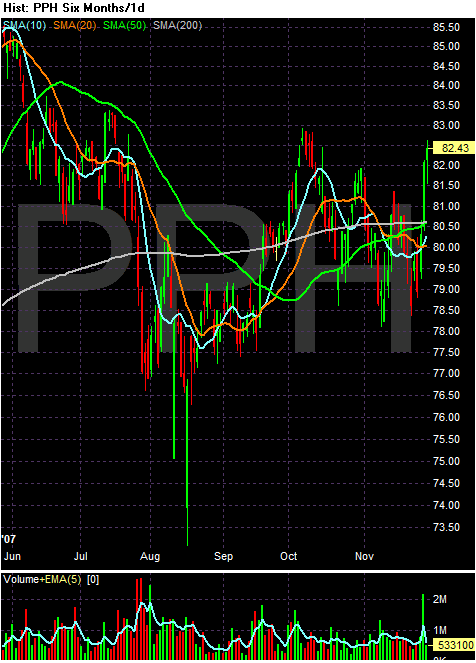
And while we've seen a nice pop over the last few days, this sector clearly is not benefiting from the flight to safety.
I can't speak to the validity of the WSJ's analysis of the business model in place. I can speak to the market situation. While big pharma clearly still has some value in the market as evidenced by their lack of serious sell-off, they also don't have the upside potential you would naturally think of in a turbulent market and slowing economy.
Over the next few years, the pharmaceutical business will hit a wall.
Some of the top-selling drugs in industry history will become history as patent protections expire, allowing generics to rush in at much-lower prices. Generic competition is expected to wipe $67 billion from top companies' annual U.S. sales between 2007 and 2012 as more than three dozen drugs lose patent protection. That is roughly half of the companies' combined 2007 U.S. sales.
At the same time, the industry's science engine has stalled. The century-old approach of finding chemicals to treat diseases is producing fewer and fewer drugs. Especially lacking are new blockbusters to replace old ones like Lipitor, Plavix and Zyprexa.
This story brings back some really old memories for me. When I was a little kid -- as in maybe 7-8 years old -- I remember my Dad talking about investments he had made in Merck and Bristol Meyers. He used the dividend reinvestment plan. He thought these companies would be the next wave of super-big US companies in the mold of GE.
At the time he was right. In the mid-1970s big pharma was just getting ready to take off.
Which brings us to today. One of the themes I'm seeing in the market is a flight to safety. Stocks like P&G and Johnson and Johnson are seeing renewed buying interest as investors perceive them to be safer investments in a turbulent market.
However, big pharma really hasn't benefited from this run in a major way. But let's back up. First, here is a long-term chart of PPH -- the Pharmaceutical ETF.

This sector has languished for most of this entire, 5-year rally.

And while we've seen a nice pop over the last few days, this sector clearly is not benefiting from the flight to safety.
I can't speak to the validity of the WSJ's analysis of the business model in place. I can speak to the market situation. While big pharma clearly still has some value in the market as evidenced by their lack of serious sell-off, they also don't have the upside potential you would naturally think of in a turbulent market and slowing economy.
Wednesday, December 5, 2007
Like Lemmings Off a Cliff....
From Marketwatch:
I am amazed that anybody believes any statement issued by anyone in the financial sector right now. How many times have we seen this type of statement over the last 6 months, only to have the company make "revisions" within the next few months? And yet, the market still believes these guys.
Here's the basic problem. Simply eyeballing all of the estimates about the total cost of the subprime problem, it seems like about $300 billion in total losses is more or less the median figure of total losses. But we've seen at most $80 billion in total announcements. That means we still have a ton of unaccounted for losses out there somewhere on the balance sheets of various financial institutions.
And yet, the street still listens to these guys and bids up their shares whenever a CEO says, "Every thing's fine." It just strains credulity at this point.
American International Group Inc. shares gained more than 5% in early trading Wednesday after its chief executive indicated that the insurance giant's exposure to the ongoing meltdown in mortgage markets wasn't likely to spiral.
The firm's CEO Martin Sullivan said U.S. residential housing exposures at American International Group, Inc was "manageable" given the company's size and business diversification. The CEO said the five-year adjusted earnings-per-share growth target is between 10% and 12%, while return on equity is targeted at a range of 15% to 16% for the same period. Shares of AIG gained more than 4% Wednesday morning as the company held an investor meeting
I am amazed that anybody believes any statement issued by anyone in the financial sector right now. How many times have we seen this type of statement over the last 6 months, only to have the company make "revisions" within the next few months? And yet, the market still believes these guys.
Here's the basic problem. Simply eyeballing all of the estimates about the total cost of the subprime problem, it seems like about $300 billion in total losses is more or less the median figure of total losses. But we've seen at most $80 billion in total announcements. That means we still have a ton of unaccounted for losses out there somewhere on the balance sheets of various financial institutions.
And yet, the street still listens to these guys and bids up their shares whenever a CEO says, "Every thing's fine." It just strains credulity at this point.
Today's Markets
Wow -- the incredibly wild ride continues.
SPY: +1.7
QQQQ: +1.78
IWM: +1.85
The markets gapped higher at the open. Then they bounced around until they all finally closed on a strong upward surge on heavy volume in the final five minutes of trading. But below, notice all of the gaps on the charts -- again. The volatility is really high right now. Prices are really jumping around.
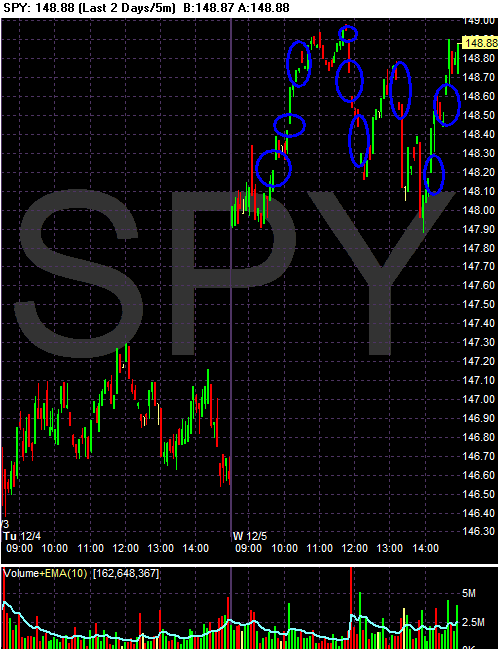
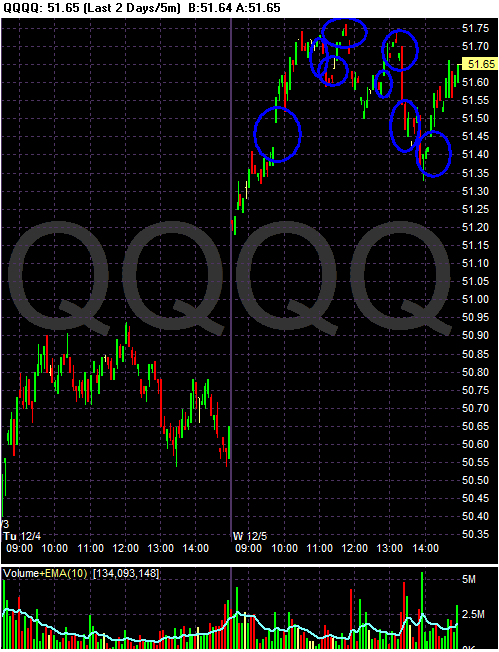
Below are the 10 day charts for the SPYs, QQQQs and IWMs respectively. Notice how all of the charts are jumping around; there is no clean direction either up or down. Instead, we're seeing a ton of really wild moves in both directions.
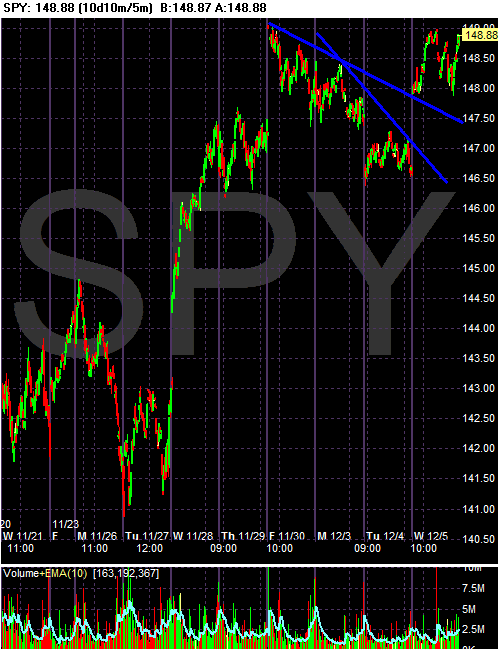
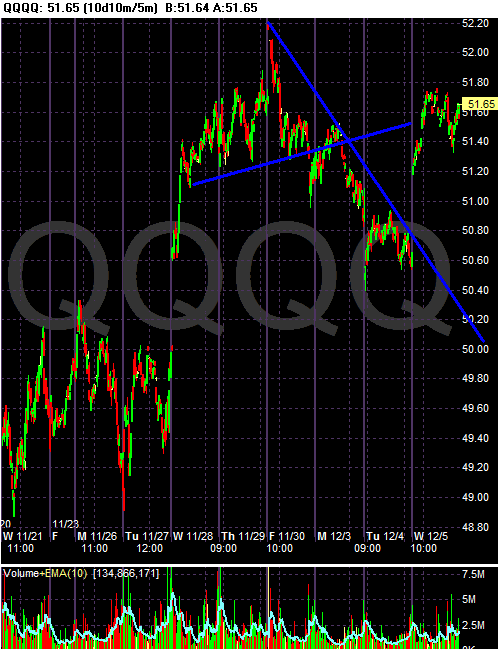
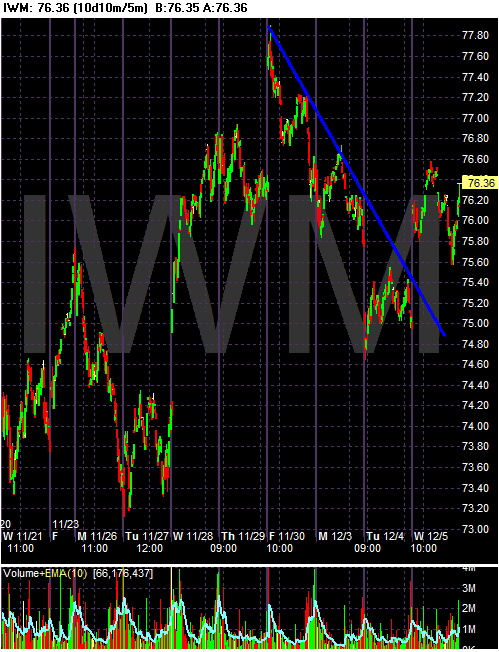
There is nothing clean about this market; there is no trend in any direction. Instead, it's like an anxious schizophrenic throwing paint at a canvas.
In fact, the market action is making me feel sick -- I mean really sick

SPY: +1.7
QQQQ: +1.78
IWM: +1.85
The markets gapped higher at the open. Then they bounced around until they all finally closed on a strong upward surge on heavy volume in the final five minutes of trading. But below, notice all of the gaps on the charts -- again. The volatility is really high right now. Prices are really jumping around.


Below are the 10 day charts for the SPYs, QQQQs and IWMs respectively. Notice how all of the charts are jumping around; there is no clean direction either up or down. Instead, we're seeing a ton of really wild moves in both directions.


There is nothing clean about this market; there is no trend in any direction. Instead, it's like an anxious schizophrenic throwing paint at a canvas.
In fact, the market action is making me feel sick -- I mean really sick

Can the Treasury Market Rally Continue?
Here is a chart of the 7-10 year Treasury ETF.
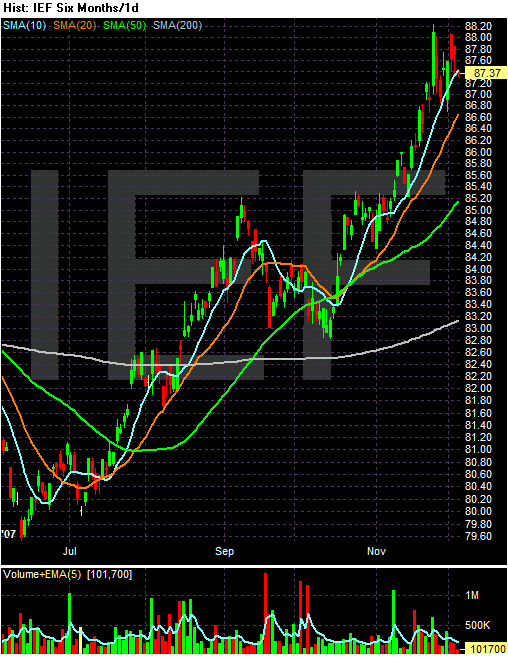
The Treasury market has been in a strong rally since early July. The primary reason for this rally is concern in the credit markets. Because Treasuries are considered the safest investments around, investors will flock to them when they are concerned about something in the economy. The credit crunch has obviously spooked investors, sending them flocking to Treasuries for the last 5 months.
But how long can this rally continue? Unlike stocks which theoretically have unlimited upside potential, bonds are constrained by their interest rates. Here is 40 year chart of the interest rate on the 10-year constantly maturing treasury.
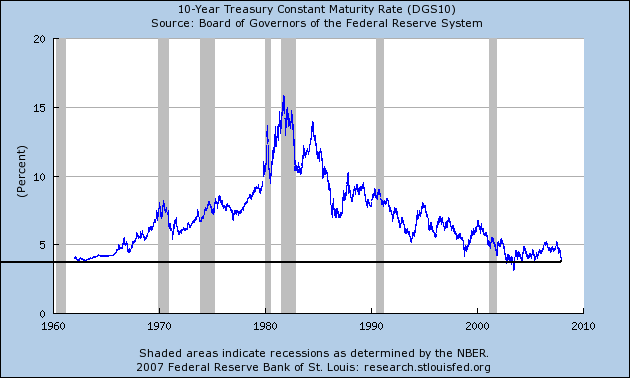
The chart is pretty clear. We're at historically low interest rates on the 10-year Treasury.
Here is a 5-year chart to better see recent movements.
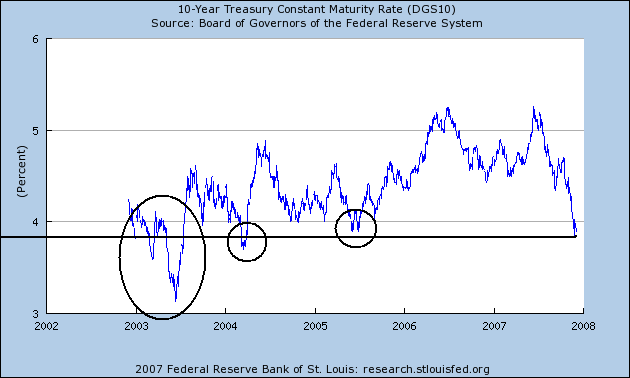
I've circled the areas where the prevailing interest rate was at or below current levels. Notice we had an extended rally in early 2003 that drove rates to levels below the present level. We also had a brief rally in early 2004 that pushed levels to current levels. But referring to the above 40-year chart those are the only times in the last 40 years rates have been this low.
In the financial markets, anything is possible. And considering the current concern about the credit markets, it's possible we could see rates go lower. Just remember that hasn't happened that often. In fact, it's only happened twice in the last 40 years. So for the rally to continue, traders must be really concerned about the credit markets.

The Treasury market has been in a strong rally since early July. The primary reason for this rally is concern in the credit markets. Because Treasuries are considered the safest investments around, investors will flock to them when they are concerned about something in the economy. The credit crunch has obviously spooked investors, sending them flocking to Treasuries for the last 5 months.
But how long can this rally continue? Unlike stocks which theoretically have unlimited upside potential, bonds are constrained by their interest rates. Here is 40 year chart of the interest rate on the 10-year constantly maturing treasury.

The chart is pretty clear. We're at historically low interest rates on the 10-year Treasury.
Here is a 5-year chart to better see recent movements.

I've circled the areas where the prevailing interest rate was at or below current levels. Notice we had an extended rally in early 2003 that drove rates to levels below the present level. We also had a brief rally in early 2004 that pushed levels to current levels. But referring to the above 40-year chart those are the only times in the last 40 years rates have been this low.
In the financial markets, anything is possible. And considering the current concern about the credit markets, it's possible we could see rates go lower. Just remember that hasn't happened that often. In fact, it's only happened twice in the last 40 years. So for the rally to continue, traders must be really concerned about the credit markets.
Tuesday, December 4, 2007
Translating "Fedspeak"
I want to go on record as saying I am not a big fan of attempting to divine the Fed's thoughts or policy intentions. Frankly, I think it is pretty much a losing game. In addition, I bought Bernanke's original statements that he wouldn't bail out the financial markets and was pretty much burned in the process. That being said ......
The Federal Reserve has its own language. As a tax lawyer, I am well aware of bizarre language (ever try and work with the tax code?) The Fed is the same way. They have their own way of talking.
There have been a few recent fed speeches that seem to indicate the Fed is deeply concerned about the markets and will most likely lower interest rates at their next meeting.
Let's start with San Francisco Federal Reserve President Janet Yellen:
While correlation does not usually mean causation -- that is, just because things happen at the same time does not mean one causes the other -- her statement that, "The timing of the slowdown certainly matches well with the financial turmoil explanation." makes a great deal of sense. Credit is the life blood of the economy; when its harder to get, everybody suffers.
In addition, recent numbers have not been good. Personal consumption expenditures were weak, as were durable goods. Oil is a drag. Retail sales are fair but not great. In short, the numbers could be a lot better.
Here Yellen gives a great overview of the basic problems of the housing market. Excess supply = lower prices. Rising foreclosures = more supply for an already bloated market = lower prices.
In addition, with the credit market turmoil listed above, it's harder for people to get loans to buy houses. That means demand is drying up.
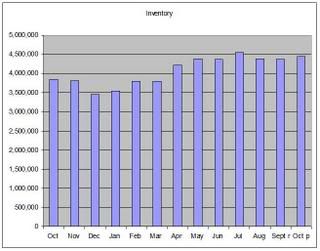
In shorter version, here is a chart of the total existing homes available for sale:
And here is a chart of months of inventory available for sale at the current sales pace:
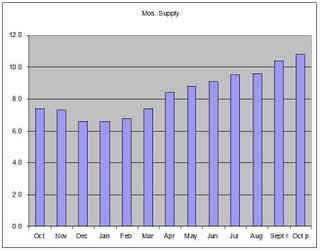
I couldn't have said it better myself. Bottom line: it's getting worse.
First, note that Yellen admits the importance of mortgage equity withdrawal (MEW) for the current economy. In addition, she also admits the impact of declining wealth on personal consumption behavior which is negative. In short, the housing mess stands a chance of really hitting about 70% of the economy and that's a cause for serious concern.
Here is a chart of personal consumption expenditures from the latest GDP report.
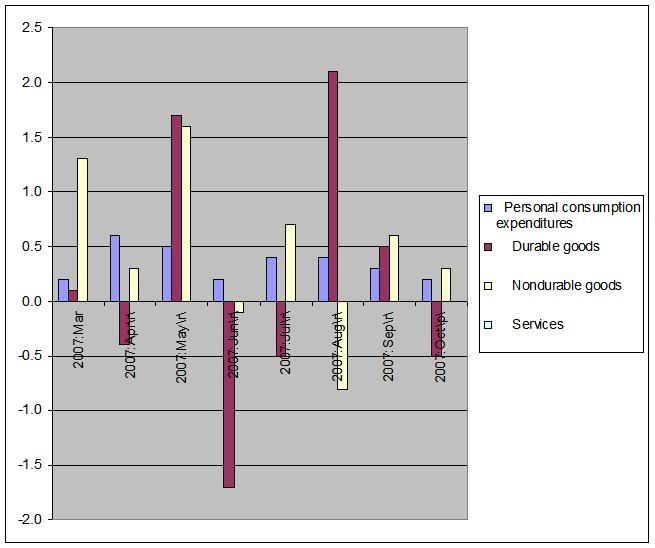
Overall, PCEs were the same from July to August. But they have declined since then. The durable goods number is also cause for concern, as it has jumped around quite a bit.
Short version: Consumer spending is slowing and business leaders are worried. And well they should be.
Next up was Donald Kohn:
I love this paragraph. While paying lip-service to the idea of moral hazard, Kohn basically says, "the needs of the many out weight the needs of the few" (yes, I was a Trekkie). In other words, ignore what he said in the first paragraph and let the interest rate cuts begin.
This is a really long-winded paragraph, isn't it?
Here's the short version:
1.) Everybody thought house prices would go up forever.
2.) Because everyone thought house prices would go up forever, lenders got really lax in their lending standards. If you had a pulse, you could get a loan (actually, both of my dogs were recently solicited for a mortgage)
3.) Oooops! Number 1 didn't happen.
4.) That means number 2 was a really bad and stupid idea.
5.) Because of number 2, lenders are not really thrilled about making new loans right now.
6.) In fact, lenders are buttoning down their hatches right now.
7.) In fact, if you want to get a loan, lenders will actually look at things like your credit score and payment history, rather than if you have a pulse.
8.) In fact, even if you have a decent credit score, it's stil going to be harder to get a loan largely because the two largest mortgage purchasers (Fannie Maw and Freddie Mac) are bleeding pretty badly right now.
Boy, he's a long-winded guy, isn't he?
OK -- here's the short version.
1.) Financial institutions are hording cash right now. Why? Because a lot of them are taking big hits to their capital.
2.) Financial institutions aren't thrilled about lending money to other financial institutions right now. Why? All of those write downs we've been hearing about indicate that a borrower might not be around in 90 days when a short-term loan comes due. This is called "counterparty risk above."
3.) Financial institutions are really concerned about their own capital positions right now. Why? Because chances are they bought some of the sub-prime crap out there and they'll have to write down their assets in the near future. Therefore, they're hoarding cash. This is where the phrase. "the ultimate size and location of credit losses on subprime mortgages and other lending are yet to be determined" comes into play.
4.) The Fed really can't do much about this. Why? It doesn't matter how much cash you have if you don't want to lend it to somebody. But the Fed will try anyway by flooding the market with as many dollars as possible. Hey -- at least it's something, right?
And finally, we have Bernanke's speech:
OK -- here's the translation:
1.) People aren't spending as much because food and gas prices are rising.
2.) The financial markets aren't doing that well and people are noticing. That is adding downward pressure to the markets.
What's really important here is all of the Fed governors have noticed the credit market is in terrible shape. That's the common theme through all of these speeches. And the problems in the credit market were caused by housing -- which isn't going to get better anytime soon. And finally, these problems are starting to negatively impact consumer sentiment and spending.
In short, the Fed is actually paying attention to the economy. The problem is will a rate cut be enough? I've said this over and over again, but the central problem isn't liquidity: it's confidence. When no one has any confidence that a borrower will be around in 90 days, it's difficult to lend money even in the short term. And cutting rates won't do squat about that.
The Federal Reserve has its own language. As a tax lawyer, I am well aware of bizarre language (ever try and work with the tax code?) The Fed is the same way. They have their own way of talking.
There have been a few recent fed speeches that seem to indicate the Fed is deeply concerned about the markets and will most likely lower interest rates at their next meeting.
Let's start with San Francisco Federal Reserve President Janet Yellen:
With these developments in mind, let me review the economic situation. By the time of the October meeting, the data indicated that the economy had turned in a very strong performance in the second and third quarters. However, the fourth quarter is sizing up to show only very meager growth. The current weakness probably reflects some payback for the strength earlier this year—in other words, just some quarter-to-quarter volatility due to business inventories and exports. But it may also reflect some impact of the financial turmoil on economic activity. If so, a more prolonged period of sluggishness in demand seems more likely. The timing of the slowdown certainly matches well with the financial turmoil explanation. Of course, much of the data that drove the third quarter strength cover the earlier part of that quarter, just the very beginnings of the turmoil in July and August, and therefore probably do not reflect its effects very much. However, the data for the end of the quarter—that is, for September—did come in on the soft side, and the data for the beginning of the fourth quarter in October have shown even more of a slowdown.
While correlation does not usually mean causation -- that is, just because things happen at the same time does not mean one causes the other -- her statement that, "The timing of the slowdown certainly matches well with the financial turmoil explanation." makes a great deal of sense. Credit is the life blood of the economy; when its harder to get, everybody suffers.
In addition, recent numbers have not been good. Personal consumption expenditures were weak, as were durable goods. Oil is a drag. Retail sales are fair but not great. In short, the numbers could be a lot better.
I’d like to go into this “story” in more detail. First, the on-going strains in mortgage finance markets seem to have intensified an already steep downturn in housing. Indeed, forward-looking indicators of conditions in housing markets are pointing lower. Housing permits and sales are dropping, and inventories of unsold homes are at very high levels. Moreover, rising foreclosures will likely add to the supply of houses on the market. It’s well known that foreclosures on subprime adjustable rate mortgages have increased sharply over the past couple of years. More recently, we’ve begun to see increases in foreclosures on subprime fixed-rate mortgages and even on prime ARMs. The bottom line is that housing construction will likely be quite weak well into next year before beginning to turn around.
Turning to house prices, many measures at the national level have fallen moderately, and the declines appear to be intensifying. Indeed, the ratio of house prices to rents, which is a kind of price-dividend ratio for housing, remains quite high by historical standards, suggesting that further price declines may be needed to bring housing markets into balance. This perspective is reinforced by futures markets for house prices, which indicate further—and even larger—declines in a number of metropolitan areas this year.
Here Yellen gives a great overview of the basic problems of the housing market. Excess supply = lower prices. Rising foreclosures = more supply for an already bloated market = lower prices.
In addition, with the credit market turmoil listed above, it's harder for people to get loans to buy houses. That means demand is drying up.
In shorter version, here is a chart of the total existing homes available for sale:

And here is a chart of months of inventory available for sale at the current sales pace:

This weakness in house construction and prices is one of the factors that has led me to include a “rough patch” in my forecast for some time. More recently, however, the prospects for housing have actually worsened somewhat, as financial strains have intensified and housing demand appears to have fallen further.
I couldn't have said it better myself. Bottom line: it's getting worse.
Moreover, we face a risk that the problems in the housing market could spill over to personal consumption expenditures in a bigger way than has thus far been evident in the data. This is a significant risk since personal consumption accounts for about 70 percent of real GDP. These spillovers could occur through several channels. For example, with house prices falling, homeowners’ total wealth declines, and that could lead to a pullback in spending. At the same time, the fall in house prices may constrain consumer spending by changing the value of mortgage equity; less equity, for example, reduces the quantity of funds available for credit-constrained consumers to borrow through home equity loans or to withdraw through refinancing. Furthermore, in the new environment of higher rates and tighter terms on mortgages, we may see other negative impacts on consumer spending. The reduced availability of high loan-to-value ratio and piggyback loans may drive some would-be homeowners to pull back on consumption in order to save for a sizable down payment. In addition, credit-constrained consumers with adjustable-rate mortgages seem likely to curtail spending, as interest rates reset at higher levels and they find themselves with less disposable income.
Consumption spending was moderately above trend in the third quarter, and though I had built in some slowing for it in my October forecast, there are signs suggesting even more moderation over the next year or so. For example, although consumers will continue to receive support from gains in employment and personal income, they will also confront constraints because of the declines in the stock market and house prices, the tightening of lending terms at depository institutions, and higher energy prices.
First, note that Yellen admits the importance of mortgage equity withdrawal (MEW) for the current economy. In addition, she also admits the impact of declining wealth on personal consumption behavior which is negative. In short, the housing mess stands a chance of really hitting about 70% of the economy and that's a cause for serious concern.
Here is a chart of personal consumption expenditures from the latest GDP report.

Overall, PCEs were the same from July to August. But they have declined since then. The durable goods number is also cause for concern, as it has jumped around quite a bit.
Moreover, there are significant downside risks to this projection. Recent data on personal consumption expenditures and retail sales are not that encouraging. They have begun to show a significant deceleration—more than was expected—and consumer confidence has plummeted. Reinforcing these concerns, I have begun to hear a pattern of negative comments and stories from my business contacts, including members of our Head Office and Branch Boards of Directors. It is far too early to tell if we are in for a sustained period of sluggish growth in consumption spending, but recent developments do raise this possibility as a serious risk to the forecast.
Short version: Consumer spending is slowing and business leaders are worried. And well they should be.
Next up was Donald Kohn:
Central banks seek to promote financial stability while avoiding the creation of moral hazard. People should bear the consequences of their decisions about lending, borrowing, and managing their portfolios, both when those decisions turn out to be wise and when they turn out to be ill advised. At the same time, however, in my view, when the decisions do go poorly, innocent bystanders should not have to bear the cost.
In general, I think those dual objectives--promoting financial stability and avoiding the creation of moral hazard--are best reconciled by central banks' focusing on the macroeconomic objectives of price stability and maximum employment. Asset prices will eventually find levels consistent with the economy producing at its potential, consumer prices remaining stable, and interest rates reflecting productivity and thrift. Such a strategy would not forestall the correction of asset prices that are out of line with fundamentals or prevent investors from sustaining significant losses. Losses were evident early in this decade in the case of many high-tech stocks, and they are in store for houses purchased at unsustainable prices and for mortgages made on the assumption that house prices would rise indefinitely.
To be sure, lowering interest rates to keep the economy on an even keel when adverse financial market developments occur will reduce the penalty incurred by some people who exercised poor judgment. But these people are still bearing the costs of their decisions and we should not hold the economy hostage to teach a small segment of the population a lesson.
I love this paragraph. While paying lip-service to the idea of moral hazard, Kohn basically says, "the needs of the many out weight the needs of the few" (yes, I was a Trekkie). In other words, ignore what he said in the first paragraph and let the interest rate cuts begin.
Related developments in housing and mortgage markets are a root cause of the financial market turbulence. Expectations of ever-rising house prices along with increasingly lax lending standards, especially on subprime mortgages, created an unsustainable dynamic, which is now reversing. In that reversal, loss and fear of loss on mortgage credit have impaired the availability of new mortgage loans, which in turn has reduced the demand for housing and put downward pressures on house prices, which have further damped desires to lend. We are following this trajectory closely, but key questions for central banks, including the Federal Reserve, are, What is happening to credit for other uses, and how much restraint are financial market developments likely to exert on demands outside the housing sector?
Some broader repricing of risk is not surprising or unwelcome in the wake of unusually thin rewards for risk taking in several types of credit over recent years. And such a repricing in the form of wider spreads and tighter credit standards at banks and other lenders would make some types of credit more expensive and discourage some spending, developments that would require offsetting policy actions, other things being equal. Some restraint on demand from this process was a factor I took into account when I considered the economic outlook and the appropriate policy responses over the past few months.
An important issue now is whether concerns about losses on mortgages and some other instruments are inducing much greater restraint and thus constricting the flow of credit to a broad range of borrowers by more than seemed in train a month or two ago. In general, nonfinancial businesses have been in very good financial condition; outside of variable-rate mortgages, households are meeting their obligations with, to date, only a little increase in delinquency rates, which generally remain at low levels. Consequently, we might expect a moderate adjustment in the availability of credit to these key spending sectors. However, the increased turbulence of recent weeks partly reversed some of the improvement in market functioning over the late part of September and in October. Should the elevated turbulence persist, it would increase the possibility of further tightening in financial conditions for households and businesses. Heightened concerns about larger losses at financial institutions now reflected in various markets have depressed equity prices and could induce more intermediaries to adopt a more defensive posture in granting credit, not only for house purchases, but for other uses a well.
This is a really long-winded paragraph, isn't it?
Here's the short version:
1.) Everybody thought house prices would go up forever.
2.) Because everyone thought house prices would go up forever, lenders got really lax in their lending standards. If you had a pulse, you could get a loan (actually, both of my dogs were recently solicited for a mortgage)
3.) Oooops! Number 1 didn't happen.
4.) That means number 2 was a really bad and stupid idea.
5.) Because of number 2, lenders are not really thrilled about making new loans right now.
6.) In fact, lenders are buttoning down their hatches right now.
7.) In fact, if you want to get a loan, lenders will actually look at things like your credit score and payment history, rather than if you have a pulse.
8.) In fact, even if you have a decent credit score, it's stil going to be harder to get a loan largely because the two largest mortgage purchasers (Fannie Maw and Freddie Mac) are bleeding pretty badly right now.
Central banks have been confronting several issues in the provision of liquidity and bank funding. When the turbulence deepened in early August, demands for liquidity and reserves pushed overnight rates in interbank markets above monetary policy targets. The aggressive provision of reserves by a number of central banks met those demands, and rates returned to targeted levels. In the United States, strong bids by foreign banks in the dollar-funding markets early in the day have complicated our management of this rate. And demands for reserves have been more variable and less flexible in an environment of heightened uncertainty, thereby adding to volatility. In addition, the Federal Reserve is limited in its ability to restrict the actual federal funds rate within a narrow band because we cannot, by law, pay interest on reserves for another four years.
At the same time, the term interbank funding markets have remained unsettled. This is evident in the much wider spread between term funding rates--like libor--and the expected path of the federal funds rate. This is not solely a dollar-funding phenomenon--it is being experienced in euro and sterling markets to different degrees. Many loans are priced off of these term funding rates, and the wider spreads are one development we have factored into our easing actions. Moreover, the behavior of these rates is symptomatic of caution among key marketmakers about taking and funding positions, and this is probably impeding the reestablishment of broader market trading liquidity. Conditions in term markets have deteriorated some in recent weeks. The deterioration partly reflects portfolio adjustments for the publication of year-end balance sheets. Our announcement on Monday of term open market operations was designed to alleviate some of the concerns about year-end pressures.
The underlying causes of the persistence of relatively wide-term funding spreads are not yet clear. Several factors probably have been contributing. One may be potential counterparty risk while the ultimate size and location of credit losses on subprime mortgages and other lending are yet to be determined. Another probably is balance sheet risk or capital risk--that is, caution about retaining greater control over the size of balance sheets and capital ratios given uncertainty about the ultimate demands for bank credit to meet liquidity backstop and other obligations. Favoring overnight or very short-term loans to other depositories and limiting term loans give banks the flexibility to reduce one type of asset if others grow or to reduce the entire size of the balance sheet to maintain capital leverage ratios if losses unexpectedly subtract from capital. Finally, banks may be worried about access to liquidity in turbulent markets. Such a concern would lead to increased demands and reduced supplies of term funding, which would put upward pressure on rates.
Boy, he's a long-winded guy, isn't he?
OK -- here's the short version.
1.) Financial institutions are hording cash right now. Why? Because a lot of them are taking big hits to their capital.
2.) Financial institutions aren't thrilled about lending money to other financial institutions right now. Why? All of those write downs we've been hearing about indicate that a borrower might not be around in 90 days when a short-term loan comes due. This is called "counterparty risk above."
3.) Financial institutions are really concerned about their own capital positions right now. Why? Because chances are they bought some of the sub-prime crap out there and they'll have to write down their assets in the near future. Therefore, they're hoarding cash. This is where the phrase. "the ultimate size and location of credit losses on subprime mortgages and other lending are yet to be determined" comes into play.
4.) The Fed really can't do much about this. Why? It doesn't matter how much cash you have if you don't want to lend it to somebody. But the Fed will try anyway by flooding the market with as many dollars as possible. Hey -- at least it's something, right?
And finally, we have Bernanke's speech:
With respect to household spending, the data received over the past month have been on the soft side. The Committee will have considerable additional information on consumer purchases and sentiment to digest before its next meeting. I expect household income and spending to continue to grow, but the combination of higher gas prices, the weak housing market, tighter credit conditions, and declines in stock prices seem likely to create some headwinds for the consumer in the months ahead.
Core inflation--that is, inflation excluding the relatively more volatile prices of food and energy--has remained moderate. However, the price of crude oil has continued its rise over the past month, a rise that will be reflected in gasoline and heating oil prices and, of course, in the overall inflation rate in the near term. Moreover, increases in food prices and in the prices of some imported goods have the potential to put additional pressures on inflation and inflation expectations. The effectiveness of monetary policy depends critically on maintaining the public’s confidence that inflation will be well controlled. We are accordingly monitoring inflation developments closely.
The incoming data on economic activity and prices will help to shape the Committee’s outlook for the economy; however, the outlook has also been importantly affected over the past month by renewed turbulence in financial markets, which has partially reversed the improvement that occurred in September and October. Investors have focused on continued credit losses and write-downs across a number of financial institutions, prompted in many cases by credit-rating agencies’ downgrades of securities backed by residential mortgages. The fresh wave of investor concern has contributed in recent weeks to a decline in equity values, a widening of risk spreads for many credit products (not only those related to housing), and increased short-term funding pressures. These developments have resulted in a further tightening in financial conditions, which has the potential to impose additional restraint on activity in housing markets and in other credit-sensitive sectors. Needless to say, the Federal Reserve is following the evolution of financial conditions carefully, with particular attention to the question of how strains in financial markets might affect the broader economy.
OK -- here's the translation:
1.) People aren't spending as much because food and gas prices are rising.
2.) The financial markets aren't doing that well and people are noticing. That is adding downward pressure to the markets.
What's really important here is all of the Fed governors have noticed the credit market is in terrible shape. That's the common theme through all of these speeches. And the problems in the credit market were caused by housing -- which isn't going to get better anytime soon. And finally, these problems are starting to negatively impact consumer sentiment and spending.
In short, the Fed is actually paying attention to the economy. The problem is will a rate cut be enough? I've said this over and over again, but the central problem isn't liquidity: it's confidence. When no one has any confidence that a borrower will be around in 90 days, it's difficult to lend money even in the short term. And cutting rates won't do squat about that.
Today's Markets
SPY: -.81%
QQQQ: -.41%
IWM: -1.02%
Finally we have a trend in place. Unfortunately, it's down. Here's a 7 day chart which shows all of the market's action since the big rally.
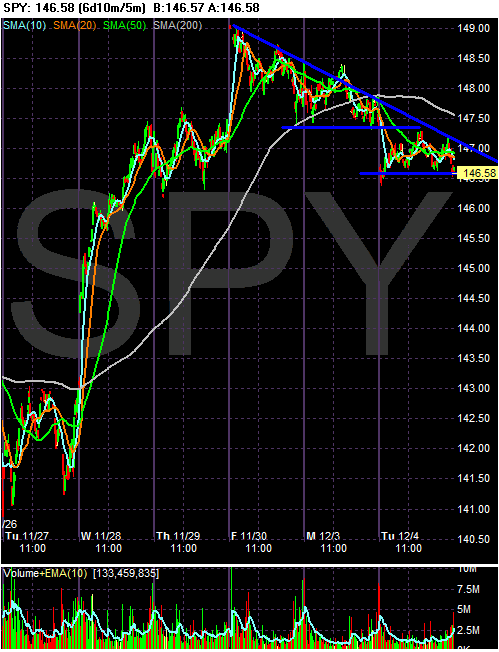
Notice over the last three days there has been a consistent pattern of lower highs and lower lows. Also note the upper trend line that has provided clear resistance for the SPYs.
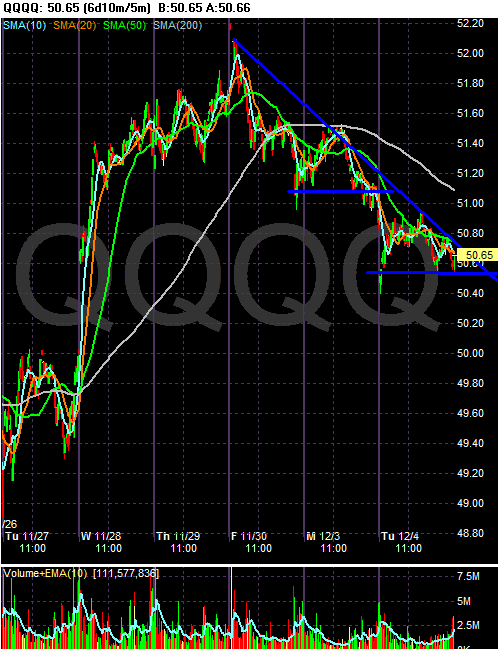
Note the same analysis applies to the QQQQs -- which are down 2.6% from their highs at about 52 a few days ago.
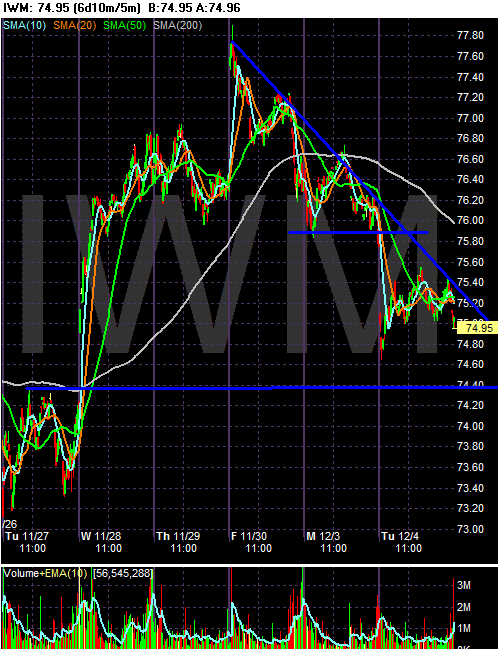
And the Russell 2000 is down 3.66% from its high of about 77.8 a few days ago.
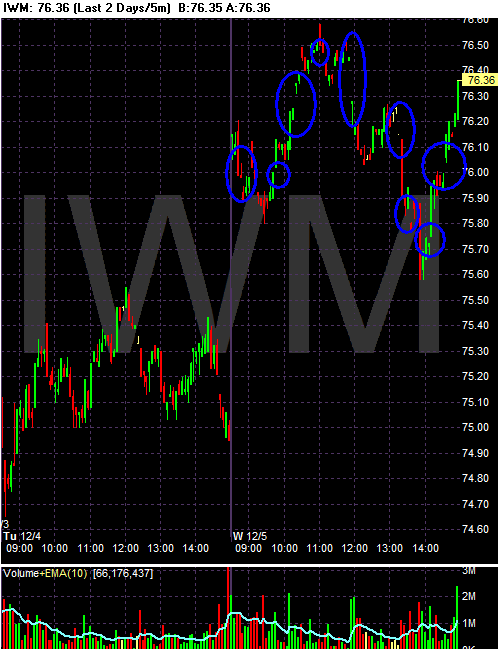
Now -- here are some very interesting charts. They are each three days. I have circled all of the gaps down.
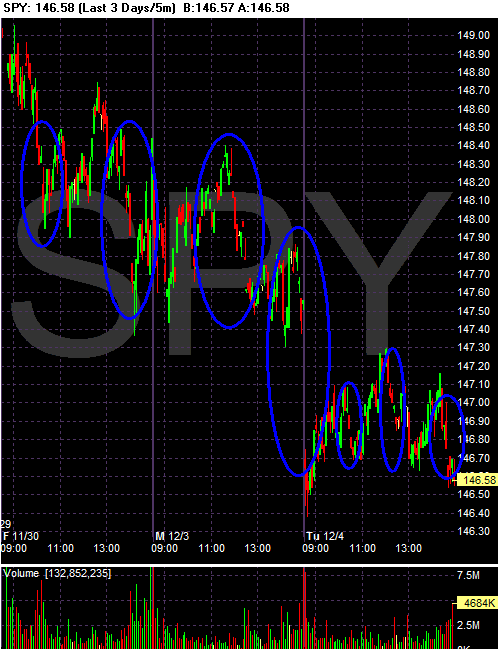
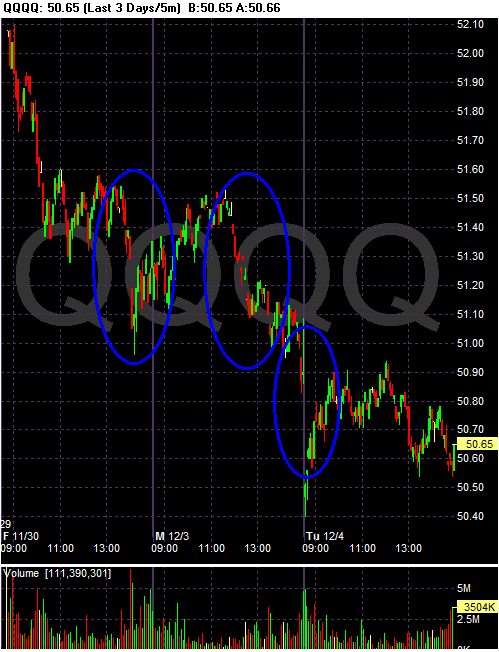
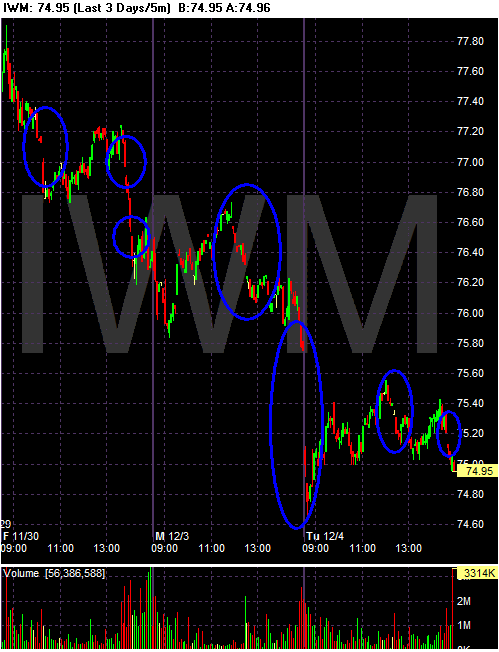
Refer back to each corresponding 7 day chart above. We had a strong gap up before the latest three day sell off. That indicates a change in sentiment.
But the serious gaps down indicate a clear hair trigger on the part of traders. Any sign of bad news and they sell.
Let's look at the daily charts.
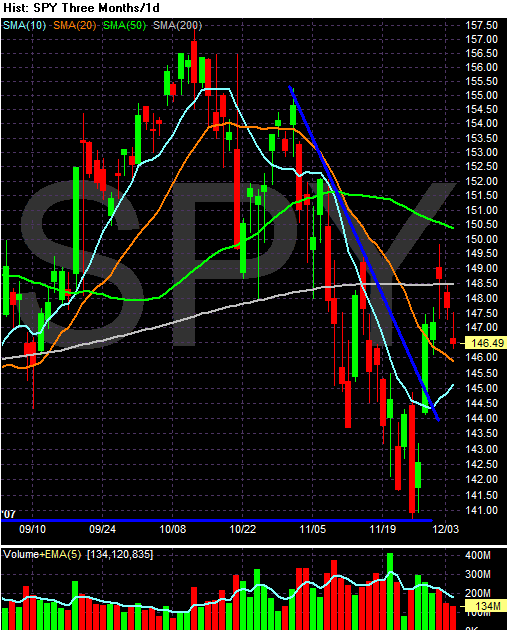
The SPYs chart shows three down days. Three days ago the SPYs printed a "spinning top":
Since then the market has sold off. The only good news is the volume has been decreasing on the downside.
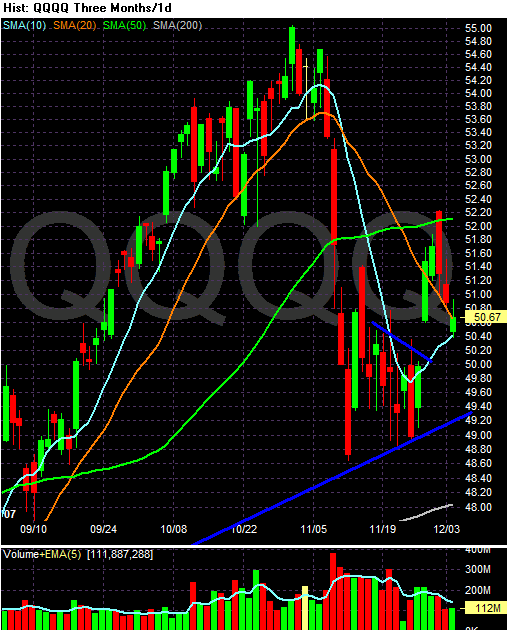
The QQQQs have also been declining. However, they found support at the 10 day SMA.
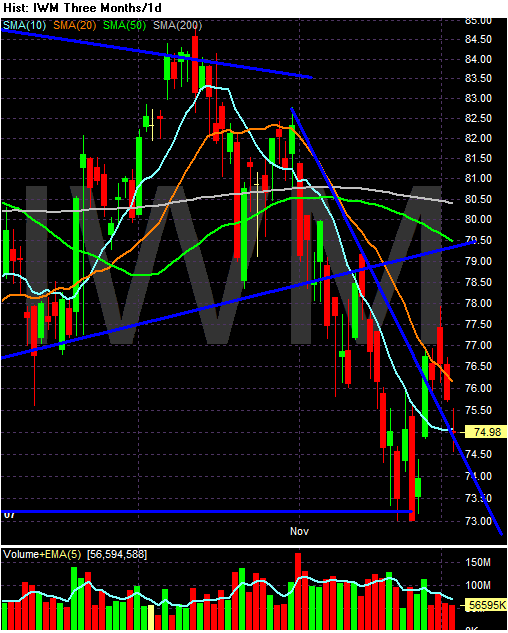
The IWMS have also been declining. But like the SPYs, volume has been decreasing on the downside. And like the QQQQs, the IWMs have found support at their 10 day SMA and the previous resistance line.
These are still very messy markets. While we have a trend in place -- a downside one -- the daily charts don't show any clear trend right now. The large amounts of downside gaps on the daily 5-minute charts indicates traders are extremely nervous and will sell on a dime. In short, the markets are extremely uncertain right now.
QQQQ: -.41%
IWM: -1.02%
Finally we have a trend in place. Unfortunately, it's down. Here's a 7 day chart which shows all of the market's action since the big rally.

Notice over the last three days there has been a consistent pattern of lower highs and lower lows. Also note the upper trend line that has provided clear resistance for the SPYs.

Note the same analysis applies to the QQQQs -- which are down 2.6% from their highs at about 52 a few days ago.

And the Russell 2000 is down 3.66% from its high of about 77.8 a few days ago.
Now -- here are some very interesting charts. They are each three days. I have circled all of the gaps down.


Refer back to each corresponding 7 day chart above. We had a strong gap up before the latest three day sell off. That indicates a change in sentiment.
But the serious gaps down indicate a clear hair trigger on the part of traders. Any sign of bad news and they sell.
Let's look at the daily charts.

The SPYs chart shows three down days. Three days ago the SPYs printed a "spinning top":
Spinning Tops are Japanese Candlesticks that have small bodies with upper and lower shadows/wicks that are longer than the body. Spinning tops reflect uncertainty in the market.
Since then the market has sold off. The only good news is the volume has been decreasing on the downside.

The QQQQs have also been declining. However, they found support at the 10 day SMA.

The IWMS have also been declining. But like the SPYs, volume has been decreasing on the downside. And like the QQQQs, the IWMs have found support at their 10 day SMA and the previous resistance line.
These are still very messy markets. While we have a trend in place -- a downside one -- the daily charts don't show any clear trend right now. The large amounts of downside gaps on the daily 5-minute charts indicates traders are extremely nervous and will sell on a dime. In short, the markets are extremely uncertain right now.
More On Housing Related Industries
The post below got me thinking about housing and related industries. Basically, the underlying question is "how are they doing?"
First, here is a graph from the blog Calculated Risk that shows residential and commercial construction spending.
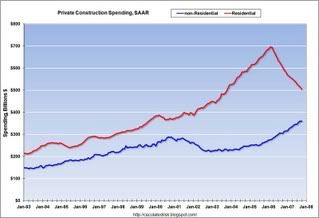
I had to decrease the chart's size to get it on the blog. The red line is residential and the blue line is commercial. The main point I want to get across is commercial construction has helped to pick-up some of the slack caused by the decline in residential construction. As a result, some of the industries below haven't tanked nearly as hard as one would believe given the plight of residential construction.
The charts are from prophet.net, which is a great site for industry graphs. I highly recommend it.
Now -- on to the graphs. All are 5 year graphs, which helps to see the general overall trend of these various sectors.
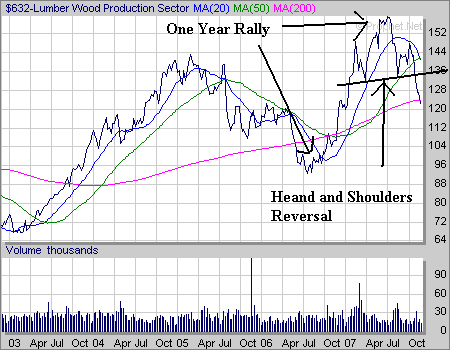
Lumber had a year long rally that started in July of last year. But the index formed a head and shoulders reversal pattern from the spring to the fall of 2007 and has since fallen through the neckline of the head and shoulders patter.
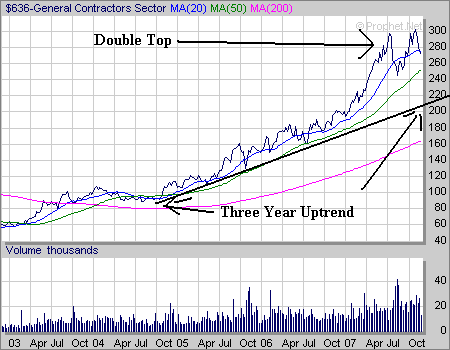
General Contractors have benefited from the increasing commercial construction; their chart remained strong for the last three years. But it appears the chart has formed a double top, indicating a trend reversal may be occurring. We'll need for the index to drop below the low point between the two tops at roughly 250 to confirm that a double top has formed.
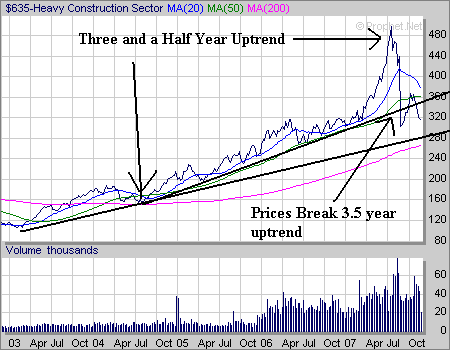
Heavy construction has two uptrends; one that lasts 3.5 years and another that lasts about 4 and a half years. The index has already fallen through the 3.5 year uptrend and found resistance at its previous trend line. That indicates this sector has already experienced a strong sell-off that is related to the current housing market.
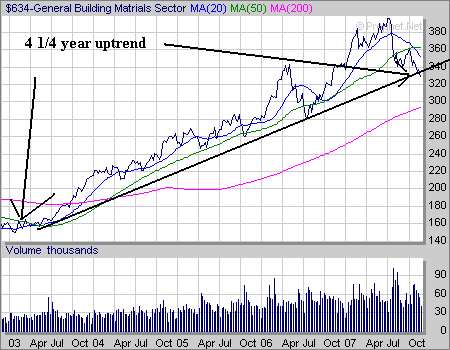
General building materials have already broken a 4.5 year uptrend. But we need a stronger confirmation of the trend break to be sure.
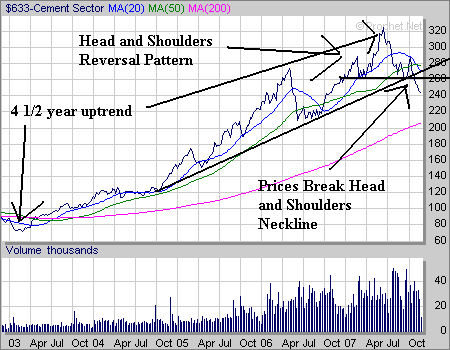
Cement has broken a four and a half year uptrend. It formed a head and shoulders reversal formation from early to late 2007 and fell through the neck line in late 2007.
All of these industries have already reversed or are set to reverse. In other words, these sectors look like great shorts right now.
First, here is a graph from the blog Calculated Risk that shows residential and commercial construction spending.

I had to decrease the chart's size to get it on the blog. The red line is residential and the blue line is commercial. The main point I want to get across is commercial construction has helped to pick-up some of the slack caused by the decline in residential construction. As a result, some of the industries below haven't tanked nearly as hard as one would believe given the plight of residential construction.
The charts are from prophet.net, which is a great site for industry graphs. I highly recommend it.
Now -- on to the graphs. All are 5 year graphs, which helps to see the general overall trend of these various sectors.

Lumber had a year long rally that started in July of last year. But the index formed a head and shoulders reversal pattern from the spring to the fall of 2007 and has since fallen through the neckline of the head and shoulders patter.

General Contractors have benefited from the increasing commercial construction; their chart remained strong for the last three years. But it appears the chart has formed a double top, indicating a trend reversal may be occurring. We'll need for the index to drop below the low point between the two tops at roughly 250 to confirm that a double top has formed.

Heavy construction has two uptrends; one that lasts 3.5 years and another that lasts about 4 and a half years. The index has already fallen through the 3.5 year uptrend and found resistance at its previous trend line. That indicates this sector has already experienced a strong sell-off that is related to the current housing market.

General building materials have already broken a 4.5 year uptrend. But we need a stronger confirmation of the trend break to be sure.

Cement has broken a four and a half year uptrend. It formed a head and shoulders reversal formation from early to late 2007 and fell through the neck line in late 2007.
All of these industries have already reversed or are set to reverse. In other words, these sectors look like great shorts right now.
Monday, December 3, 2007
And You Thought Housing Was Already Bad....
From the Street.com
Yes, you read that right. Lennar sold land on its books for a discount of 60%. Remember -- we're not talking about a product, or a cheap trinket. We're talking about land. Either Lennar was seriously overvaluing its land portfolio or land prices are plummeting.
Yesterday, homebuilders rose:
I have to wonder how long the relief jump will last. Housing is still a complete and total mess.
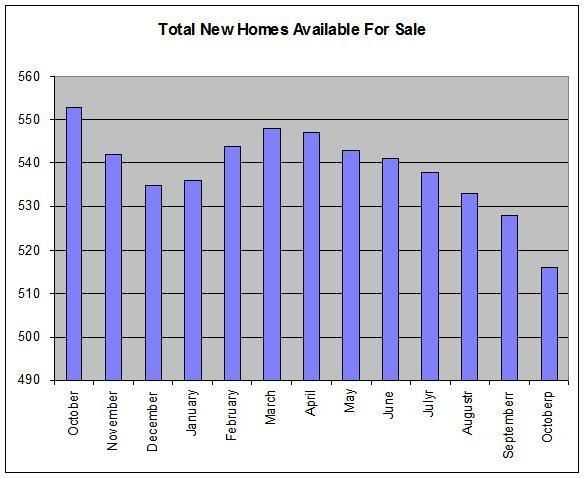
While the total inventory of new homes has come down:
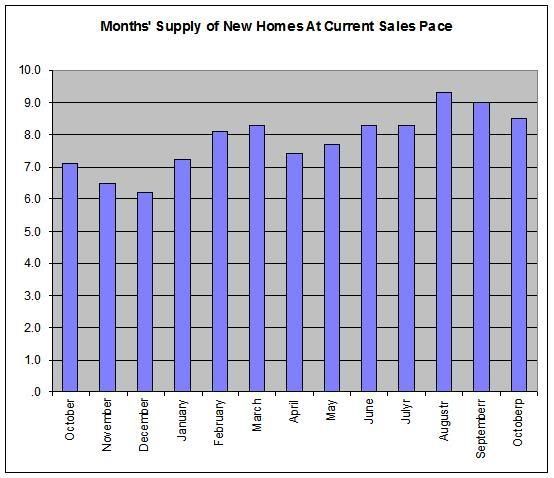
The months of supply at current sales rates is increasing, indicating demand is really tanking.
And the existing homes market -- which is much larger than the new homes market by a factor of 8.5 -- is experiencing the same problems.

Total inventory of existing homes is high

And the months of supply at current rates of existing homes is still increasing:
Here is a chart of the homebuilders ETF, the XHB.
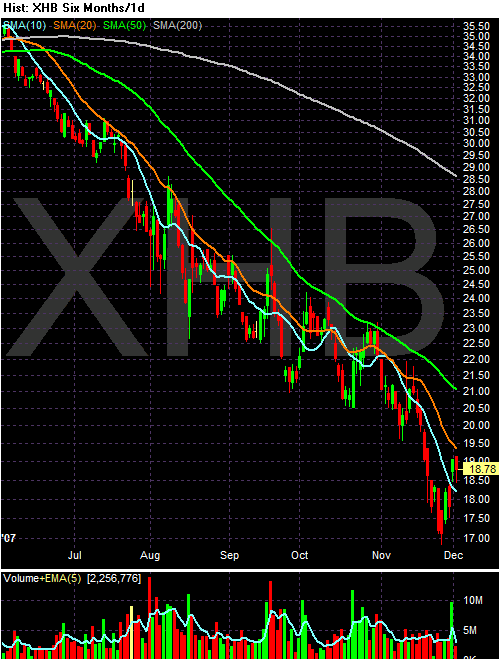
This is an incredibly bearish chart.
1.) Prices are 34% below the 200 day SMA.
2.) All of the moving averages are headed lower.
3.) The shorter SMAs are below the SMAs.
The only good news in this chart is that prices have jumped over the 10 day SMA over the last two days.
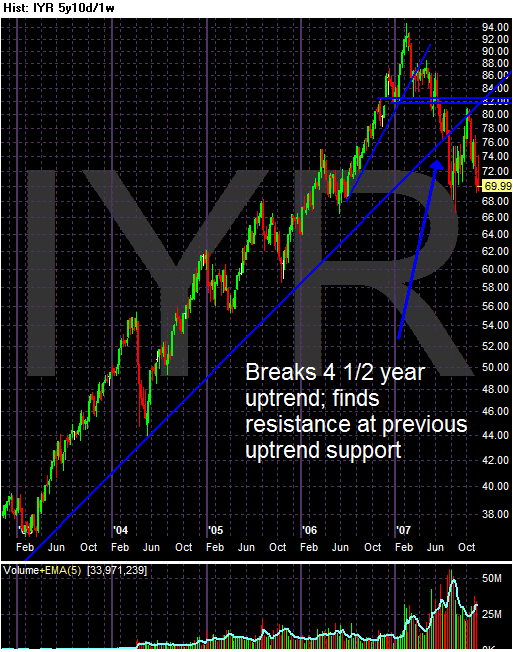
The real estate ETF recently broke a 4-year uptrend. When the ETF tried to rally it ran into resistance at it's previous trend line.
There are a few ways to look at the current chart.
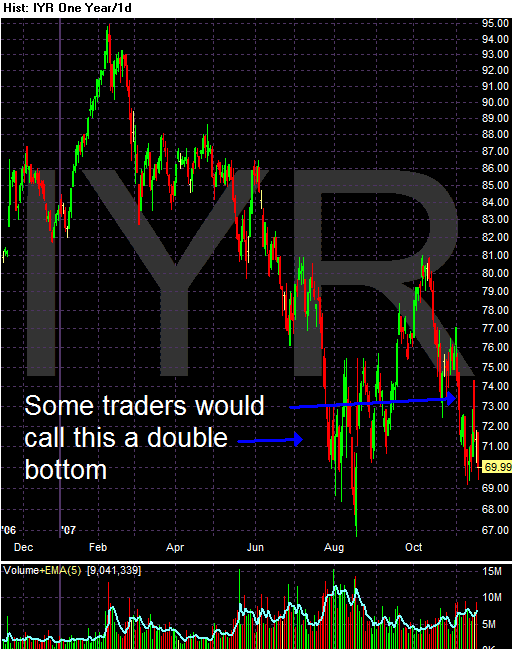
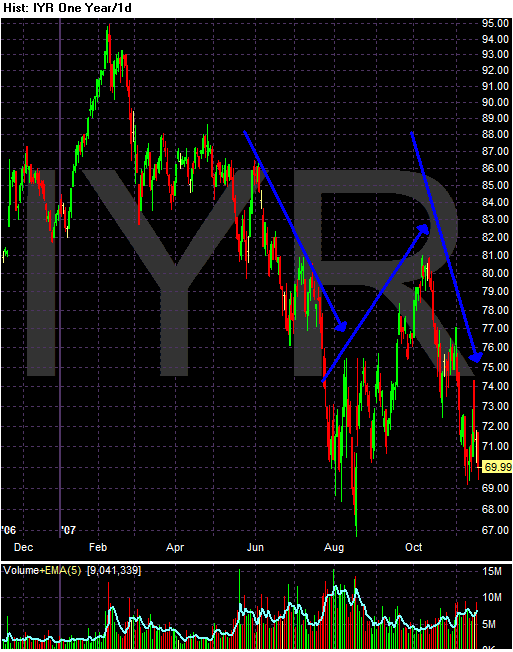
Some traders could see a double bottom. And technically (pun intended and accepted) they would be right. But this is a great example of why technical analysis without fundamental analysis is deeply flawed. As I mentioned above, the fundamental backdrop is terrible, making a rally based on fundamentals highly unlikely. As a result, I think the best way to look at this chart is a sell-off, followed by a rally, followed by a further sell-off.
A look at the moving average picture makes this analysis more likely:
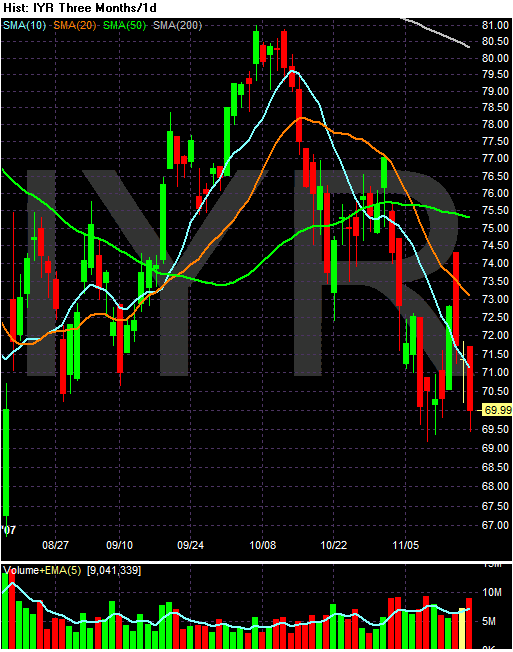
1.) Prices are below the 200 day SMA.
2.) The shorted SMAs are below the longer SMAs.
3.) Prices are below the SMAs.
4.) All the moving averages are heading lower.
However, to confirm this isn't a double bottom, we'll need a price move below the previous lows of about 67 or so.
The Paulsen plan does place a strong wild card into this scenario. Traders are looking for any sign that Washington is doing something about housing. And the plan fills that void. However, the devil is in the details. We'll have to see how that plays out. In addition, it seems the plan would help the financing arm of the mortgage business rather than the builders.
But at the very least, the plan could stop the downward move for awhile while traders figure out if the plan is any good or not.
Lennar's (LEN - Cramer's Take - Stockpickr) sale of a chunk of its land portfolio at a steep discount boosts liquidity for the homebuilder, but it also points to troubling signs about the stock's valuation.
The company sold its land to Morgan Stanley (MS - Cramer's Take - Stockpickr) at a 60% discount to book value. That raises the question: What if all of Lennar's land is worth 60% less than what is stated in the company's financials?
If that's the case, Lennar's stock is wildly overpriced.
The Morgan Stanley deal highlights how much land values are plummeting across the country. The discount falls within the range at which builders are shopping deals to real estate vulture funds, sources say.
Yes, you read that right. Lennar sold land on its books for a discount of 60%. Remember -- we're not talking about a product, or a cheap trinket. We're talking about land. Either Lennar was seriously overvaluing its land portfolio or land prices are plummeting.
Yesterday, homebuilders rose:
Investors bid up the value of housing stocks Monday as the U.S. Treasury secretary said a plan to aid strapped homeowners is close to being finished.
Henry Paulson said he is confident there will soon be an agreement to help thousands of homeowners avoid mortgage defaults by temporarily freezing interest rates. Some 2 million subprime mortgages, loans issued to people with spotty credit histories, are scheduled to reset to higher interest rates in 2008.
I have to wonder how long the relief jump will last. Housing is still a complete and total mess.

While the total inventory of new homes has come down:

The months of supply at current sales rates is increasing, indicating demand is really tanking.
And the existing homes market -- which is much larger than the new homes market by a factor of 8.5 -- is experiencing the same problems.

Total inventory of existing homes is high

And the months of supply at current rates of existing homes is still increasing:
Here is a chart of the homebuilders ETF, the XHB.

This is an incredibly bearish chart.
1.) Prices are 34% below the 200 day SMA.
2.) All of the moving averages are headed lower.
3.) The shorter SMAs are below the SMAs.
The only good news in this chart is that prices have jumped over the 10 day SMA over the last two days.

The real estate ETF recently broke a 4-year uptrend. When the ETF tried to rally it ran into resistance at it's previous trend line.
There are a few ways to look at the current chart.

Some traders could see a double bottom. And technically (pun intended and accepted) they would be right. But this is a great example of why technical analysis without fundamental analysis is deeply flawed. As I mentioned above, the fundamental backdrop is terrible, making a rally based on fundamentals highly unlikely. As a result, I think the best way to look at this chart is a sell-off, followed by a rally, followed by a further sell-off.

A look at the moving average picture makes this analysis more likely:

1.) Prices are below the 200 day SMA.
2.) The shorted SMAs are below the longer SMAs.
3.) Prices are below the SMAs.
4.) All the moving averages are heading lower.
However, to confirm this isn't a double bottom, we'll need a price move below the previous lows of about 67 or so.
The Paulsen plan does place a strong wild card into this scenario. Traders are looking for any sign that Washington is doing something about housing. And the plan fills that void. However, the devil is in the details. We'll have to see how that plays out. In addition, it seems the plan would help the financing arm of the mortgage business rather than the builders.
But at the very least, the plan could stop the downward move for awhile while traders figure out if the plan is any good or not.