It's Saturday.
Don't think about the markets today. Go to something else -- anything else except economics.
Saturday, December 1, 2007
Friday, November 30, 2007
Weekend Weimar and Beagle
I finally got an IPhone recently and I am totally hooked. The IPhone has a camera (like practically every other electronic device out there now) so I have been snapping pictures of my dogs.

This is Kate, a 13 year old female. She is sitting on the Weimar couch.

This is Sarge, who is, well, lounging.

This is a Beagle picture, in honor of the future Mr$. Bonddad who is a Beagle owner. I promise I will start to snap pictures of Scooby, her wonderful Beagle.
The markets are closed. Don't think about the markets. Go do something else.

This is Kate, a 13 year old female. She is sitting on the Weimar couch.

This is Sarge, who is, well, lounging.

This is a Beagle picture, in honor of the future Mr$. Bonddad who is a Beagle owner. I promise I will start to snap pictures of Scooby, her wonderful Beagle.
The markets are closed. Don't think about the markets. Go do something else.
Personal Consumption Expenditures Up .2%
From the AP:
From the BEA:
Here's a graph of the last six months of increases.
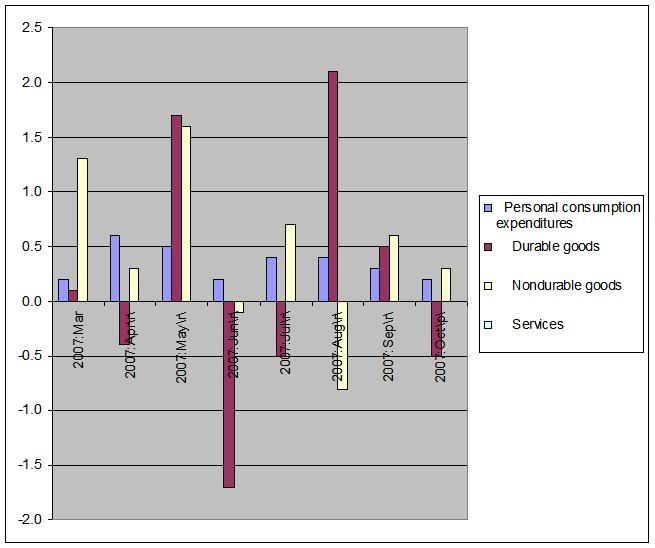
The light blue line is total expenditures. Notice it has declined for the last three months. Also notice there is very little difference between July and August. In effect, we've had four months of problems with this number.
Also notice how the durable goods numbers is jumping around quite a bit. May's number was followed by two months of contraction. August's jump was followed by September's weaker performance and last months decline. Some of this is to be expected; durable goods are goods that last a long time and are therefore more expensive. As a result, cash outlays for them are probably more prone to these types of jumps.
However, I have speculated that durable goods numbers are indicative of consumer sentiment. Because durable goods are more expensive, they are typically more expensive and therefore require financing. As a result, a durable goods order purchase means a financial commitment that requires confidence on the purchaser's part that they can continue to make payments. If a purchaser doesn't think he can make payments over an extended period of time, he is less likely to buy the item. Assuming my statement is correct -- the durable goods purchases are an indication of consumer confidence -- than this number should raise some eyebrows.
Consumers, battered by a slumping housing market and a credit crunch, slowed the growth in spending to the smallest amount in four months.
The Commerce Department reported Friday that consumer spending edged up 0.2 percent in October, the weakest showing since a similar increase in June. Individual incomes grew by just 0.2 percent last month, the poorest showing in six months.
From the BEA:
Personal income increased $21.2 billion, or 0.2 percent, and disposable personal income (DPI) increased $14.0 billion, or 0.1 percent, in October, according to the Bureau of Economic Analysis. Personal consumption expenditures (PCE) increased $23.8 billion, or 0.2 percent. In September, personal income increased $50.4 billion, or 0.4 percent, DPI increased $43.2 billion, or 0.4 percent, and PCE increased $33.0 billion, or 0.3 percent, based on revised estimates.
Here's a graph of the last six months of increases.

The light blue line is total expenditures. Notice it has declined for the last three months. Also notice there is very little difference between July and August. In effect, we've had four months of problems with this number.
Also notice how the durable goods numbers is jumping around quite a bit. May's number was followed by two months of contraction. August's jump was followed by September's weaker performance and last months decline. Some of this is to be expected; durable goods are goods that last a long time and are therefore more expensive. As a result, cash outlays for them are probably more prone to these types of jumps.
However, I have speculated that durable goods numbers are indicative of consumer sentiment. Because durable goods are more expensive, they are typically more expensive and therefore require financing. As a result, a durable goods order purchase means a financial commitment that requires confidence on the purchaser's part that they can continue to make payments. If a purchaser doesn't think he can make payments over an extended period of time, he is less likely to buy the item. Assuming my statement is correct -- the durable goods purchases are an indication of consumer confidence -- than this number should raise some eyebrows.
Bernanke's Speech
From Bernanke's speech:
I've explained my reservations about the current employment numbers in this article.. Short version: the birth/death model is responsible for a large number of recently created jobs. While I can't say for certain these reports are wrong, I personally have some very deep suspicions about their veracity.
Dealing with consumer spending is incredibly complicated. Let's start with a basic premise: Americans love to shop. They will do anything to keep on shopping. Parents will sell their children for medical experiments to keep shopping. Any headwinds have to be seen in this light. However, there are a ton of headwinds out there. The question is what is the exact relationship between fact number one and the current economic environment? Exactly how strong are the headwinds and to what degree are people heeding them? I have no idea, and figuring that one out is a Herculean economic task.
As for his statements on inflation ... Ben can read charts! Ben can read charts! Thank God he finally started to mention food and energy inflation. I was beginning to wonder just how out-of-touch he was. As to what he does about it is anybody's guess. But at least he knows the problem is out there and will probably have a negative impact on prices.
Being the Fed Chairman right now would suck. On one hand you have an economy that is withstanding a financial market catastrophe and slower economic growth. On the other hand, you have inflation.
Personally -- and not like Ben calls me on a regular basis or anything -- I'd err on the side of keeping the inflation genie in the bottle. Once inflation starts to run, getting it back under control is often an extremely painful process (just ask Paul Volcker). And as I've said time and time again, the issue in the credit markets is about counter-party confidence not money. So lowering rates really isn't the solution.
How has the economic picture changed in the month since that meeting? As is often the case, the incoming economic data have been mixed. In the market for residential real estate, indicators of construction and home sales have continued to be weak. In contrast, the labor market remained solid in October, with some 130,000 new jobs added to private-sector payrolls and the unemployment rate remaining at 4.7 percent. Claims for unemployment insurance have drifted up a bit in recent weeks, although, on average, they have remained at a level consistent with moderate expansion in employment. We will, of course, have the labor market report for November next week, and in the coming days we will continue to draw on anecdotal reports, surveys, and other sources of information about employment and wages. Continued good performance by the labor market is important for maintaining the economic expansion, as growth in earnings helps to underpin household spending.
With respect to household spending, the data received over the past month have been on the soft side. The Committee will have considerable additional information on consumer purchases and sentiment to digest before its next meeting. I expect household income and spending to continue to grow, but the combination of higher gas prices, the weak housing market, tighter credit conditions, and declines in stock prices seem likely to create some headwinds for the consumer in the months ahead.
Core inflation--that is, inflation excluding the relatively more volatile prices of food and energy--has remained moderate. However, the price of crude oil has continued its rise over the past month, a rise that will be reflected in gasoline and heating oil prices and, of course, in the overall inflation rate in the near term. Moreover, increases in food prices and in the prices of some imported goods have the potential to put additional pressures on inflation and inflation expectations. The effectiveness of monetary policy depends critically on maintaining the public’s confidence that inflation will be well controlled. We are accordingly monitoring inflation developments closely.
I've explained my reservations about the current employment numbers in this article.. Short version: the birth/death model is responsible for a large number of recently created jobs. While I can't say for certain these reports are wrong, I personally have some very deep suspicions about their veracity.
Dealing with consumer spending is incredibly complicated. Let's start with a basic premise: Americans love to shop. They will do anything to keep on shopping. Parents will sell their children for medical experiments to keep shopping. Any headwinds have to be seen in this light. However, there are a ton of headwinds out there. The question is what is the exact relationship between fact number one and the current economic environment? Exactly how strong are the headwinds and to what degree are people heeding them? I have no idea, and figuring that one out is a Herculean economic task.
As for his statements on inflation ... Ben can read charts! Ben can read charts! Thank God he finally started to mention food and energy inflation. I was beginning to wonder just how out-of-touch he was. As to what he does about it is anybody's guess. But at least he knows the problem is out there and will probably have a negative impact on prices.
Being the Fed Chairman right now would suck. On one hand you have an economy that is withstanding a financial market catastrophe and slower economic growth. On the other hand, you have inflation.
Personally -- and not like Ben calls me on a regular basis or anything -- I'd err on the side of keeping the inflation genie in the bottle. Once inflation starts to run, getting it back under control is often an extremely painful process (just ask Paul Volcker). And as I've said time and time again, the issue in the credit markets is about counter-party confidence not money. So lowering rates really isn't the solution.
Subprime Deal in the Works?
From the WSJ:
This is very interesting news, and it allows me to advance my Hank Paulsen theory.
My theory (for which I have no proof at all) is that Paulsen told the White House he would take the Treasury position if he had little to no political interference and he could pretty much do what he wants. The White House agreed because Paulsen's resume speaks for itself. He had an incredibly successful career on Wall Street. My guess is he wanted to end his professional career in a public service role. Again -- all of this is just my guess.
I should also advance Bonddad's personal belief about how a President should pick a Treasury Secretary. Every president should go to Wall Street and find 5 people who are in the same political camp and pick the one he likes the most. Not that anyone's asking, but that's how we should get our Treasury secretary from now on.
Paulsen is running into a big problem right now. He's in the middle of a situation that calls for some sort of government intervention, yet he is personally opposed to government intervention. Philosophically he's running into a big problem and has to figure out exactly what he can do within his own belief system. For any person who is self-aware, places like this are fascinating and wonderful experiences; they provide incredible opportunities to grow. In short, I'm sure it's a very interesting place for him on a personal level.
All that being said, some type of plan was bound to some into play as the mortgage mess plays out. The question is how to accomplish this. The article mentions one group of borrowers will be helped: "those who could keep their homes if the maturity date of their mortgages were extended or the interest rates remained at the teaser rates." would be the only people eligible. It looks as though all of the mortgage lenders are going to have to basically re-qualify a ton of borrowers. In fact, if this plan goes through it means that lenders are going to have to do th ejob they should have done in the first place.
The Bush administration and major financial institutions are close to agreeing on a plan that would temporarily freeze interest rates on certain troubled subprime home loans, according to people familiar with the negotiations.
.....
The plan is being negotiated between regulators including the Treasury Department and a coalition of mortgage-related companies including Citigroup Inc., Wells Fargo & Co., Washington Mutual Inc. and Countrywide Financial Corp. People familiar with the talks say the individual members have agreed to follow any agreement reached by the coalition, which is called the Hope Now Alliance.
Details of the plan, which could be announced as early as next week, are still being worked out. In general, the government and the coalition have largely agreed to extend the lower introductory rate on home loans for certain borrowers who will have trouble making payments once their mortgages increase.
.....
Exactly which borrowers will qualify for the freeze and how long the freeze would last are yet to be determined. Under one scenario, the freeze could run as long as seven years. The parties are developing standard criteria that would determine eligibility. The criteria should be finalized by the end of year.
.....
Treasury officials say financial institutions are likely to set criteria that divide subprime borrowers into three groups: those who can continue to make their payments even if rates rise, those who can't afford their mortgages even if rates stay steady, and those who could keep their homes if the maturity date of their mortgages were extended or the interest rates remained at the teaser rates. Only the third group would be eligible for help.
This is very interesting news, and it allows me to advance my Hank Paulsen theory.
My theory (for which I have no proof at all) is that Paulsen told the White House he would take the Treasury position if he had little to no political interference and he could pretty much do what he wants. The White House agreed because Paulsen's resume speaks for itself. He had an incredibly successful career on Wall Street. My guess is he wanted to end his professional career in a public service role. Again -- all of this is just my guess.
I should also advance Bonddad's personal belief about how a President should pick a Treasury Secretary. Every president should go to Wall Street and find 5 people who are in the same political camp and pick the one he likes the most. Not that anyone's asking, but that's how we should get our Treasury secretary from now on.
Paulsen is running into a big problem right now. He's in the middle of a situation that calls for some sort of government intervention, yet he is personally opposed to government intervention. Philosophically he's running into a big problem and has to figure out exactly what he can do within his own belief system. For any person who is self-aware, places like this are fascinating and wonderful experiences; they provide incredible opportunities to grow. In short, I'm sure it's a very interesting place for him on a personal level.
All that being said, some type of plan was bound to some into play as the mortgage mess plays out. The question is how to accomplish this. The article mentions one group of borrowers will be helped: "those who could keep their homes if the maturity date of their mortgages were extended or the interest rates remained at the teaser rates." would be the only people eligible. It looks as though all of the mortgage lenders are going to have to basically re-qualify a ton of borrowers. In fact, if this plan goes through it means that lenders are going to have to do th ejob they should have done in the first place.
Thursday, November 29, 2007
Credit Crunch Still Going Strong
From the NY Times:
From Bloomberg:
When people in the financial markets start to compare recent events to another financial disaster you know things are bad.
This is a huge problem and it isn't going away anytime soon. It is also the primary reason why more rate cuts won't do any good. The problem is not about money. It's about confidence. It seems like everyday we hear from a financial company that is writing down a portfolio, or has massive losses in mortgage related products or something similar. The issue is confidence -- as in, "will this borrower be able to pay me back in even a short period of time?" More and more the answer is coming back "no," so loans are drying up.
This highlights the bigger issue, which is the impact of spreading risk out far and wide. While I am all for structures that spread risk out, I am not all for -- and in fact am completely against -- the terrible underwriting standards the lending industry had for about two years. Basically lenders would check to see if a borrower had a pulse. If he was alive, he got a loan (and frankly, I think the pulse was optional with some lenders). Lenders were confident they could spread this risk out far enough so that it wouldn't have an impact.
Well -- now we know better. And as a result credit -- which is the lifeblood of the modern economy -- is tightening right before out very eyes.
And the problem is this is just getting started. Below is a chart from the IMF with data from Credit Suisse. I've pulled this chart out half a million times since it came out, and I will continue to do so. It shows very clearly that we have another 3-4 years of mortgage resets coming. And the sheer amount of those rests is huge. Notice that in 2010 and 2011 we have similar monthly totals of resets that we had this year. And this year has sucked royally.
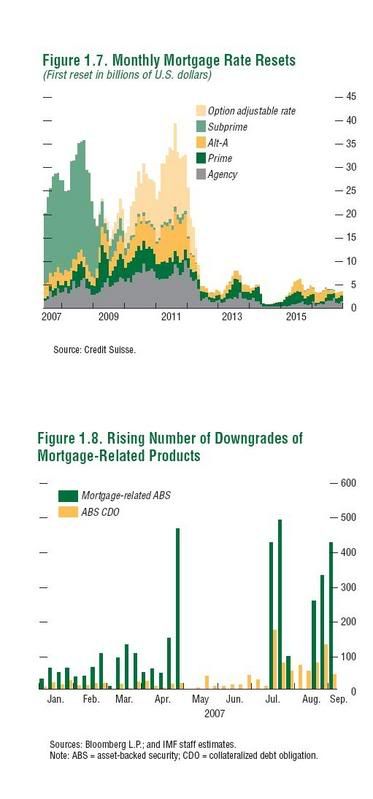
This chart is one of the main reasons I have been sharply critical of anyone advising people to buy financial companies. I think that advice is reckless beyond belief considering the implications of the above chart.
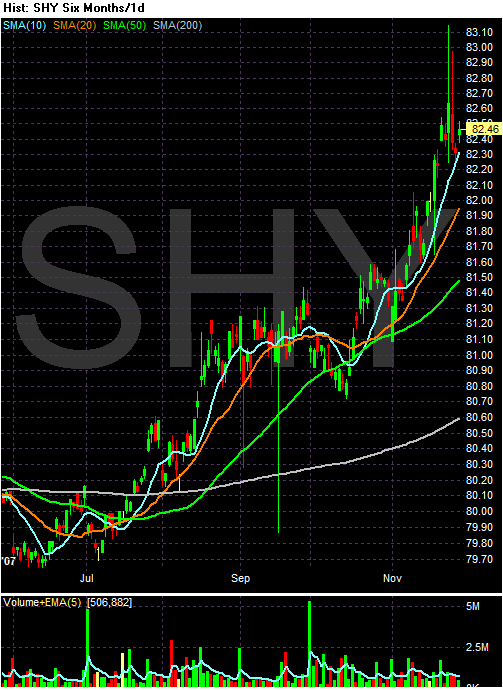
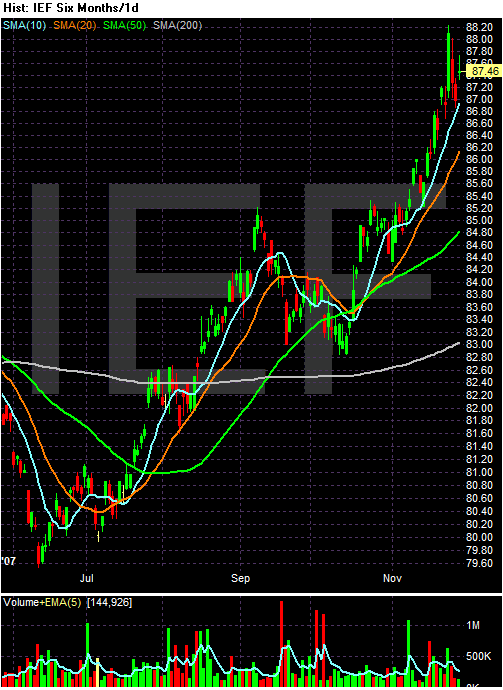
As a result of all of this, we've seen a huge flight to quality. That means Treasury bonds are rallying.
1-3 year Treasury ETF
7-10 year Treasury ETF
20+ year Treasury ETF
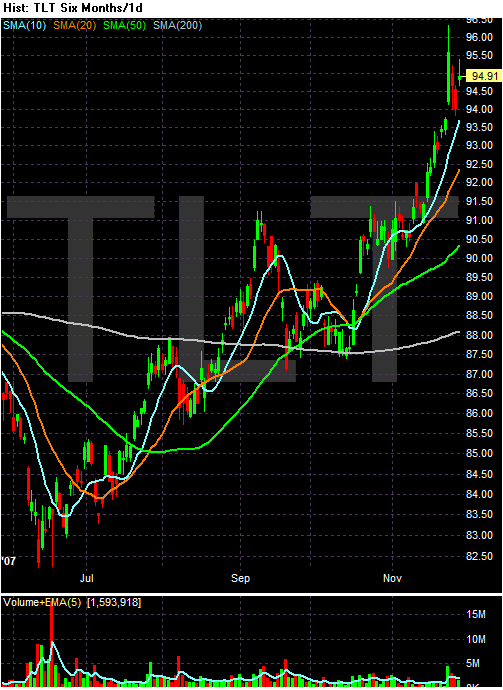
So long as the uncertainly about the credit markets is out there I doubt we'll see a sell-off in the bond market.
The combined value of two leading sources of credit — outstanding commercial and industrial bank loans, and short-term loans known as commercial paper — peaked at about $3.3 trillion in August, according to data from the Federal Reserve. By mid-November, such credit was down to $3 trillion, a drop of nearly 9 percent.
Not once in the years since the Fed began tracking such numbers in 1973 has this artery of finance constricted so rapidly. Smaller declines preceded three recessions going back to 1975; at other times such declines tended to occur in conjunction with an economic downturn.
Policy makers at the Federal Reserve are growing increasingly alarmed about the problem, which is an outgrowth of the woes of the housing and mortgage industries. Just yesterday, the Fed’s vice chairman, Donald L. Kohn, said that the latest market turbulence appeared to be reducing credit to businesses and consumers, hinting that the central bank, in response, was prepared to cut interest rates further.
From Bloomberg:
``The credit crunch began in earnest back in July, but what you're seeing now is it's deepening and spreading out,'' said Kathleen Bostjancic, an economist in New York at Merrill Lynch & Co., which expects the Fed's target lending rate to fall to 2 percent by the end of the second quarter of 2009. ``You're seeing a tremendous flight to quality.''
.....
``Certainly it feels a lot like the Long-Term Capital Management crisis,'' said Vincent Boberski, senior vice president of portfolio strategies in Chicago at FTN Financial.
When people in the financial markets start to compare recent events to another financial disaster you know things are bad.
This is a huge problem and it isn't going away anytime soon. It is also the primary reason why more rate cuts won't do any good. The problem is not about money. It's about confidence. It seems like everyday we hear from a financial company that is writing down a portfolio, or has massive losses in mortgage related products or something similar. The issue is confidence -- as in, "will this borrower be able to pay me back in even a short period of time?" More and more the answer is coming back "no," so loans are drying up.
This highlights the bigger issue, which is the impact of spreading risk out far and wide. While I am all for structures that spread risk out, I am not all for -- and in fact am completely against -- the terrible underwriting standards the lending industry had for about two years. Basically lenders would check to see if a borrower had a pulse. If he was alive, he got a loan (and frankly, I think the pulse was optional with some lenders). Lenders were confident they could spread this risk out far enough so that it wouldn't have an impact.
Well -- now we know better. And as a result credit -- which is the lifeblood of the modern economy -- is tightening right before out very eyes.
And the problem is this is just getting started. Below is a chart from the IMF with data from Credit Suisse. I've pulled this chart out half a million times since it came out, and I will continue to do so. It shows very clearly that we have another 3-4 years of mortgage resets coming. And the sheer amount of those rests is huge. Notice that in 2010 and 2011 we have similar monthly totals of resets that we had this year. And this year has sucked royally.

This chart is one of the main reasons I have been sharply critical of anyone advising people to buy financial companies. I think that advice is reckless beyond belief considering the implications of the above chart.
As a result of all of this, we've seen a huge flight to quality. That means Treasury bonds are rallying.
1-3 year Treasury ETF

7-10 year Treasury ETF

20+ year Treasury ETF

So long as the uncertainly about the credit markets is out there I doubt we'll see a sell-off in the bond market.
Today's Markets
Good news today for the bulls. The markets didn't have a late day sell-off for a second day in a row.
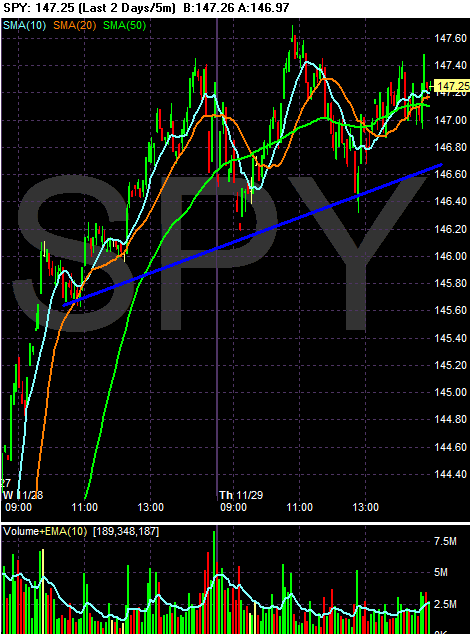
The SPYs closed a touch lower. But they maintained their uptrend they started yesterday. On the negative side, the moving averages are pretty bunch-up right now, which indicates a lack of short-term direction.
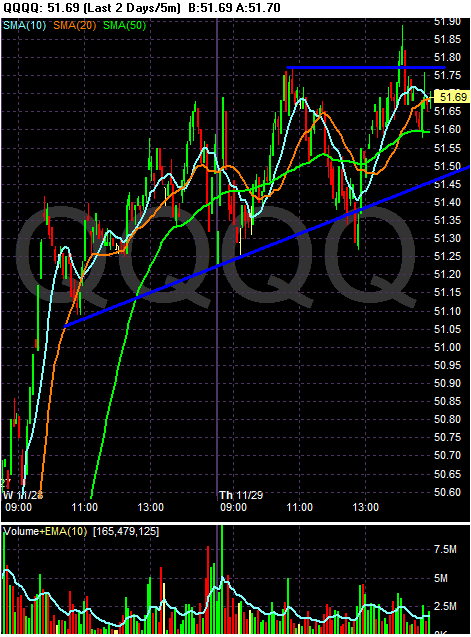
The QQQQs had the best day of the averages (SPY and IWM). It's possible the average is forming a triangle consolidation pattern, but we'll need tomorrow's action to see for sure.
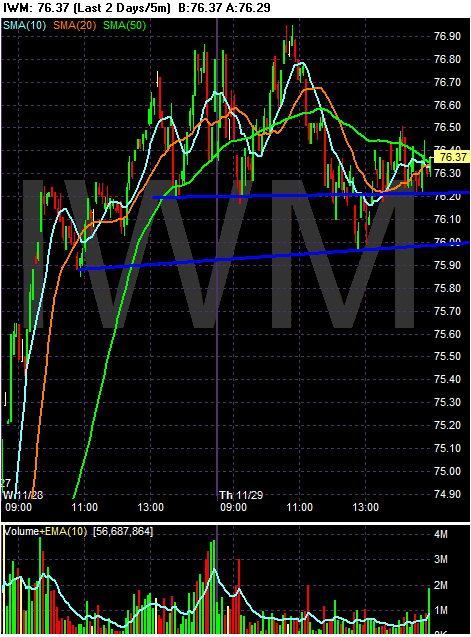
The IWMs closed down .5%. There are two trend lines in place. The lowest is the weakest because the space between the two points of contact with prices are pretty far apart. There is a second trend line in place which appears stronger because of more price contact and a closer spacing between the points of contact.
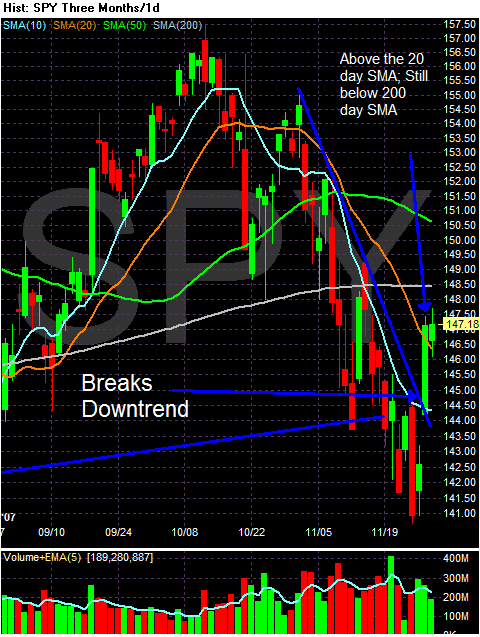
On the daily chart, note the SPYs broke their downward trend line of a few weeks duration. Prices are also over the 20 day SMA which they can use for support for a further rally or to prevent a drop into lower territory. Prices also gapped up yesterday which is a bullish sign.
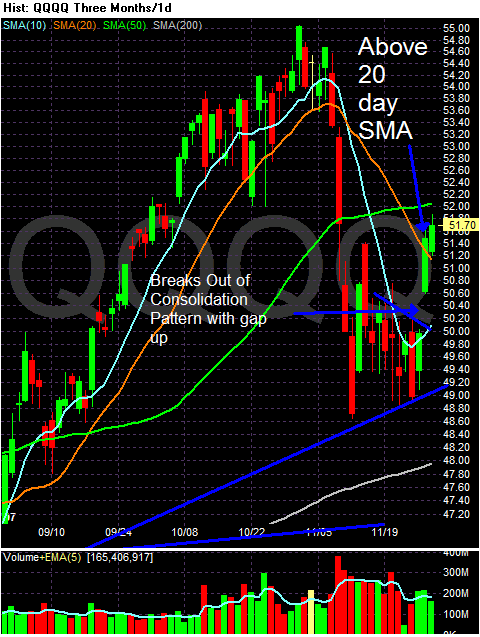
The QQQQs had a stronger gap up and a stronger bar rallying from the 20 day SMA. The average is also above the 200 day SMA, keeping it in bullish territory.
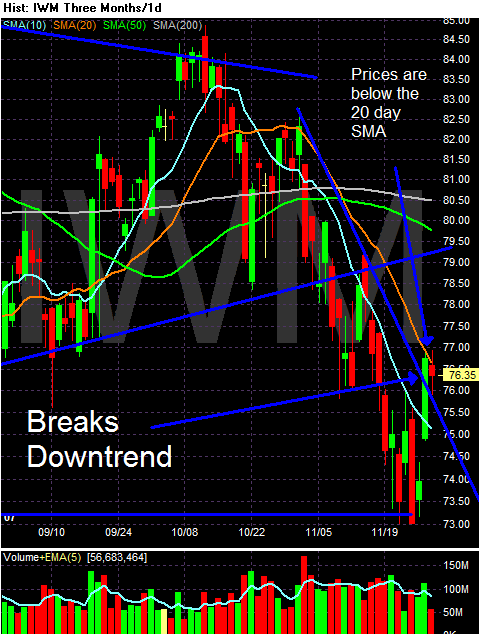
The Russell 2000 broke its weeks long downtrend, but the average is still trading below the 20 day SMA.
So -- where do we go from here?
Let's start with a blatantly obvious observation: markets can move in three directions -- up, sideways or down (duh!!!).
Going Up: I'd assign this at most a 20% possibility. There is just too much bad news out there. Also consider today's GDP announcement and its lack of impact on the markets. If that news had come at the beginning of an economic expansion, the markets would probably have exploded. Instead we got a very lackluster response. I think the markets know that number is yesterday's news and the economy is going into a weaker period. In addition, there is a ton of bad news out there. This week's housing news was terrible and indicated we're nowhere near bottom. And the durable goods number was another bad number.
Sideways: Of the remaining 80%, I'd give this a 40%. Yesterday's dovish Fed speech ignited the rally and some of that is still there. So long as there is the possibility of another cut in the pike the market will have an implied floor somewhere.
Down: Only 40% left, isn't there? There's a ton of bad news out there still. For example, from the various estimates I have read of the sub-prime problem, it seems the median amount of predicted losses is about $300 billion or so. But we haven't seen more than $75 billion in announced writedowns yet. In other words, everyday it's possible we'll see a financial player announce a loss related to mortgage paper. In addition, the Christmas season news I have been reading is mixed. While shopping is pretty good, retailers are having to heavily discount, meaning profits might be really thin. And Sears' announcement today didn't help at all.
So, I think we're nearing the end of a sucker's rally. The question is do we trade sideways or move lower. At that point, flip a coin.

The SPYs closed a touch lower. But they maintained their uptrend they started yesterday. On the negative side, the moving averages are pretty bunch-up right now, which indicates a lack of short-term direction.

The QQQQs had the best day of the averages (SPY and IWM). It's possible the average is forming a triangle consolidation pattern, but we'll need tomorrow's action to see for sure.

The IWMs closed down .5%. There are two trend lines in place. The lowest is the weakest because the space between the two points of contact with prices are pretty far apart. There is a second trend line in place which appears stronger because of more price contact and a closer spacing between the points of contact.

On the daily chart, note the SPYs broke their downward trend line of a few weeks duration. Prices are also over the 20 day SMA which they can use for support for a further rally or to prevent a drop into lower territory. Prices also gapped up yesterday which is a bullish sign.

The QQQQs had a stronger gap up and a stronger bar rallying from the 20 day SMA. The average is also above the 200 day SMA, keeping it in bullish territory.

The Russell 2000 broke its weeks long downtrend, but the average is still trading below the 20 day SMA.
So -- where do we go from here?
Let's start with a blatantly obvious observation: markets can move in three directions -- up, sideways or down (duh!!!).
Going Up: I'd assign this at most a 20% possibility. There is just too much bad news out there. Also consider today's GDP announcement and its lack of impact on the markets. If that news had come at the beginning of an economic expansion, the markets would probably have exploded. Instead we got a very lackluster response. I think the markets know that number is yesterday's news and the economy is going into a weaker period. In addition, there is a ton of bad news out there. This week's housing news was terrible and indicated we're nowhere near bottom. And the durable goods number was another bad number.
Sideways: Of the remaining 80%, I'd give this a 40%. Yesterday's dovish Fed speech ignited the rally and some of that is still there. So long as there is the possibility of another cut in the pike the market will have an implied floor somewhere.
Down: Only 40% left, isn't there? There's a ton of bad news out there still. For example, from the various estimates I have read of the sub-prime problem, it seems the median amount of predicted losses is about $300 billion or so. But we haven't seen more than $75 billion in announced writedowns yet. In other words, everyday it's possible we'll see a financial player announce a loss related to mortgage paper. In addition, the Christmas season news I have been reading is mixed. While shopping is pretty good, retailers are having to heavily discount, meaning profits might be really thin. And Sears' announcement today didn't help at all.
So, I think we're nearing the end of a sucker's rally. The question is do we trade sideways or move lower. At that point, flip a coin.
Wednesday, November 28, 2007
Beige Book + Charts
In this article, I'm going to combine the Fed's Beige Book with some relevant charts to see how the markets and the Fed are lining up. The Fed's writing will be off set and italicized.
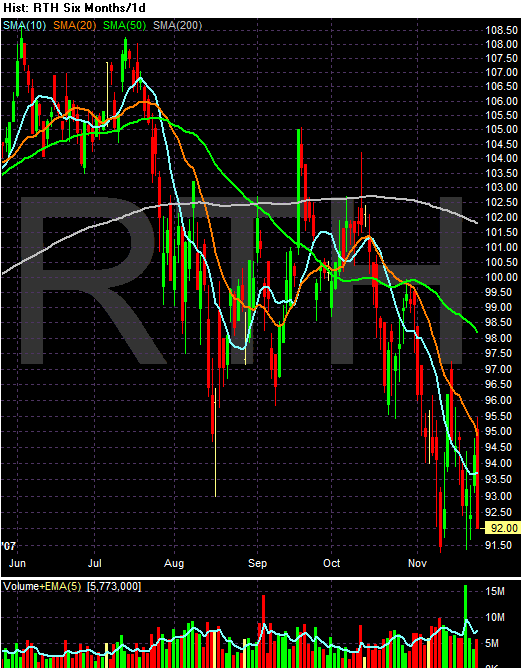
The retail ETF is clearly in a bearish posture. Prices are below the 200 day SMA by 9.3%. All of the shorter SMAs are moving lower, the shorter SMAs are below the longer SMAs and prices are below all the SMAs. This is a chart that says "sell me."
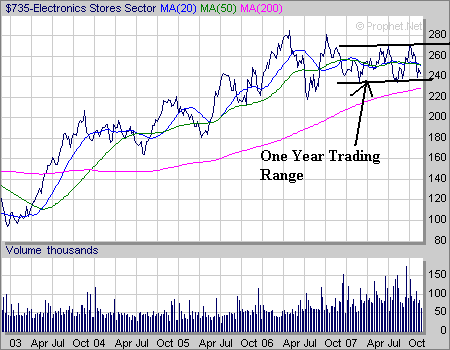
The electronic stores sector is at least above the 200 day SMA. But it has been in a trading range for the better part of a year. Also notice the shorter SMAs are bunched-up indicating a lack of direction.
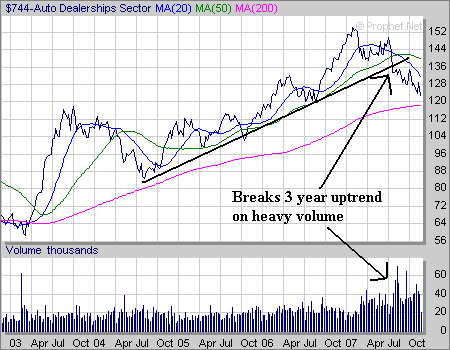
While the auto dealership sector is still above the 200 day SMA, it broke a three year uptrend on heavy volume earlier this year. That indicates this sector is in the middle of a trend reversal.
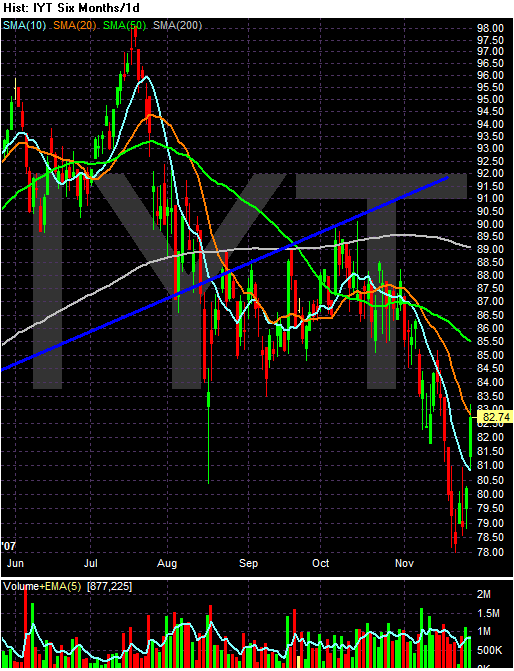
The transports are in a bear market. Prices are below the 200 day SMA. The shorter SMAs are below the longer SMAs and all the shorter SMAs are heading lower. While this index experienced a bounce yesterday, we have a long way to go before we can confirm this is a trend reversal.
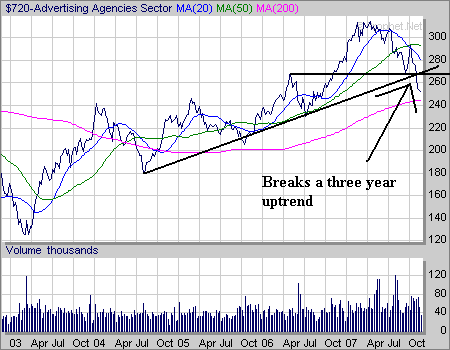
Ad agencies broke a three year uptrend recently, although they are still about the 200 day SMA.
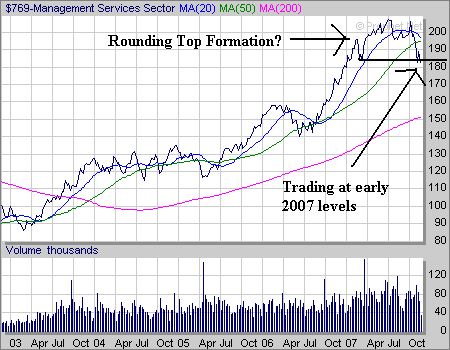
Management services formed a double top and are currently trading at important support levels. However, this sector is still in bull market territory.
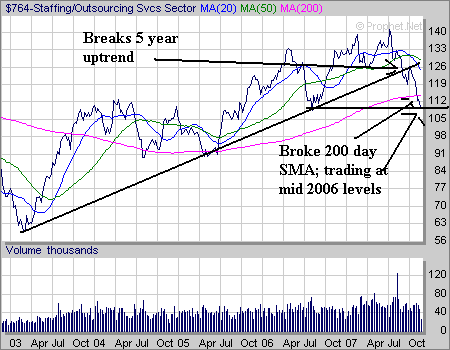
Staffing agencies have
1.) Broken a 5-year uptrend,
2.) Broken through the 200 day SMA
3.) And are trading at a technically important level. If they fall further they have a ways to go before they find additional technical support.
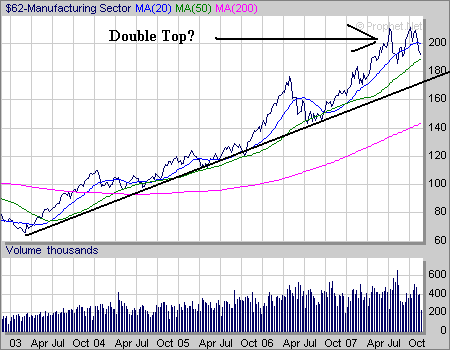
Manufacturing is still in a strong uptrend. However, it may have formed a double top over the last few months.
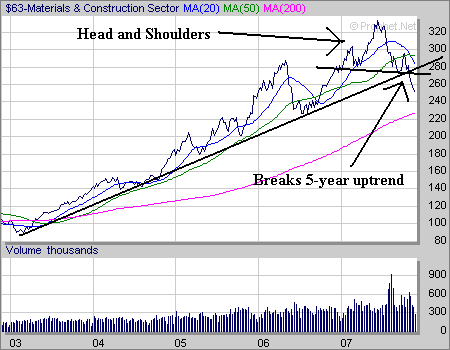
Materials and Construction formed a head and shoulders formation over 2007 and recently broke through a 5 year trend line.
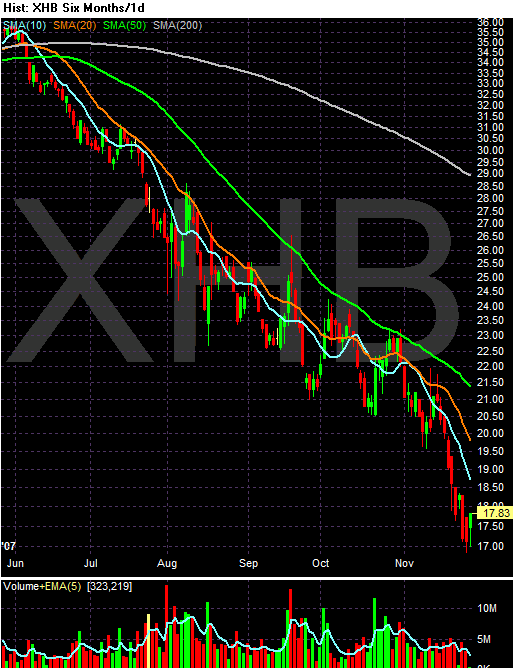
The homebuilders ETF is in a bearish chart. Prices are below the 200 day SMA; shorter SMAs are below longer SMAs; all the SMAs are moving lower and prices are below all the SMAs. It does not get more bearish than this.

The real estate ETF broke a 5 year uptrend earlier this year.
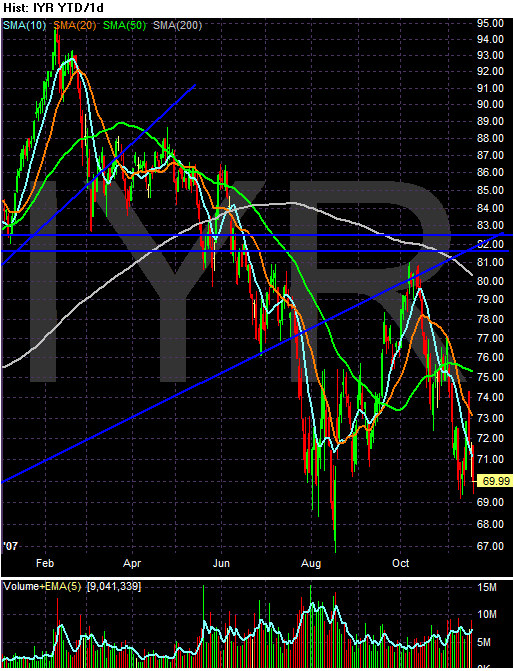
After breaking the 5-year uptrend, the ETF rallied to the previous trend line and has since traded down. Also note the index is below the 200 day SMA. Prices and the SMAs are a bit jumbled right now, indicating a lack of clear direction. Finally, this ETF may have formed a double bottom, with the first being in August and the second occurring over the last few weeks.
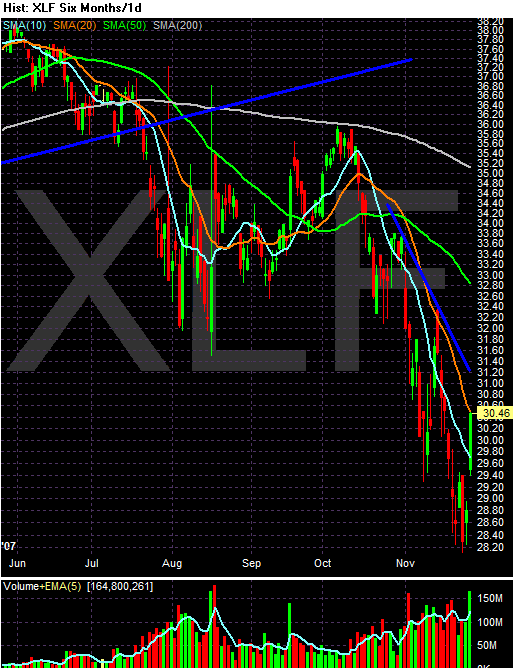
The Financial sector is in a bear market. The index is below the 200 day SMA. The shorter SMAs are below the longer SMAs. All the SMAs are headed lower. While prices have rebounded recently, it's doubtful this trend will continue. The sector is continually announcing writedowns at this point.
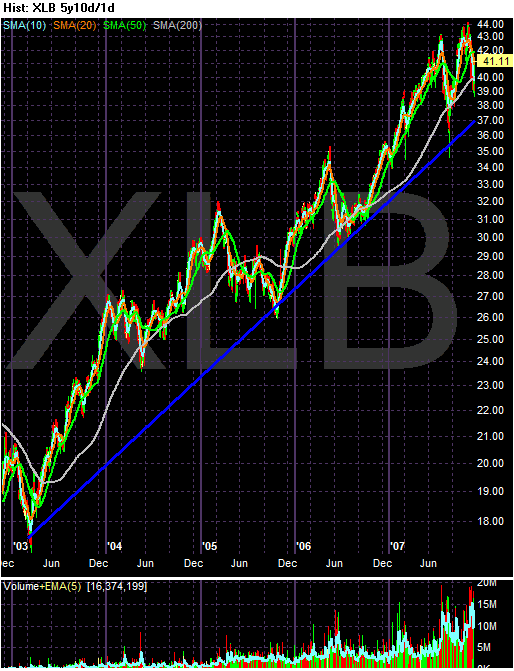
The basic materials ETF is still in the middle of a 5 year rally. However, it may have recently formed a double top.
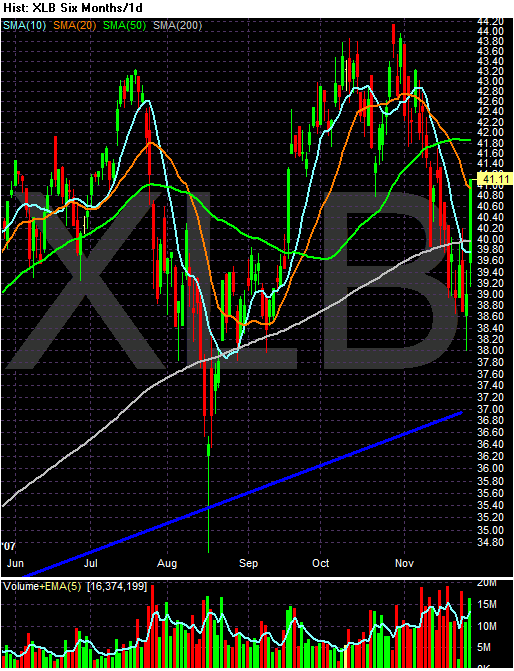
On the 6-month chart, notice prices rebounded through the 200 day SMA yesterday. While the index formed a shorter duration double top in October, yesterday's rally may have helped to kick this sector back into bullish territory.
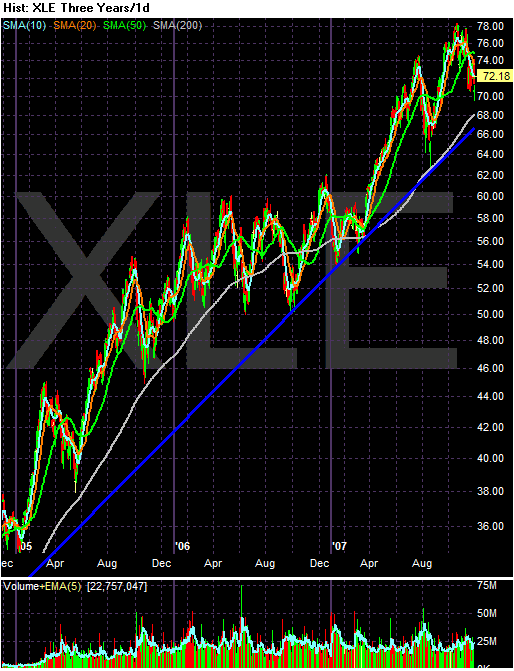
The energy sector is still in a bull market.
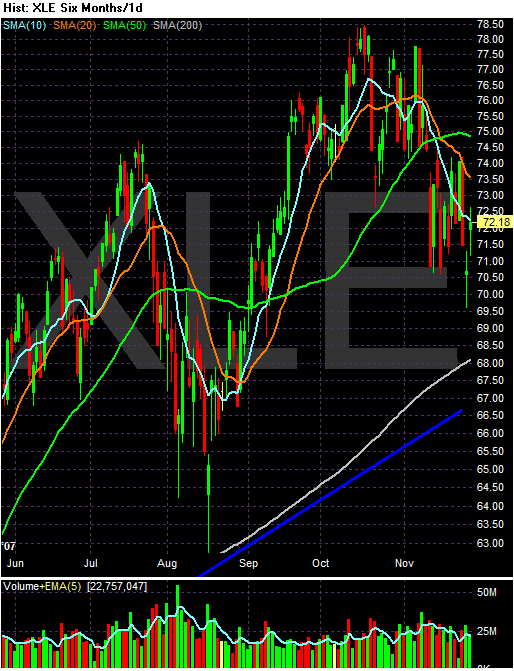
On 6 month chart, we have prices pulling back from a mid-October high. However, the pullback is very orderly; the chart doesn't have a lot of wild price swings. While the shorter SMAs are headed lower, the shorter SMAs in general are bunched in a tight range. Also note that prices have formed a trading range for about the last week while the market has been a but more haywire. Finally, prices are still above the 200 day SMA, indicating we're in a bull market. Until we see more volatile action or serious price drops, this chart looks to be in the middle of a standard bull market sell-off.
Reports on retail spending were downbeat in general, with several significant exceptions. Most Districts characterized sales as weak or indicated that they had softened, with a few reporting that the volume of sales had fallen relative to the preceding survey period or a year earlier. However, the Boston, Philadelphia, Minneapolis, and Kansas City Districts highlighted a pickup in retail sales relative to the preceding survey period. Among product categories, several Districts noted continued solid growth in sales of consumer electronics, while a few also noted that demand for luxury goods continued to rise at a healthy pace. By contrast, sales of automobiles and light trucks were flat to down, with contacts from several Districts expecting declines going forward.

The retail ETF is clearly in a bearish posture. Prices are below the 200 day SMA by 9.3%. All of the shorter SMAs are moving lower, the shorter SMAs are below the longer SMAs and prices are below all the SMAs. This is a chart that says "sell me."

The electronic stores sector is at least above the 200 day SMA. But it has been in a trading range for the better part of a year. Also notice the shorter SMAs are bunched-up indicating a lack of direction.

While the auto dealership sector is still above the 200 day SMA, it broke a three year uptrend on heavy volume earlier this year. That indicates this sector is in the middle of a trend reversal.
Reports on nonfinancial services generally were consistent with expanding economic activity, with the primary exception of transportation services. Several Districts pointed to continued strong demand growth for health-care services, while the Richmond, St. Louis, and Minneapolis Districts noted an ongoing expansion for providers of legal and other professional services. The Dallas District reported steady demand for legal services but noted a shift toward litigation related to bankruptcy filings, which may signal a slowing economy. In the San Francisco District, demand for advertising services was held down by weak demand from sellers of automobiles and home furnishings. Providers of temporary staffing services saw strong demand in the Richmond District as well as a pickup from the legal and financial industries in New York City, but demand for temp workers was reported as "sluggish" overall by Dallas.

The transports are in a bear market. Prices are below the 200 day SMA. The shorter SMAs are below the longer SMAs and all the shorter SMAs are heading lower. While this index experienced a bounce yesterday, we have a long way to go before we can confirm this is a trend reversal.

Ad agencies broke a three year uptrend recently, although they are still about the 200 day SMA.

Management services formed a double top and are currently trading at important support levels. However, this sector is still in bull market territory.

Staffing agencies have
1.) Broken a 5-year uptrend,
2.) Broken through the 200 day SMA
3.) And are trading at a technically important level. If they fall further they have a ways to go before they find additional technical support.
Manufacturing activity was mixed across subsectors but appeared to be largely stable on balance. Demand remained weak or fell further for machinery and manufactured materials related to home construction, such as lumber and concrete, and automakers have scaled back their production activities this year. By contrast, demand rose solidly for various other types of capital goods, such as non-automotive transportation equipment, information technology products, and machinery used in the agriculture, energy extraction, and mining industries. Chicago reported that steel production increased, in part because of reduced import competition of late, but Cleveland characterized steel shipping volumes as "flat" in that District. Among nondurable products, several Districts noted continued robust demand for food and significant gains for paper and plastics. However, Dallas reported "stable" demand for food and a drop in sales of corrugated boxes, and St. Louis noted that food manufacturers plan to lay off workers in that District. The reports generally indicated that increases in demand were especially strong for products and firms with significant export markets, for which sales have been boosted in part by the lower exchange value of the U.S. dollar.

Manufacturing is still in a strong uptrend. However, it may have formed a double top over the last few months.

Materials and Construction formed a head and shoulders formation over 2007 and recently broke through a 5 year trend line.
Demand for residential real estate remained quite depressed, with only a few tentative and scattered signs of stabilization amidst the ongoing slowdown. Most Districts pointed to further increases in the inventory of available homes, with the earlier tightening of credit conditions for mortgage lending continuing to create barriers for some buyers. Consequently, prices on new and existing homes sold were reported to be down on a short-term or year-earlier basis in most Districts. The pace of homebuilding remained very low in general, and builders continued to shelve projects and lay off workers in many areas; contacts generally do not expect a significant pickup in homebuilding until well into next year at the earliest. Among scattered positive signs, however, co-op and condo sales in New York City picked up during the survey period, Richmond reported favorable readings on home sales in a few areas, and Kansas City reported that home inventories fell a bit in the Denver metro area. Weak home demand had mixed effects on conditions in rental markets: Chicago reported that builders' conversions of new homes to rental property put downward pressure on rents, while Dallas noted that demand for apartments picked up, in part because some potential homebuyers are unable to qualify for mortgages.

The homebuilders ETF is in a bearish chart. Prices are below the 200 day SMA; shorter SMAs are below longer SMAs; all the SMAs are moving lower and prices are below all the SMAs. It does not get more bearish than this.

The real estate ETF broke a 5 year uptrend earlier this year.

After breaking the 5-year uptrend, the ETF rallied to the previous trend line and has since traded down. Also note the index is below the 200 day SMA. Prices and the SMAs are a bit jumbled right now, indicating a lack of clear direction. Finally, this ETF may have formed a double bottom, with the first being in August and the second occurring over the last few weeks.
Lending to businesses generally was at high levels, but the reports suggested a slower rate of growth than in previous survey periods. Commercial and industrial lending activity changed little or declined in the Cleveland, Atlanta, St. Louis, Kansas City, and San Francisco Districts, although it increased noticeably in the Philadelphia District and continued to show modest growth according to Chicago. Lending standards for construction projects and commercial real estate transactions tightened further in the New York and St. Louis Districts, and they remained tight more generally and reportedly held down the volume of lending for these categories in the Boston District. The reports indicated slight increases in delinquencies on commercial and industrial loans and slightly larger increases for commercial mortgages in many areas.

The Financial sector is in a bear market. The index is below the 200 day SMA. The shorter SMAs are below the longer SMAs. All the SMAs are headed lower. While prices have rebounded recently, it's doubtful this trend will continue. The sector is continually announcing writedowns at this point.
Reports on the natural-resources sector indicated further growth from very high levels of activity. High oil prices have stimulated expanded drilling in the Atlanta and Dallas Districts; Minneapolis reported increased activity in the energy and mining sectors since the last report; and Kansas City reported that "energy activity remained robust." However, Cleveland reported a slight decline in production of natural gas.

The basic materials ETF is still in the middle of a 5 year rally. However, it may have recently formed a double top.

On the 6-month chart, notice prices rebounded through the 200 day SMA yesterday. While the index formed a shorter duration double top in October, yesterday's rally may have helped to kick this sector back into bullish territory.

The energy sector is still in a bull market.

On 6 month chart, we have prices pulling back from a mid-October high. However, the pullback is very orderly; the chart doesn't have a lot of wild price swings. While the shorter SMAs are headed lower, the shorter SMAs in general are bunched in a tight range. Also note that prices have formed a trading range for about the last week while the market has been a but more haywire. Finally, prices are still above the 200 day SMA, indicating we're in a bull market. Until we see more volatile action or serious price drops, this chart looks to be in the middle of a standard bull market sell-off.
Today's Markets
Yesterday I wrote the following:
I have to admit, I was not expecting a day like today by any stretch of the imagination. Here are the 1 day charts:
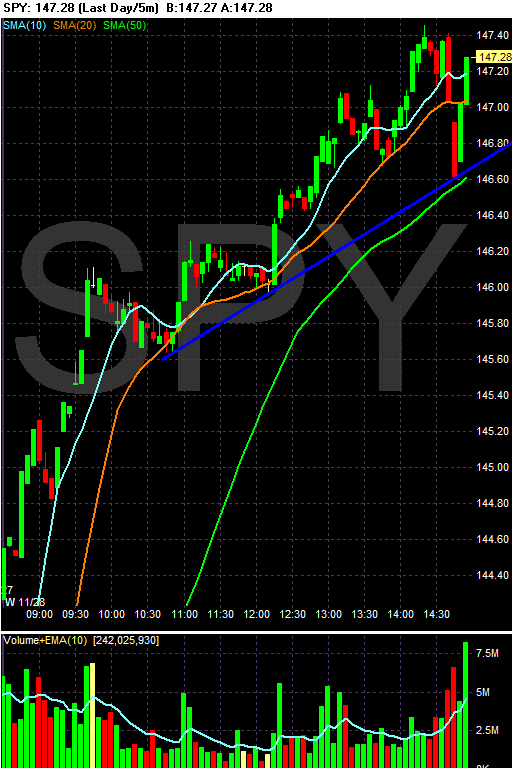
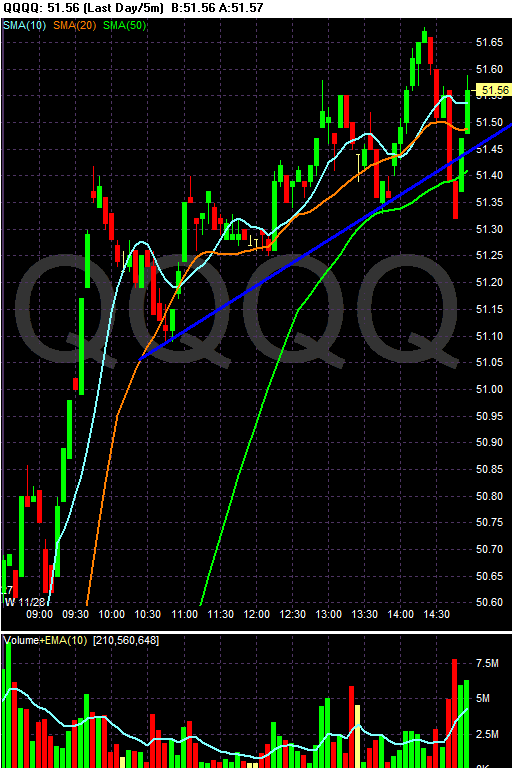
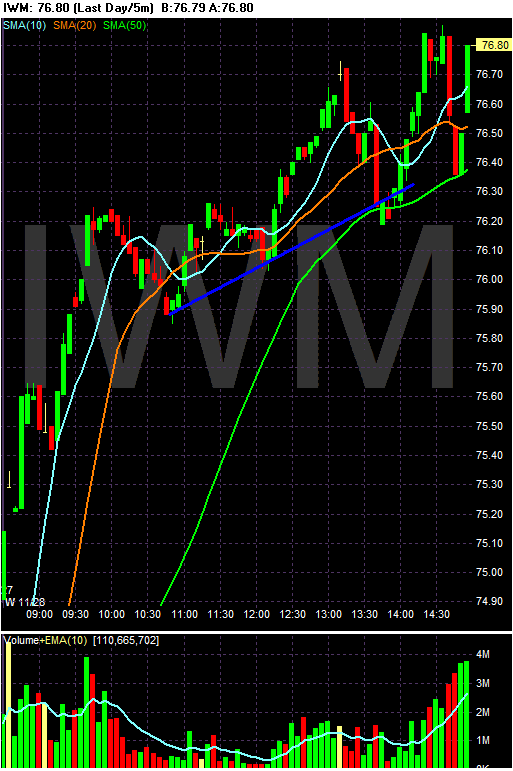
All the indexes gapped up at the open and then continued to run for the rest of the day. What was impressive about today was we didn't have an end of the day sell-off. In fact, if you look at the last 5 bars of each chart above, you'll notice there was a heavy sell-off followed by a big rally. That tells us traders are willing to carry positions overnight which is a good sign.
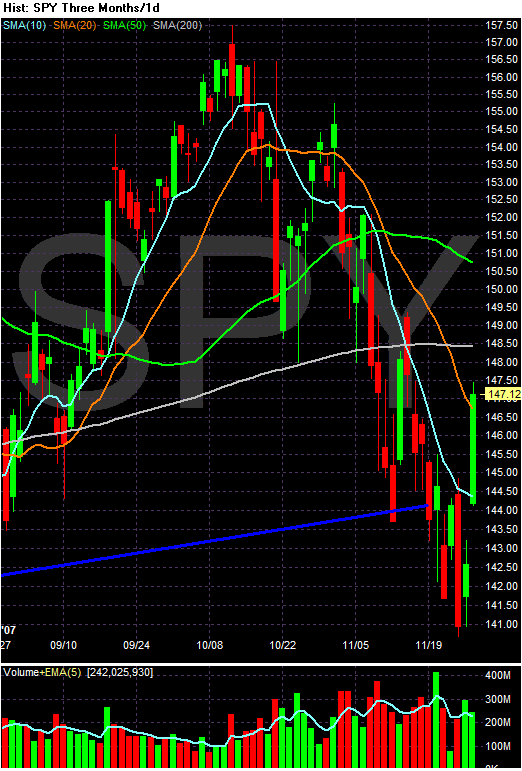
On the daily SPY chart, notice how the index went through the 10 and 20 day SMA in one day. Also note that volume is pretty good. While the index is still below the 200 day SMA, today's move was a big help technically.
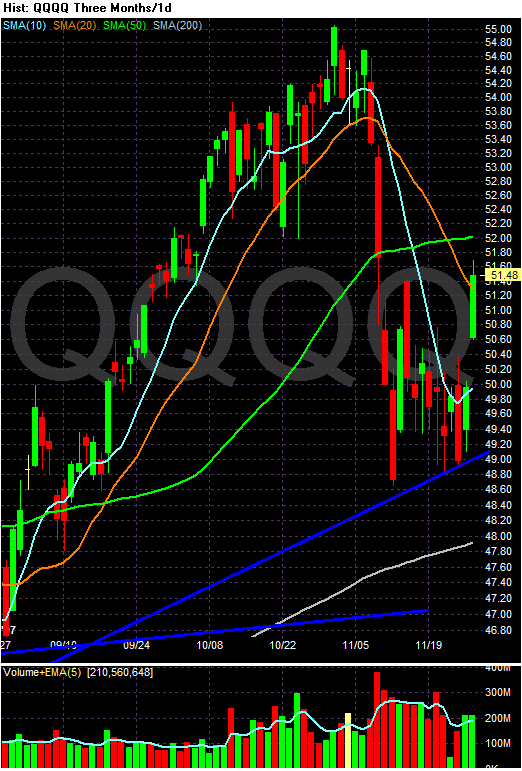
For the last few days I've been harping on the QQQQ's consolidation pattern. Well, now we know what direction the market is going to move in, don't we? Notice how today's action moved the index through the 20 day SMA -- a good technical development. But, this index is still trading above the 200 day SMA.
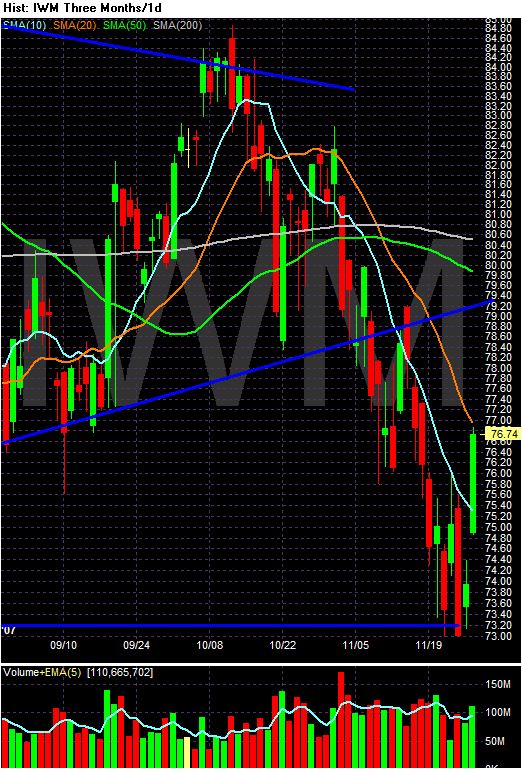
The Russell 2000 moved through the 20 day SMA as well.
I should add an important caveat. The primary reason for today's move was a statement from a Fed governor that implied the Fed may lower rates at its next meeting. This was the primary reason for the move up. There was also a ton a bad news today. Existing home sales dropped again. Durable Goods orders dropped -- again. And the Fed's Beige Book does not paint a very good picture of the economy.
In other words, there isn't a lot of reason to expect this to continue for a long time. The overall market tone is still negative in my opinion.
There is still a ton of bad news out there. Today's home price release is just one of the many problems we are seeing which is driving the market lower. But no market moves down forever. The daily charts all show some type of reversal formation, short-term technical indicators are oversold and the SPYs and IWMs have been moving down for some time. All of these factors indicates a reversal might be in the cards.
Now, I'm not saying we're going to have a rebound with 100% certainty. Chart reading is not an exact science by any stretch of the imagination. And the market will do its best to make an ass out of you at all times -- and the market has plenty of resources to do that.
I have to admit, I was not expecting a day like today by any stretch of the imagination. Here are the 1 day charts:


All the indexes gapped up at the open and then continued to run for the rest of the day. What was impressive about today was we didn't have an end of the day sell-off. In fact, if you look at the last 5 bars of each chart above, you'll notice there was a heavy sell-off followed by a big rally. That tells us traders are willing to carry positions overnight which is a good sign.

On the daily SPY chart, notice how the index went through the 10 and 20 day SMA in one day. Also note that volume is pretty good. While the index is still below the 200 day SMA, today's move was a big help technically.

For the last few days I've been harping on the QQQQ's consolidation pattern. Well, now we know what direction the market is going to move in, don't we? Notice how today's action moved the index through the 20 day SMA -- a good technical development. But, this index is still trading above the 200 day SMA.

The Russell 2000 moved through the 20 day SMA as well.
I should add an important caveat. The primary reason for today's move was a statement from a Fed governor that implied the Fed may lower rates at its next meeting. This was the primary reason for the move up. There was also a ton a bad news today. Existing home sales dropped again. Durable Goods orders dropped -- again. And the Fed's Beige Book does not paint a very good picture of the economy.
In other words, there isn't a lot of reason to expect this to continue for a long time. The overall market tone is still negative in my opinion.
Existing Home Sales Drop
From Bloomberg:
There are only two numbers that are important in this report: inventory and months of supply.
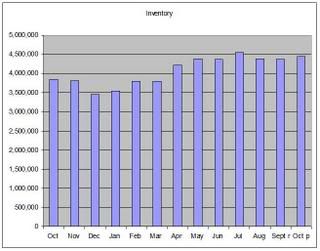
Inventory is still sky high.
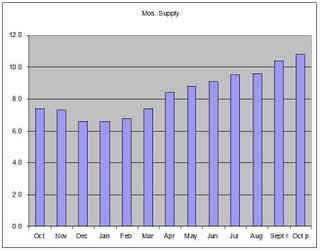
And months of inventory available is still increasing.
And this isn't including any of the projected foreclosures for next year.
Simply put, this is called a "super-glut".
Purchases of existing homes dropped 1.2 percent to an annual rate of 4.97 million, the fewest since the National Association of Realtors began keeping the records in 1999. Orders for items made to last several years fell 0.4 percent, the Commerce Department said today in Washington.
There are only two numbers that are important in this report: inventory and months of supply.

Inventory is still sky high.

And months of inventory available is still increasing.
And this isn't including any of the projected foreclosures for next year.
Simply put, this is called a "super-glut".
Durable Goods Orders Decrease
From the Census Bureau:
A three month decrease equals a trend -- and not a good one.
Here is a chart from Econoday which puts this in better perspective:
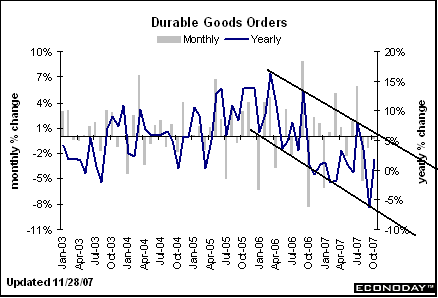
First, notice the gray lines; these are monthly changes. Starting in late last year (roughly October 2006), we started seeing greater vacillations in the monthly numbers. Also notice there are more negative months and the positive months aren't that large. While there are a few spikes here and there, the general trend is down.
Also notice the yearly numbers, which are in the form of a line. I have added a trend line to indicate the year-over-year change is clearly down and has been for the better part of a year.
New orders for manufactured durable goods in October decreased $0.9 billion or 0.4 percent to $214.5 billion, the U.S. Census Bureau announced today. This was the third consecutive monthly decrease and followed a 1.4 percent September decrease. Excluding transportation, new orders decreased 0.7 percent. Excluding defense, new orders decreased 0.9 percent.
A three month decrease equals a trend -- and not a good one.
Here is a chart from Econoday which puts this in better perspective:

First, notice the gray lines; these are monthly changes. Starting in late last year (roughly October 2006), we started seeing greater vacillations in the monthly numbers. Also notice there are more negative months and the positive months aren't that large. While there are a few spikes here and there, the general trend is down.
Also notice the yearly numbers, which are in the form of a line. I have added a trend line to indicate the year-over-year change is clearly down and has been for the better part of a year.
How Strong is the Labor Market Really?
From Barron's:
Models and statistics aren't my strong suit, so I have to rely on what other people are saying about the BLS' model. However, there has been a consistent refrain about the recent employment numbers and that is the birth/death model is distorting the picture.
For those of you who are unfamiliar with this BLS model, here's the basic deal (and for those of you who have a much better grasp of actual situation add it to the comments or email me at bonddad at prodigy dot net). The method the BLS uses to determine how many jobs are created every month does not include new businesses or businesses that have recently gone out of business. To compensate for this problem, the BLS has created a "birth /death" model that attempts to compensate for this problem.
The problem with the "birth/death" model adjustments is the adjustments are more and more responsible for the total number of jobs reported over the last year. In other words, the model and not the economy is creating jobs. I've also read the BLS' reported numbers are seasonally adjusted while the birth/death model isn't which makes comparisons difficult.
For a more detailed assessment of how this hit the latest report, see this article from Mish: Here is a great observation from the article:
The bottom line is there appears to be some serious problems with the official numbers that we are seeing. As to the degree and depth of those problems, I will leave that to far more statistically oriented minds.
Charles Biderman, the proprietor of TrimTabs Investment Research, asserts the latest Labor Department numbers showing continued growth in payrolls is wildly overblown. That's without getting into the contentious argument over the Bureau of Labor Statistics' birth-death assumptions, which magically conjure phantom jobs.
Biderman, a Barron's alum who toiled for the magazine in the 1970s, tracks real-time data about the stock market and economy, including employment. Biderman's modest proposal -- follow real-time, real-world data, such as withholding and self-employment taxes, and ask payers of those taxes how many workers they employ. He also tracks employment indicators such as online help-wanted ads, and not just those on commercial sites.
This gives a better picture of the labor market because increasing numbers of people aren't on payrolls. It isn't just the eBay entrepreneurs touted by Dick Cheney. Lots of professionals have been laid off by corporations and then work for their old employers as "consultants," Charles observes. But, being hidebound bureaucrats and academics, the BLS resists utilizing these data.
In any case, nobody fudges their taxes to inflate the numbers. And based on those numbers, while the consensus was looking for a slowdown for the past couple of years, Biderman's real-world data showed the U.S. economy was cooking. That is, until a couple of months ago.
For instance, the official tally showed a 130,000 gain for nonfarm payrolls for October. By Biderman's reckoning, payrolls actually were down 30,000 for the month, which would jibe with the 250,000 decline in last month's household survey.
To be sure, the household numbers bounce around from month to month. But over the past three months, household employment has declined by 34,000 a month. Over the past 12 months, this measure has grown a paltry 56,000 a month, or about half what's needed to absorb new entrants into the labor force.
Part of the discrepancy between the BLS payroll numbers and reality is because a huge number of people in real-estate-related businesses are independent contractors. That includes construction workers, realtors, mortgage brokers, home inspectors and assessors, among others. They're not on an employer's payroll, so they don't get counted in that tally. Nor are they eligible for unemployment insurance, so they also don't get counted in the jobless claims data.
Models and statistics aren't my strong suit, so I have to rely on what other people are saying about the BLS' model. However, there has been a consistent refrain about the recent employment numbers and that is the birth/death model is distorting the picture.
For those of you who are unfamiliar with this BLS model, here's the basic deal (and for those of you who have a much better grasp of actual situation add it to the comments or email me at bonddad at prodigy dot net). The method the BLS uses to determine how many jobs are created every month does not include new businesses or businesses that have recently gone out of business. To compensate for this problem, the BLS has created a "birth /death" model that attempts to compensate for this problem.
The problem with the "birth/death" model adjustments is the adjustments are more and more responsible for the total number of jobs reported over the last year. In other words, the model and not the economy is creating jobs. I've also read the BLS' reported numbers are seasonally adjusted while the birth/death model isn't which makes comparisons difficult.
For a more detailed assessment of how this hit the latest report, see this article from Mish: Here is a great observation from the article:
The BLS has shown a net gain of jobs added to new businesses in both construction and financial activities nine consecutive months from February through October.
The BLS is assuming not only that jobs were added, but that new unaccounted construction businesses were created in this environment where business capex spending has been weak, housing has been horrid, and over 170 lenders have gone out of business or stopped writing loans since last December as per the Mortgage Lender Implode-O-Meter.
Clearly this is reporting from an alternate universe.
A note of caution: One cannot take the birth death adjustments and subtract them from the reported numbers because one set of numbers is seasonally adjusted and the other is not.
The bottom line is there appears to be some serious problems with the official numbers that we are seeing. As to the degree and depth of those problems, I will leave that to far more statistically oriented minds.
Implode-O-Meter Nearing 200
According to the Implode-O-Meter almost 200 lenders have "imploded".
Offered without any further comment.
Hat Tip to Minyanville
Offered without any further comment.
Hat Tip to Minyanville
Is Oil Headed Lower?
From the WSJ:
Let's review just a bit. One of the main drivers of oil prices over the last few months was the situation on the Turkey/Iraq border. That really spooked the markets. If Turkey invades northern Iraq part of the Iraqi pipeline system will be endangered. I haven't seen anything on this situation for awhile.
However, there is also the issue of decreasing US stockpiles. Here is the chart of US stockpiles from This Week in Petroleum:
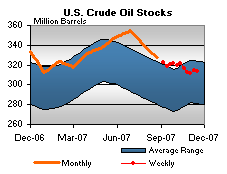
Notice US stockpiles have been decreasing since the summer. Econ 101: decreasing supply = increasing price.
So we have a few solid reasons for oil's increase -- geopolitical risk and supplies.
However, no index moves up indefinitely. And an increase in OPEC supplies may be enough to send oil prices lower -- at least for now. Time that with the end of the year and the fact that traders may be looking to take at least some of their profits and we have the possibility for a market reversal.
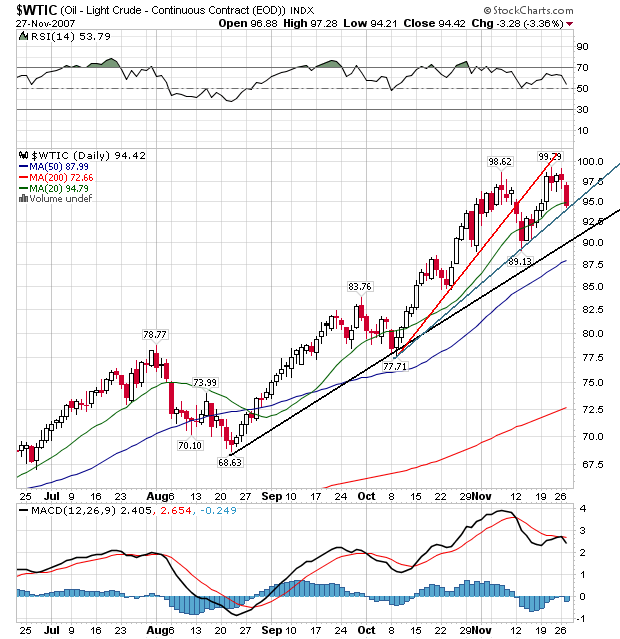
Above is a chart of oil. Notice the following.
On the Bullish Side:
1.) The primary uptrend which started in mid-August is still intact. Prices would have to move through the lower 90s to break this trend.
2.) The simple moving average (SMA) picture is still very bullish. Prices are above the 200 day SMA. The shorter SMAs are above the longer SMAs.
3.) Yesterday prices broke the 20 day SMA, but they did this before a few weeks ago.
However,
4.) There is a minor uptrend (with the red line) that started in early October. Oil already broke this trend. This support line became resistance during the latest price moves.
5.) There is a second minor uptrend in place (in green) that oil is getting ready to break.
6.) Oil may have formed a double top in November.
One of the main issues I see with this chart is the double top. That is a classic reversal formation and whenever I see it I think "reversal".
However, we're talking about oil which is an incredibly fickle and difficult market to trade. So beware.
U.S. benchmark crude dropped sharply yesterday, falling $3.28 a barrel, or 3.4%, to $94.42 in futures trading on the New York Mercantile Exchange. But analysts stopped short of calling the shift a correction. The market remains unusually volatile and could easily shoot upward again -- even breaking the $100 mark -- if the Organization of Petroleum Exporting Countries doesn't follow through on talk of a production increase or if Western stockpiles dip unexpectedly. Oil prices hit an intraday record of $99.29 a barrel last week. Oil reached its inflation-adjusted high of $102 a barrel in April 1980.
.....
Topping the list is the sluggish U.S. economy, which some economists say is heading toward a recession as the meltdown of the U.S. subprime-mortgage market crimps lending. That would damp oil demand in the U.S., the world's largest oil consumer. It could also prompt a slowdown in other economies, including in China, now the fastest-growing consumer of oil.
Signs have also emerged of increased crude supplies from the Middle East as OPEC lives up to an agreement in September to raise output by 500,000 barrels a day as of the beginning of this month.
A big factor driving down prices yesterday was mounting expectations that OPEC ministers will move to increase output by an additional 500,000 barrels a day when the group meets in the United Arab Emirates next week. The oil cartel satisfies about 40% of world demand, which hovers around 85 million barrels a day.
Let's review just a bit. One of the main drivers of oil prices over the last few months was the situation on the Turkey/Iraq border. That really spooked the markets. If Turkey invades northern Iraq part of the Iraqi pipeline system will be endangered. I haven't seen anything on this situation for awhile.
However, there is also the issue of decreasing US stockpiles. Here is the chart of US stockpiles from This Week in Petroleum:

Notice US stockpiles have been decreasing since the summer. Econ 101: decreasing supply = increasing price.
So we have a few solid reasons for oil's increase -- geopolitical risk and supplies.
However, no index moves up indefinitely. And an increase in OPEC supplies may be enough to send oil prices lower -- at least for now. Time that with the end of the year and the fact that traders may be looking to take at least some of their profits and we have the possibility for a market reversal.

Above is a chart of oil. Notice the following.
On the Bullish Side:
1.) The primary uptrend which started in mid-August is still intact. Prices would have to move through the lower 90s to break this trend.
2.) The simple moving average (SMA) picture is still very bullish. Prices are above the 200 day SMA. The shorter SMAs are above the longer SMAs.
3.) Yesterday prices broke the 20 day SMA, but they did this before a few weeks ago.
However,
4.) There is a minor uptrend (with the red line) that started in early October. Oil already broke this trend. This support line became resistance during the latest price moves.
5.) There is a second minor uptrend in place (in green) that oil is getting ready to break.
6.) Oil may have formed a double top in November.
One of the main issues I see with this chart is the double top. That is a classic reversal formation and whenever I see it I think "reversal".
However, we're talking about oil which is an incredibly fickle and difficult market to trade. So beware.
Tuesday, November 27, 2007
Today's Markets
I'm going to do this a bit backwards today. First, here is a chart of the daily SPYs.
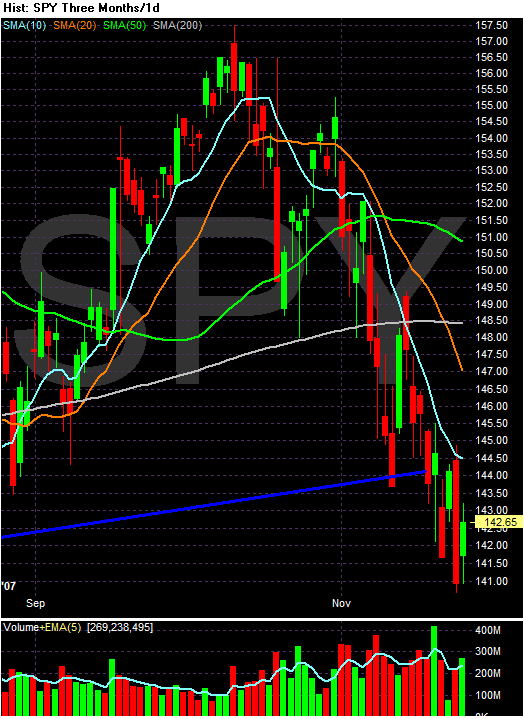
Notice the ETF has been dropping for awhile. No market moves in one direction. Also consider that short-term trading indicators like stochastics and William's percentage numbers are very oversold right now. In other words, a rebound would not be unheard of under these conditions.
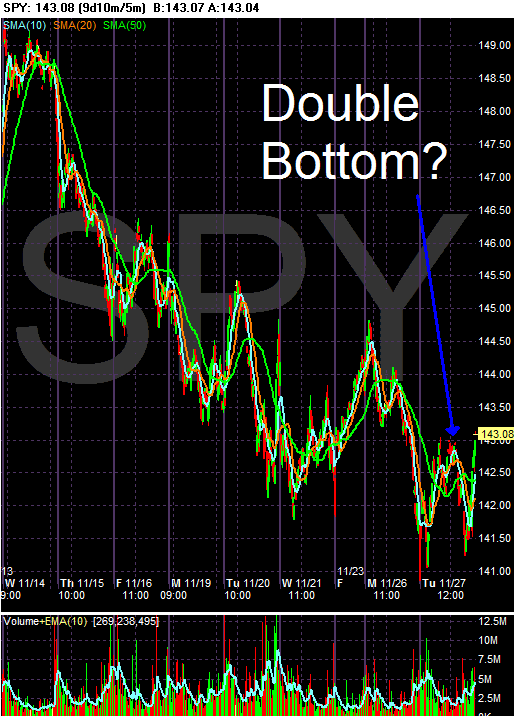
On the 5-minute chart, the index may have formed a double bottom.
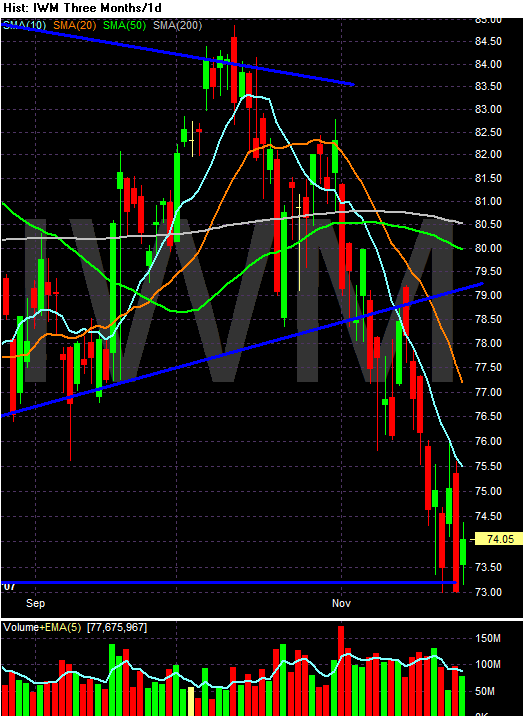
The daily IWM (Russell 2000) also shows a consistent downtrend like the SPYs.
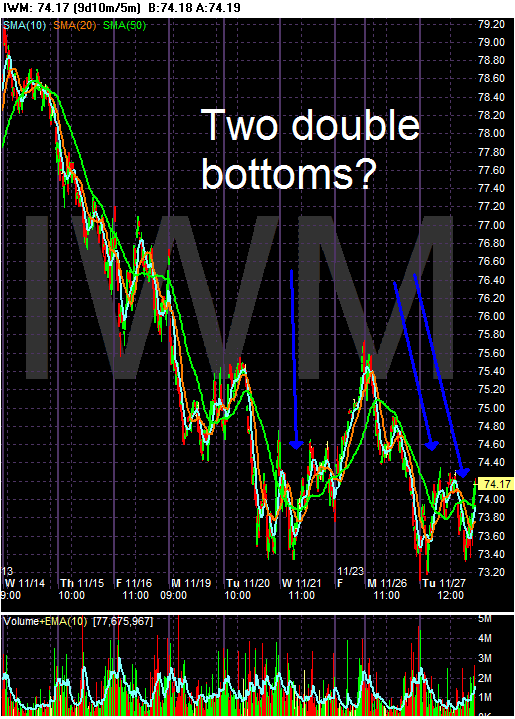
And on the 5-minute chart we have the possibility of two double bottoms. The first occurred today like the SPYs. The second would be the period of late Tuesday/Wednesday of last week and today.
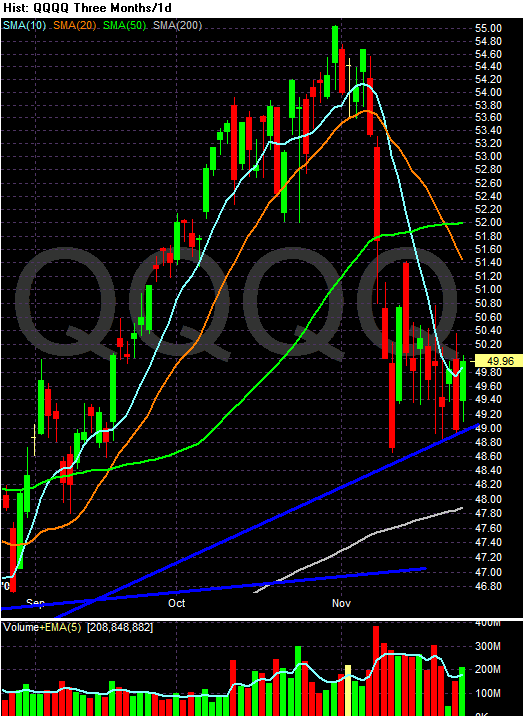
On the daily QQQQ chart we have a clear consolidation pattern. The consolidation occurred after a hard move down.
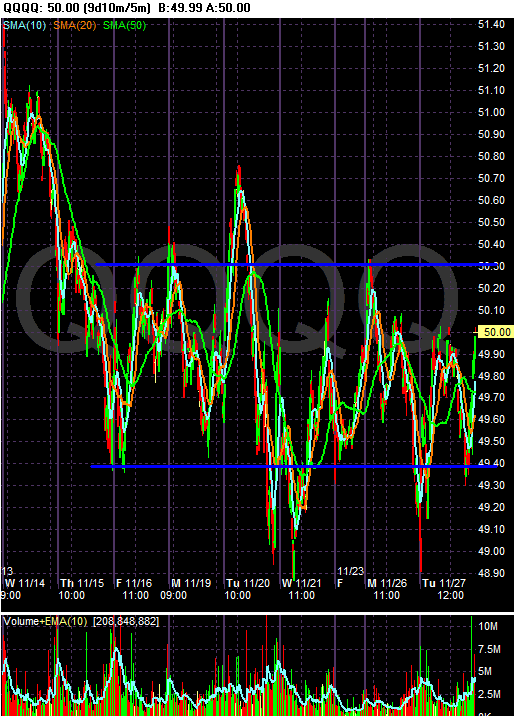
The 5-minute chart illustrates this consolidation clearly.
There is still a ton of bad news out there. Today's home price release is just one of the many problems we are seeing which is driving the market lower. But no market moves down forever. The daily charts all show some type of reversal formation, short-term technical indicators are oversold and the SPYs and IWMs have been moving down for some time. All of these factors indicates a reversal might be in the cards.
Now, I'm not saying we're going to have a rebound with 100% certainty. Chart reading is not an exact science by any stretch of the imagination. And the market will do its best to make an ass out of you at all times -- and the market has plenty of resources to do that.

Notice the ETF has been dropping for awhile. No market moves in one direction. Also consider that short-term trading indicators like stochastics and William's percentage numbers are very oversold right now. In other words, a rebound would not be unheard of under these conditions.

On the 5-minute chart, the index may have formed a double bottom.

The daily IWM (Russell 2000) also shows a consistent downtrend like the SPYs.

And on the 5-minute chart we have the possibility of two double bottoms. The first occurred today like the SPYs. The second would be the period of late Tuesday/Wednesday of last week and today.

On the daily QQQQ chart we have a clear consolidation pattern. The consolidation occurred after a hard move down.

The 5-minute chart illustrates this consolidation clearly.
There is still a ton of bad news out there. Today's home price release is just one of the many problems we are seeing which is driving the market lower. But no market moves down forever. The daily charts all show some type of reversal formation, short-term technical indicators are oversold and the SPYs and IWMs have been moving down for some time. All of these factors indicates a reversal might be in the cards.
Now, I'm not saying we're going to have a rebound with 100% certainty. Chart reading is not an exact science by any stretch of the imagination. And the market will do its best to make an ass out of you at all times -- and the market has plenty of resources to do that.
Country Wide Offers Comic Relief
From CNBC:
At least the company is consistent.
Let's look at the basic facts.
1.) The company has borrowed $51 billion over the course of the year.
2.) The two companies that provide a ton of liquidity to the mortgage market -- Freddie Mac and Fannie Mae -- are in a world of hurt.
3.) Home prices are dropping like stones according to the latest Case-Schiller news release.
4.) The housing market has more supply than it knows what to do with.
5.) Credit conditions are tightening.
But everything is alright for Countrywide -- they have no problems.
Why am I having a really hard time believing that?
Countrywide Financial, the largest U.S. mortgage lender, moved to reassure investors Tuesday that it is not borrowing too much and will not be constrained in its ability to provide home loans.
"We said it back in August, we said it in September, we said it last week, we'll say it until we turn blue in the face, but we have ample liquidity to fund our growth and operational needs," David Bigelow, managing director of investor relations, said at an FBR Capital Markets conference in New York.
.....
Bigelow rejected criticism that Countrywide has threatened the soundness of the Federal Home Loan Bank system by borrowing excessively. He also said Countrywide does not expect issues affecting Freddie Mac and Fannie Mae to materially hurt its ability to make home loans.
.....
Sen. Charles Schumer, a New York Democrat and member of the Senate Banking Committee, accused Countrywide Monday of treating the FHLB system "like its personal ATM," having borrowed $51.1 billion as of Sept 30.
At least the company is consistent.
Let's look at the basic facts.
1.) The company has borrowed $51 billion over the course of the year.
2.) The two companies that provide a ton of liquidity to the mortgage market -- Freddie Mac and Fannie Mae -- are in a world of hurt.
3.) Home prices are dropping like stones according to the latest Case-Schiller news release.
4.) The housing market has more supply than it knows what to do with.
5.) Credit conditions are tightening.
But everything is alright for Countrywide -- they have no problems.
Why am I having a really hard time believing that?
A Look At the Homebuilders ETF
So long as we're talking about housing news, lets look at the homebuilders ETF, XHB:
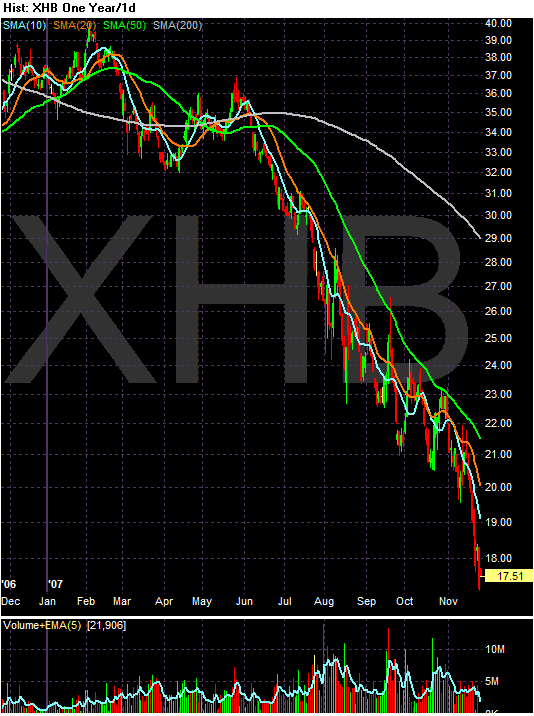
Notice the following.
1.) The index is below the 200 day simple moving average (SMA). In fact, prices are nearly 40% below the 200 day SMA.
2.) The SMAs are aligned very bearishly: the shorter SMAs are below the longer SMAs. This means further declines are in the cards.
3.) Prices are below the SMAs, which will pull the SMAs lower as well.
4.) The index has dropped 55.89% since its high around 40 earlier this year.
5.) There is a strong downtrend in place that has been in place since the end of May.
This is a great example of a bearish chart.
Housing Is Nowhere Near the Bottom, pt. II
Just when you thought it wasn't going to get any worse:
As I pointed out two posts below, inventory is already at sky high levels, foreclosures are at highs which will add to an already sky-high inventory, we have a ton of resets to go through still:

Lending standards are tightening and consumers aren't feeling that good about things as a whole.
There is no news in here that is good. None. Zip. Nada.
NEW YORK (Reuters) - Prices of existing U.S. single-family homes slumped 4.5 percent in the third quarter from a year earlier, matching a record decline from the previous period as the housing downturn deepened, according to a national home price index on Tuesday.
The S&P/Case-Shiller National Home Price Index fell 1.7 percent since June, marking the largest quarterly decline in the index's 21-year history, S&P said in a statement.
The composite month-over-month index of 20 metropolitan areas fell 0.9 percent to 195.62 in September from August, bringing the measure down 4.9 percent from a year earlier.
As I pointed out two posts below, inventory is already at sky high levels, foreclosures are at highs which will add to an already sky-high inventory, we have a ton of resets to go through still:

Lending standards are tightening and consumers aren't feeling that good about things as a whole.
There is no news in here that is good. None. Zip. Nada.