Saturday, August 18, 2007

Multiple Views Of The SPYs

Because of all the market turmoil over the last month or so and this being the weekend, this is going to be a longer post looking at the SPYs from a variety of perspectives. Before delving into this "chartfest", I want to add this caveat. Technical analysis is not an exact science. It's more of an art. The first generation of analysts (Schabacker, Gann and Gartley) all added an important caveat to their analysis: the markets will make an ass out of you whenever possible. What we're really doing here is trying to increase the percentages of a winning trade. That does not mean we will be right; we're simply trying to increase our odds.

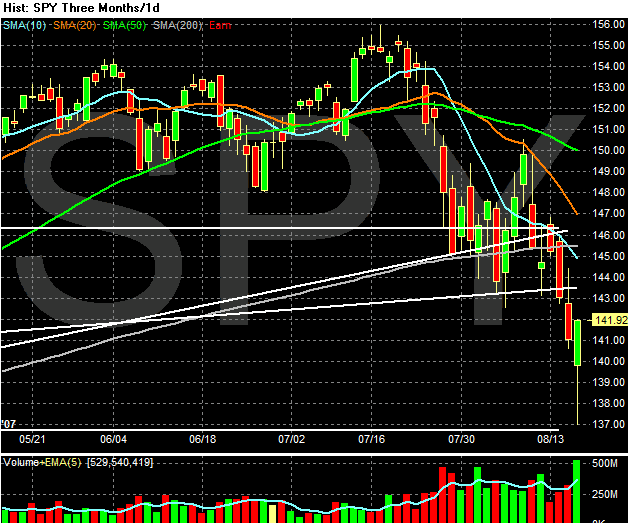
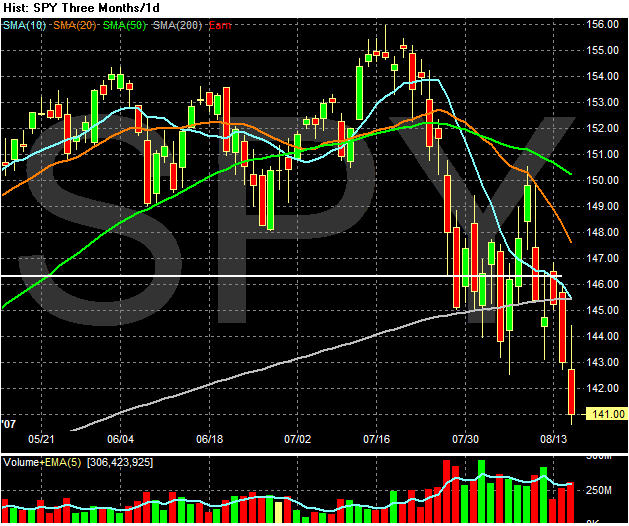
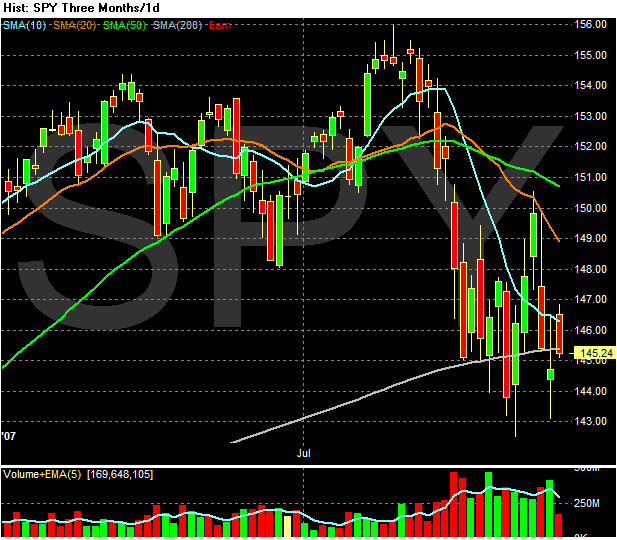
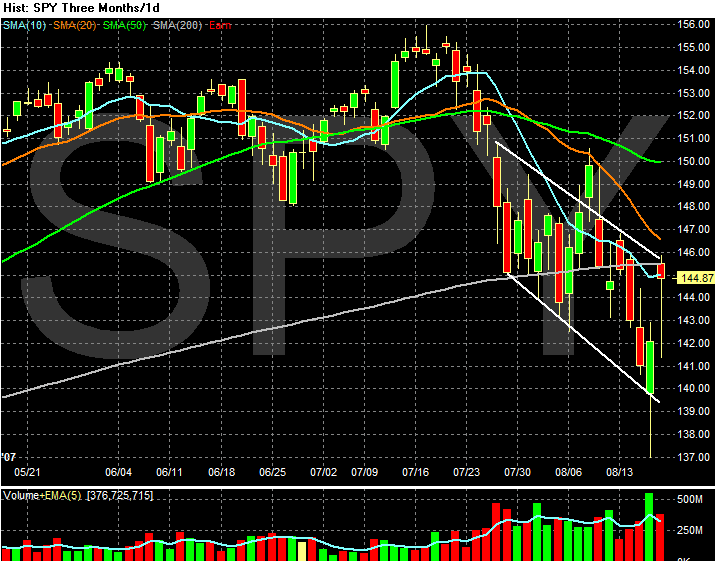
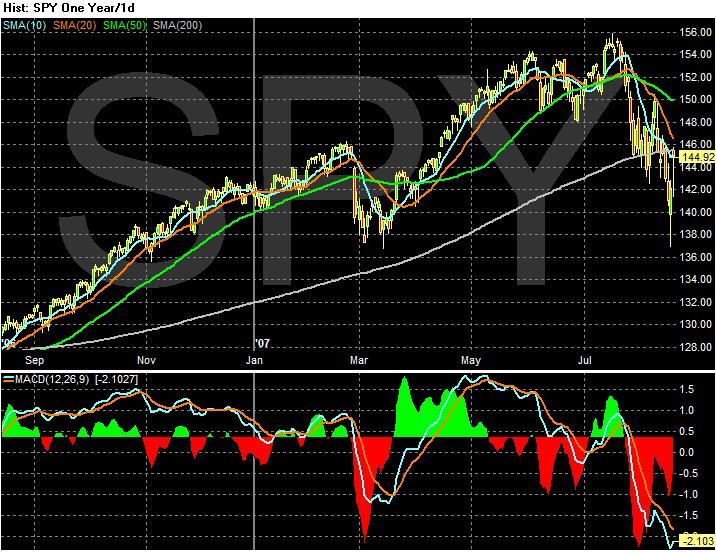
That being said, let's begin. Let's start with the last chart from yesterday's post of the SPYs -- a 3-month chart. The same observations apply. All of the moving averages are moving lower. The short-term SMA are below the longer term SMAs which will exert downward pressure for now. The trend since the last week of July has been down. Most importantly, the average is flirting around the 200 day SMA, which is usually the line that separates bull and bear markets.


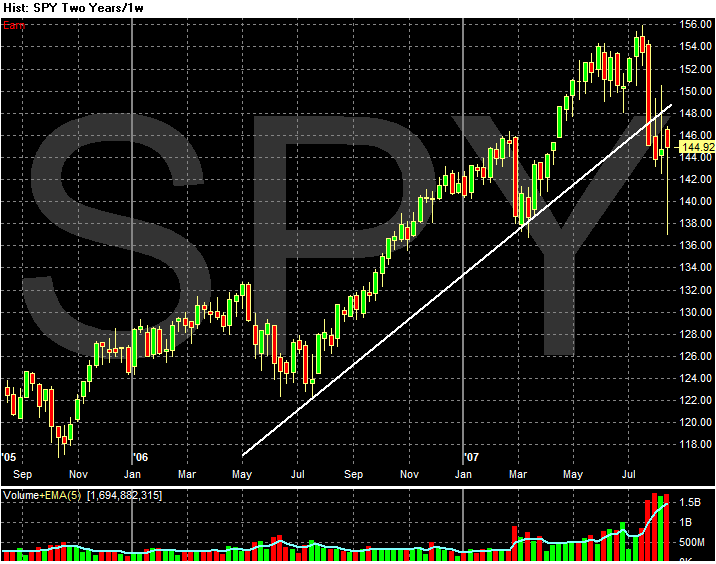
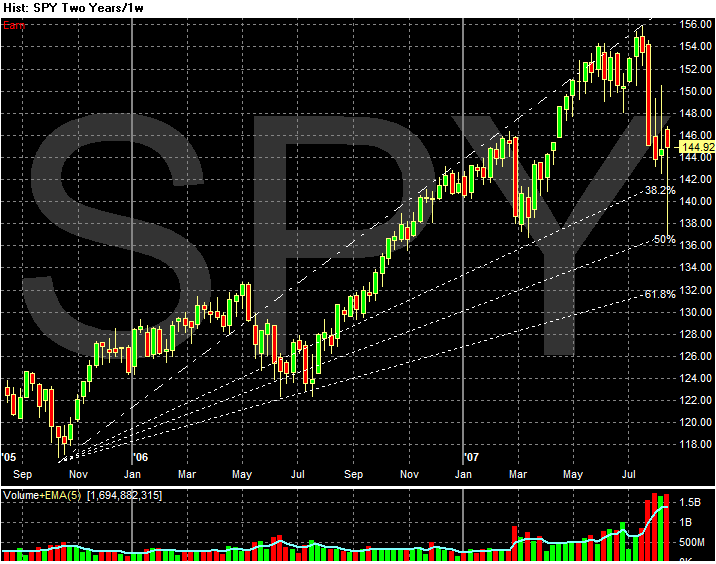
Here's the two year, weekly chart. Notice the SPYs have rallied since early July 2006. They have since broken their trendline on heavy volume.


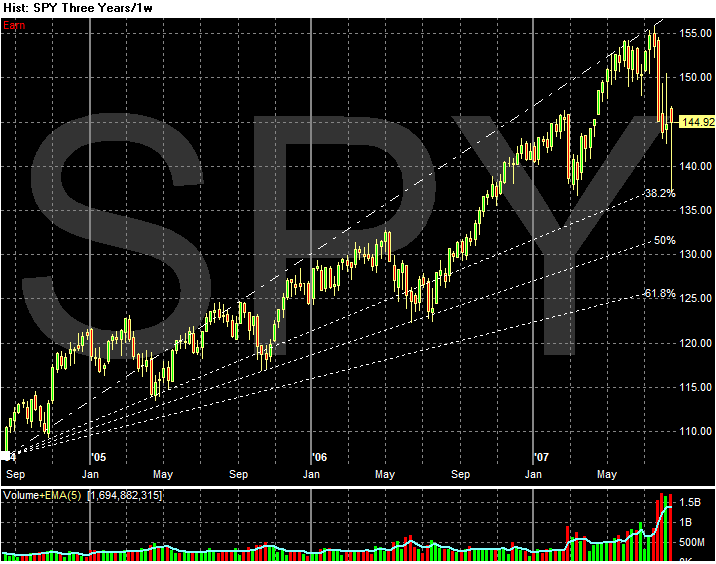
Here are three weekly charts, which all have Fibonacci fans. Notice that:

On the one year chart, we are below the first line of support, which is now acting as upside resistance.
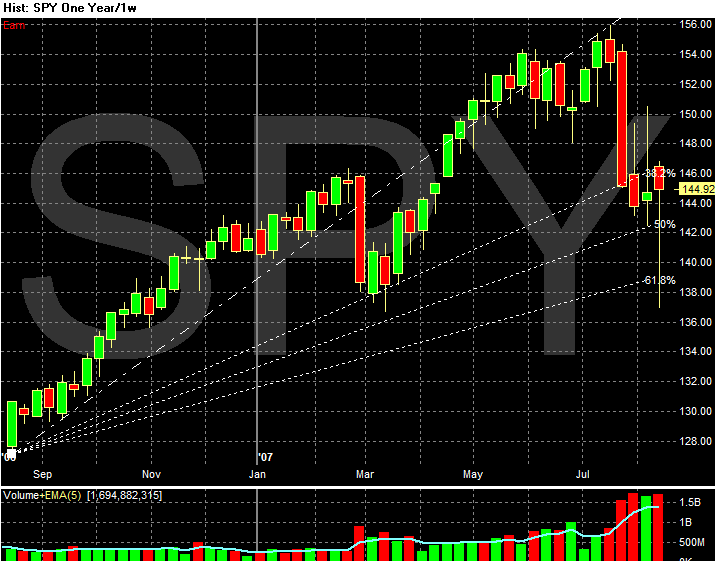


On the two year chart we have downside room of about 2 to 2.5 points before we get to support.


On the three year chart we have about 6-7 points before we get to support.


The 1-year daily MACD is very oversold:


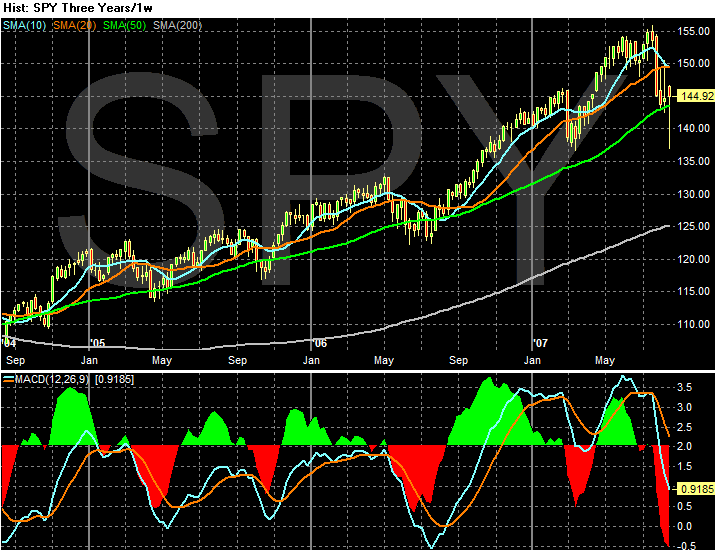
But on the weekly 3-year MACD we have both upside and downside room.


So -- what does all of this mean?

1.) Most short-term indicators are very negative -- downward sloping SMAs, shorter SMAs below longer SMAs and the average is moving through the 200 day SMA at a downward trajectory.

2.) Longer-term indicators also weigh bearish. We're below the 1-year Fibonacci resistance with downside room on the 2 and 3 year charts. We've also broken a two year trend line to the downside. While the short-term MACD is oversold, it seems the market is rally reacting to the longer-term bull run right now and correction three years of upside moves.

3.) The one wild card is the Fed. Here is the best summation I have found:

Federal-funds contracts traded on CME Group suggest market participants see the Fed cutting rates by a half-percentage point at the September 18 meeting. But don’t put that in the bank just yet. Though the actions taken by the Fed were meant to bolster confidence in the financial system — and the Fed encouraged banks to use the discount window, which normally carries a bit of stigma – some believe the move today is a way for the monetary committee to buy itself more time, and perhaps even lessens the possibility of a rate cut in September. “We believe the action reduces the overriding worry that the mortgage market would grind to a halt,” says Standard & Poor’s chief economist David Wyss. “It also buys the Fed time to assess the situation and possibly not act on the Fed funds rate until September.”
Friday, August 17, 2007

Today's Markets

OK -- the Federal Reserve lowered the discount rate by 50 basis points. Let's review exactly what that means.

US banks use a fractional reserve system. All this means is a bank much have x% of its total assets on hand at any given time. However, in a banks usual business affairs their reserves may dip below this percentage amount. When this happens, banks must borrow short-term money from somewhere. Usually, they go to other banks. The interest rate banks charge each other is the Federal Funds rate. In addition, a bank can go directly to the Federal Reserve and borrow money. The Fed will charge the bank the discount rate. Going to the Federal Reserve to borrow money is a last resort and is usually considered a sign of weakness. Therefore, lowering the Discount rate is largely a symbolic gesture because it isn't used nearly as much as the Federal Funds rate.

However, the Fed's move today signals it is paying close attention to the markets and the economy. Here is the key phrase from today's announcement: "the Federal Open Market Committee judges that the downside risks to growth have increased appreciably. The Fed is saying the chances of an economic slowdown are increasing. While they are not prepared to cut the more important Federal Funds rate, they are paying attention and are prepared to act if necessary.

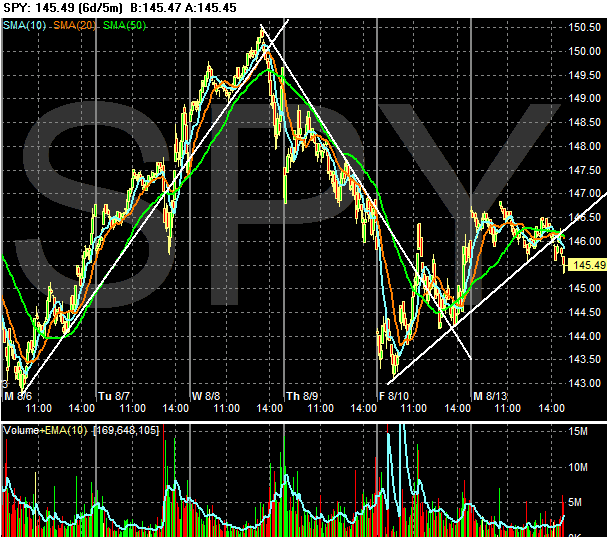
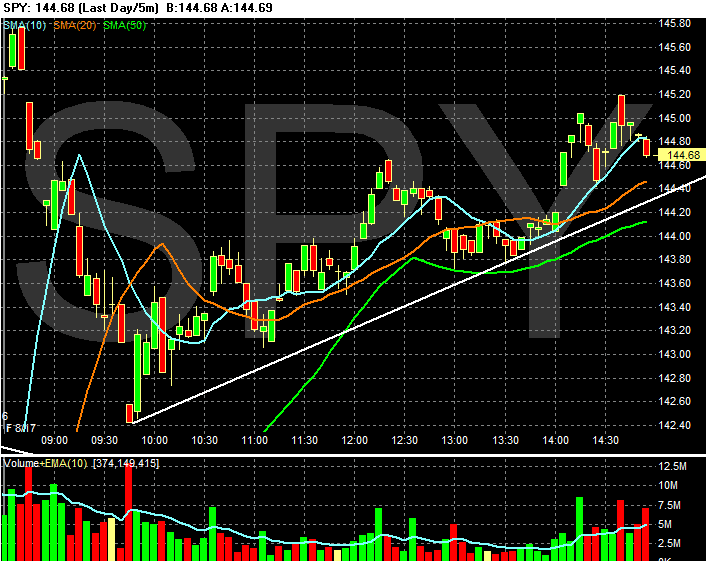
Here's how the market reacted. It rallied right at the open, dropped a bit then slowed moved up for the rest of the day. The market was thinking about selling off at the end but ran out of time.


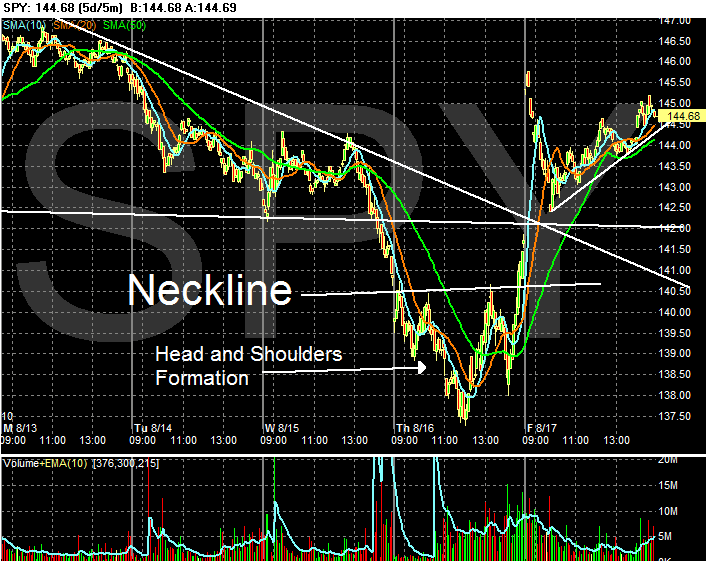
Here's the chart from the whole week. Notice that Thursday's dip formed a nice head and shoulders formation, which is usually a sign of a reversal.


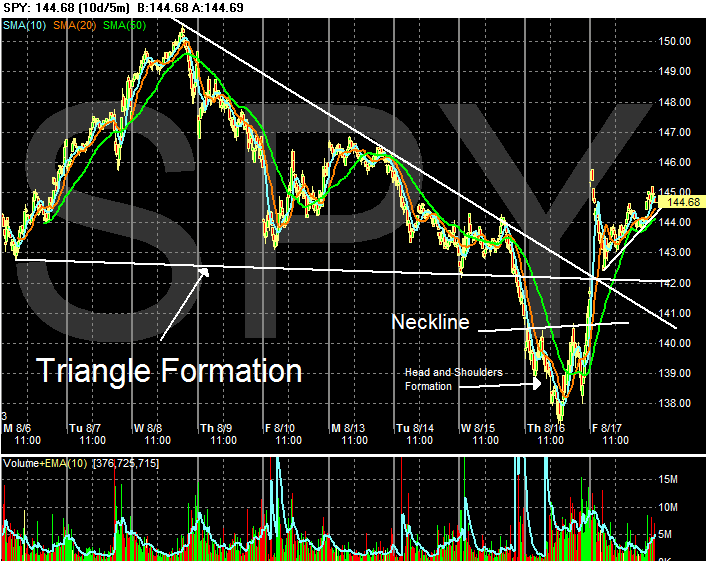
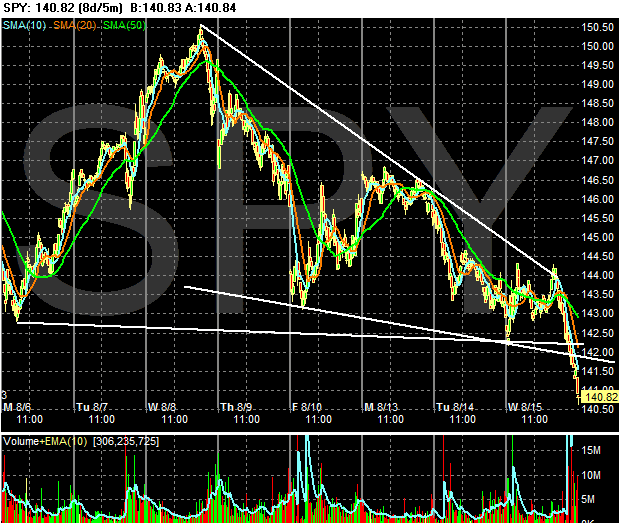
Here's a 10-day chart. Notice we dipped below the triangle formation of the preceding 7-10 days, but rose above it on today's rate cut.


Here's the daily chart, which indicates we're not out of the woods because

1.) The SPYs are clearly in a downtrend. Today's action started at resistance but closed lower bringing today's candle clearly within the range.

2.) The 10, 20 and 50 day SMAs are all moving lower. This means there is weekly and monthly bearish pressure on the index.

3.) The shorter SMAs are below the longer SMAs

4.) The moving averages are acting like upside resistance. Today's action started at the 200 day SMA but closed lower. However, today's close was right on top of the 10 day SMA. That could be the sign of some strengthening in the market.

Consumer Confidence Drops

From Bloomberg:

The Reuters/University of Michigan preliminary index of consumer sentiment fell to 83.3, a bigger drop than forecast and the lowest reading since August 2006, from 90.4 a month earlier. A measure of expectations also declined.

Americans turned their attention to the plunge in U.S. stock markets even as a decline in gasoline prices eased a primary worry from recent months. The outlook for household spending may worsen as tighter credit conditions force businesses to curtail hiring, economists said.

``This is consistent with a consumer who's reining in spending,'' said Carl Riccadonna, an economist at Deutsche Bank Securities Inc. in New York. ``We're looking for some softening in the labor market. If companies aren't confident because of what's happening in financial markets, that could make them more cautious about hiring.''


Get us to seeing the following chart, which is the last 6 months of inflation adjusted annual rate of consumer spending at seasonally-adjusted annual rates. It shows a consumer who isn't about to slow his spending, but one who has already slowed his spending. Consumer consumer spending is responsible for 70% of economic growth, this is a big deal.

Dollar Drops on Rate Cut

From Bloomberg:

he dollar fell versus the euro and pound after the Federal Reserve reduced its discount lending rate to prevent credit market losses from slowing the economy.

The dollar weakened against 15 of 16 major currencies as a reduction in borrowing costs dims the allure of U.S. assets. The decline today trimmed the dollar's weekly advance as investors had sought safety in the currency after a global rout of credit markets. U.S. and European stocks rallied.

``The Fed has taken the first step to calm down the market and restore investors' confidence,'' said Tom Fitzpatrick, global head of currency strategy at Citigroup Global Markets Inc. in New York. ``The dollar is getting a double-whammy. A reduction in interest rates makes it less attractive. The safe-haven flow into the dollar also flooded out.''


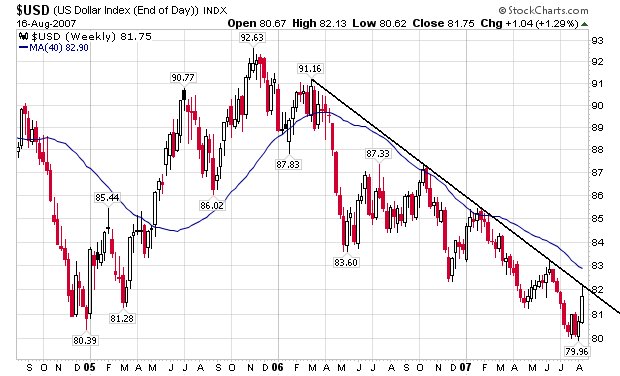
Here's a weekly chart of the dollar before today's action:


BTW: I have previously argued the dollar's value was a prime reason to not lower interest rates.

Bernanke Bails Out the Street; Fed Lowers Discount Rate to 5.75%

From the FOMC:

Financial market conditions have deteriorated, and tighter credit conditions and increased uncertainty have the potential to restrain economic growth going forward. In these circumstances, although recent data suggest that the economy has continued to expand at a moderate pace, the Federal Open Market Committee judges that the downside risks to growth have increased appreciably. The Committee is monitoring the situation and is prepared to act as needed to mitigate the adverse effects on the economy arising from the disruptions in financial markets.


First -- let's get some terminology down. The Discount Rate is, "The interest rate that an eligible depository institution is charged to borrow short-term funds directly from a Federal Reserve Bank." This is usually considered a bad move because it signals the borrower may be in trouble. Essentially, the discount rate is the rate of last resort.

This type of borrowing from the Fed is fairly limited. Institutions will often seek other means of meeting short-term liquidity needs. The Federal funds discount rate is one of two interest rates the Fed sets, the other being the overnight lending rate, or the Fed funds rate.


In other other words, this is as much a symbolic gesture as a practical one.

But the damage has been done. Bernanke has continued the the "Greenspan put" tradition. When financial markets screw-up and make a ton of bad loans, the Federal Reserve will bail them out.

As Bloomberg said:

Today's move also shows how Bernanke, like his predecessor, is prepared to temporarily abandon Fed growth forecasts and inflation objectives to offset the risk of a credit crunch. Former Chairman Alan Greenspan was known for his tendency to give financial market conditions a primary role in policy, and he came to the rescue on several occasions when turmoil struck.

`Greenspan Put'

Until now, Bernanke had shown every intention of shunning the so-called Greenspan put. He wanted more emphasis on the forecasts of the institution and policy less dependent on the whims of whoever occupies the chairman's suite.

Carry Trade Going Away?

First -- what is a carry trade?


From the WSJ:

The yen has risen in large part after fears of a U.S. credit crisis this week reversed a trading strategy called the carry trade. Under the carry trade, investors borrow money in countries with low interest rates, such as Japan, to invest in assets in countries with higher rates. The move, considered a lucrative foreign-exchange tactic in recent years, has pushed the Japanese currency to its lowest level in years against other currencies. But over the past week, investors have been selling some of the riskier assets bought in other currencies to pay back the yen they had borrowed, leading to a rise in the yen.

Some analysts say the yen could appreciate further. "This could snowball," said Marshall Gittler, Chief Asia Strategist for Deutsche Bank AG's private wealth management group. Mr. Gittler believes that the yen's fair value could be even higher at less than ¥90 to the dollar.


The current situation in the global credit markets is creating a big problem in this strategy:

From Thompson Financial

A worsening credit crisis in the US which is slowly engulfing the global debt market will accelerate unwinding of yen carry trades and lift the Japanese currency to new highs, analysts said on Friday.

....

The near zero interest rate in Japan in recent years had offered investors virtually free money to finance their leveraged investment, dragging the yen to as low as 124.12 versus the dollar on June 22 this year, its weakest since December 2002.

But as worries about tighter credit, triggered by the problems in the US subprime mortgage sector, spilled onto the global market and shook equity markets across the globe, investors are now rushing to unwind their positions and convert them back into the yen.


From Bloomberg:

The yen was poised for its biggest weekly gain versus the dollar and euro in almost nine years as traders dumped investments funded by loans in Japan.

The yen rose against all currencies this week as turmoil in credit markets and a global rout in corporate bonds and stocks prompted an exodus from so-called carry trades. The Japanese currency had its steepest gain versus the New Zealand dollar, a favorite for such trades, in more than three decades.

...

UBS AG said its Risk Index reached a record 2.53, higher than after the Sept. 11, 2001, terrorist attacks on the U.S. and the collapse of hedge fund Long-Term Capital Management LP in October 1998. The yen, which had been weakening for years, subsequently surged 20 percent in less than two months as investors who'd borrowed cheaply in the currency rushed to exit.

``Our Risk Index signals it's a crisis that may be similar to or even worse than 1998,'' Muta said.


Let's look at the chart to see what is going on.

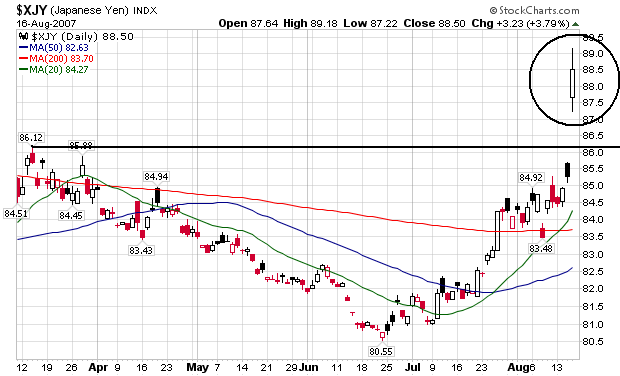
Here's the daily chart which clearly shows the yen has spiked higher on this movement in the global currency markets.


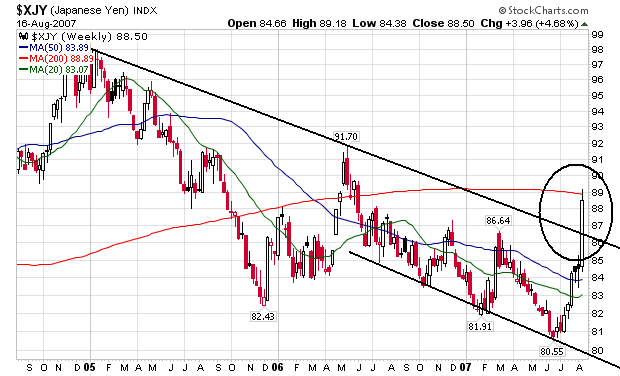
And here's the weekly chart. Notice the yen was in a downward sloping range for the last few years. Now it has broken out of that range in a big way. This is going to roil traders and probably increase the move back into the yen.


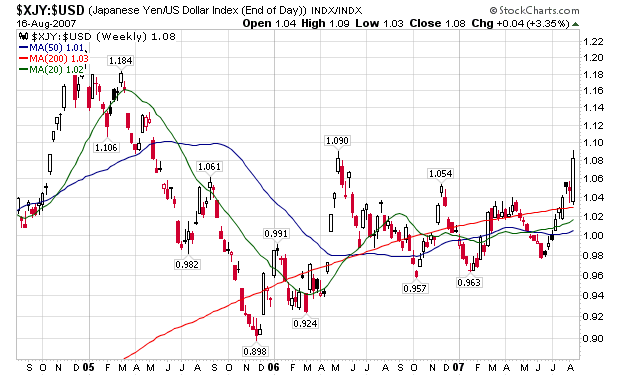
Here is a chart of the yen/dollar over the last few years. Notice the currencies have been in a relatively stable relationship. This week's spike in the yen threatens that stable relationship, forcing more traders to unwind carry-trades, spiking the yen, which will force more traders to liquidate carry-trades....you get the idea.

Thursday, August 16, 2007

An Explanation for the Late Day Rally

From CBS Marketwatch

Financials bounced back led by a nearly 13% in shares of Bear Stearns. The company, which heralded the recent credit market crisis when two of its hedge funds ran into trouble, has been talking with potential investors, including Chinese banks about new funding, said Richard Bove, analyst at Punk Ziegel & Co.

The firm is talking about selling as much as a 20% stake in the company, Bove said

Also helping financials, a report by rating-agency Fitch said that U.S. brokerage firms are well funded and have sufficient capacity to absorb losses from marking their assets to market.

Today's Markets

Wow -- what a roller coaster. Notice the extreme action today in the markets. The late-day buying spree is a definite plus for the markets entering into tomorrow.


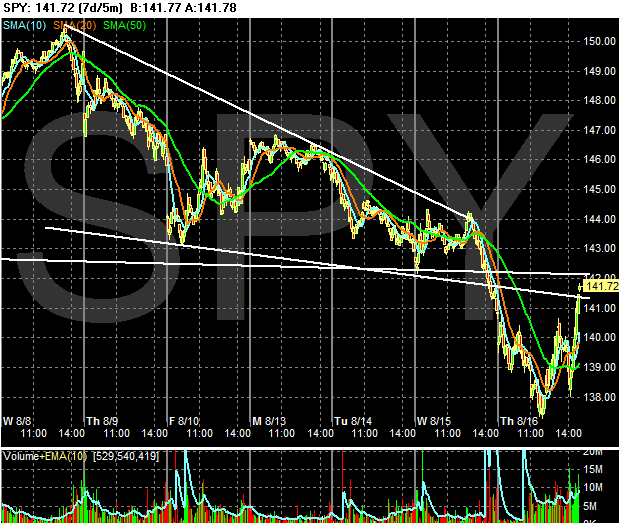
However, the 7-day chart indicates we're not out of the woods yet. Notice we still have resistance at the lower part of the triangle formed over the last 8-10 days.


And here's the daily chart. There are a lot of ways to look at this. There is really high volume, which could indicate a selling climax. However, we're still below a ton of resistance and the market is clearly in a downtrend. Combine that with the overarching credit market situation and you still have pretty strong downward pressure.

Home Starts Drop

From Bloomberg:

Builders in the U.S. started work on the fewest homes in a decade in July as the industry showed no sign of recovering from an 18-month recession.

The greater-than-forecast 6.1 percent decrease to an annual rate of 1.381 million followed a 1.47 million pace in June, the Commerce Department said today in Washington. Building permits also fell to a 10-year low.

.....


``Even the most ambitious homebuilders will think twice about initiating new projects,'' said Lindsey Piegza, an analyst at FTN Financial in New York. ``Falling prices, sluggish demand, and dwindling mortgage credit availability will continue to weigh heavily on residential construction.''


This news should surprise no one. Sales are dropping, inventory is very high and lending standards are tightening. I also hear there's a problem in the mortgage markets......

More Problems From Australia

From the WSJ:

Hedge-fund manager Basis Capital Funds Management Ltd. said losses in its Yield Alpha Fund may exceed 80% after it was hit by the fallout from the U.S. subprime-mortgage crisis.

Basis Capital last month appointed Blackstone Group of the U.S. to act as financial adviser on two of its Cayman Islands-domiciled funds -- the Basis Yield Alpha Fund and the Basis Pac-Rim Opportunity Fund -- in an attempt to avoid a fire sale of their assets.

Other Australian funds, including Macquarie Bank Ltd.'s Fortress Investments and Absolute Capital, have said they face big losses because of fallout from the subprime problems. In a sign that bond-market turmoil is spreading to investments that are considered conservative, Sentinel Management Group Inc., a U.S. money manager, on Tuesday halted withdrawals from cash accounts, citing "panic" conditions. Sentinel manages money for hedge funds and commodities traders in what are loosely akin to money-market funds.

Basis Capital warned the net asset value of the Yield Alpha Fund could be halved and suspended withdrawals from its two domestic funds, the Basis Aust-Rim Diversified Fund and Basis Yield Fund, which feed into the two offshore master funds, because volatile markets meant it couldn't compute the funds' net asset value.


This is not what we need right now.

Money Poors into the Short End of the Yield Curve

From Bloomberg:

Investors are scooping up U.S. Treasury bills like few times in history as an expanding credit crunch makes it hard for companies to roll over short-term debt.

The yield on the three-month Treasury bill fell 0.54 percentage point yesterday to 4.09 percent, the lowest since 2005. It was the biggest single-day decline since Oct. 13, 1989, when the Dow Jones Industrial Average tumbled 6.9 percent, and exceeded the 0.39 percentage point drop in the aftermath of the Sept. 11, 2001, terrorist attacks.

Lenders are so concerned about the fallout from rising delinquencies on subprime mortgages that rates on commercial paper have shot up to 5.83 percent from 5.36 percent a month ago, data compiled by the Federal Reserve show. Commercial paper is debt due in nine months or less and is bought by money-market funds such as those managed by Boston-based Fidelity Management & Research and Vanguard Group Inc. in Valley Forge, Pennsylvania.

Money funds that had been buying corporate commercial paper ``have all switched to the safe side,'' said Glen Capelo, a trader at RBS Greenwich Capital in Greenwich, Connecticut, one of 21 firms known as primary dealers that trade directly with the Fed. ``I'm sure their managers have all given them a Treasury-only mandate, at least until the dust settles.''


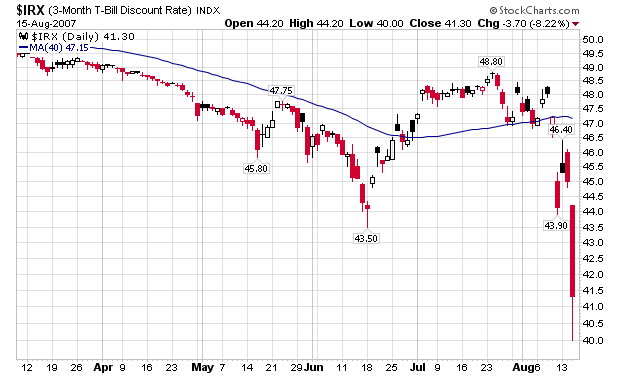
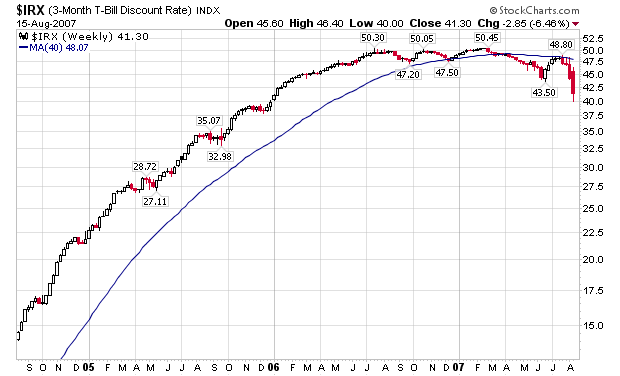
Here are two charts from Stockcharts.com which shows what is happening on the short end of the yield curve. Notice that:

-- this part of the curve does not move very much; it is usually very consistent.

-- this part of the curve has moved a ton over the last few weeks. This indicates how concerned institutions are about the credit situation

-- I have to wonder how much of the Fed's credit injection is moving into the short end of the curve.

-- If anything, this tells us there is a credit crunch going on right now -- and it's not getting better right now.

Here's the daily chart:


Here's the weekly chart:

Australian Mortgage Lender Can't Get Financing

From Bloomberg:

Australia's Rams Home Loans Group Ltd. failed to refinance A$6.17 billion ($5 billion) of short- term U.S. loans, forcing the lender to seek emergency funding.

Rams slumped 36 percent, or 48.5 cents, to close at 87 cents on the Australian Stock Exchange. The Sydney-based company has lost two-thirds of its market value this week and is down from the A$2.50 paid by investors in an initial public offering arranged by UBS AG before the company listed on July 27.

The lender's inability to obtain financing helped fuel the biggest decline in Asian shares in a year as investors fled high-risk assets. The deepening crisis in credit markets threatens to ensnare more mortgage lenders. Countrywide Financial Corp., the biggest U.S. home-loan issuer, dropped 13 percent after Merrill Lynch & Co. said it may fail.


This shows how the problems in the mortgage market have seeped into the rest of the credit market. Here we're talking about short-term commercial paper which (depending on the quality of the borrower) is usually a done deal. However, because a mortgage funder is involved, no one wants to touch the deal.

This is what a credit crunch looks like.

Wednesday, August 15, 2007

Today's Markets

Not a good day. In addition, we might look back on this day in about 3-6 months and say this was the turning point.

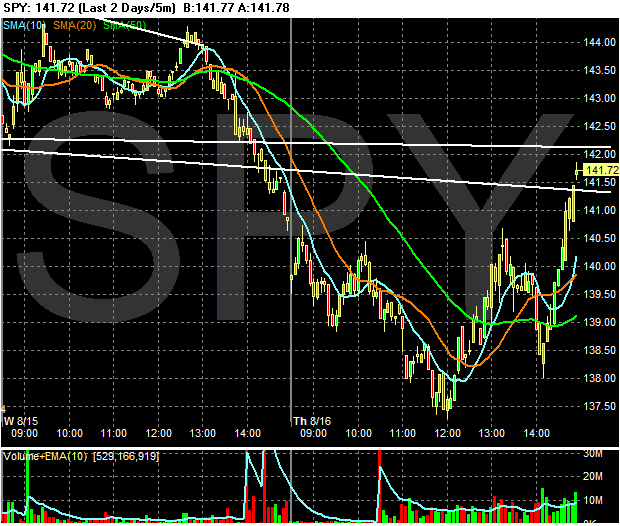
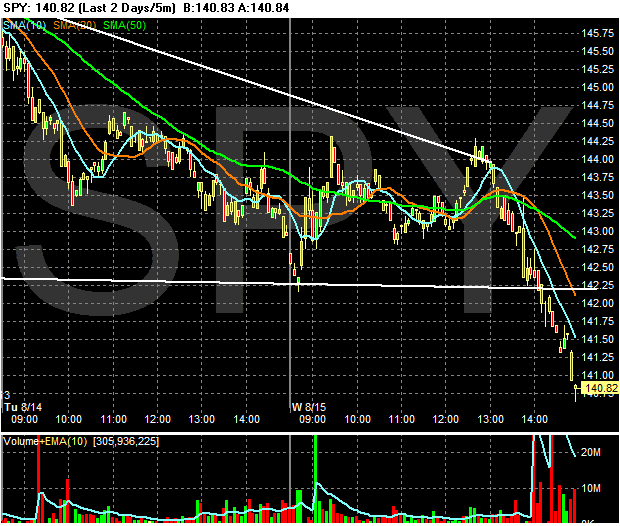
Here's the 2-day 5-minute chart. Notice the market started selling off a little after 12.30. Also notice the market continued downward since that time. Once the market broke through support the volume pick-up and the decline continued.


Here's the 8-day chart. Yesterday I commented the market was forming a triangle consolidation formation; we simply didn't know where the market was headed. Now we do -- lower.


Here's the chart that should concern everybody. The SPYs closed below the 200-day SMA in a big way. This is what the beginning of a bear market/serious bull market correction looks like. In short, this chart ways we are heading lower.

Empire State Survey Pretty Good; Industrial Production Up

From the NY Fed:

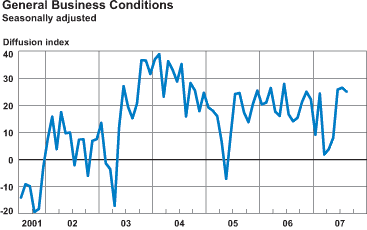
The Empire State Manufacturing Survey indicates that conditions for New York manufacturers continued to improve in August. The general business conditions index held steady at 25.1.

The new orders and shipments indexes remained at similarly high levels, while the unfilled orders index continued to hover near zero. The prices paid index also remained essentially unchanged, while the prices received index fell to its lowest level in two years. Employment indexes were positive and above their July readings. Future indexes conveyed steady optimism, although the future shipments index turned sharply lower. While positive, future price indexes fell, as did the capital spending and technology spending indexes.


Here's the accompanying chart.


From the Federal Reserve:

Industrial production rose 0.3 percent in July after an increase of 0.6 percent in June. At 113.9 percent of its 2002 average, total industrial production in July was 1.4 percent above its year-earlier level. In July, manufacturing output moved up 0.6 percent and mining output advanced 0.7 percent, but the output of utilities fell 2.1 percent. Capacity utilization for total industry edged up to 81.9 percent, a rate 0.5 percentage point below the level in July 2006 but 0.9 percentage point above its 1972-2006 average.

....

Manufacturing output rose 0.6 percent in July, as production of both durable and nondurable goods increased. The increase in manufacturing followed a similarly sized gain in June. The production of durable goods rose 0.9 percent in July, and gains were widespread across components. The production of nondurable goods rose 0.3 percent, after a gain of 0.4 percent in June. Substantial advances in July occurred in paper, petroleum and coal products, and chemicals. However, the output indexes for textile and product mills, apparel and leather products, and plastics and rubber products all declined. The output of the non-NAICS manufacturing industries (logging and publishing) rose 0.8 percent. The factory operating rate advanced 0.3 percentage point, to 80.7 percent, a rate about 1 percentage point above its 1972-2006 average.


However, the year-over-year change has been declining for a bit:


Both of these are welcome reports considering the overall market tenor of the last 3-4 weeks. Manufacturing continues to be a bright spot in the economy. My guess is the very low position of the dollar has a lot to do with this.

Homebuilder Confidence Lowest Since 1991

From the NAHB:

Highly visible problems in the housing finance system are contributing to a wait-and-see attitude among prospective home buyers and reducing builder confidence in the single-family housing market, according to the latest National Association of Home Builders/Wells Fargo Housing Market Index (HMI), released today. The HMI declined two points to 22 in August, its lowest level since January 1991.

“Builders realize that issues related to mortgage credit cost and availability have become more acute, filtering some prospective buyers out of the market and prompting others to delay their decision to purchase a new home,” said NAHB President Brian Catalde, a home builder from El Segundo, Calif. “Builders are responding by trimming prices and stepping up non-price incentives to bolster sales and limit cancellations, although we’re dealing in a difficult market environment.”

“There is no question that problems in the subprime mortgage sector have spilled over to other components of housing finance, including the Alt.-A and jumbo markets, delaying a revival of the single-family housing market,” added NAHB Chief Economist David Seiders. “However, the government-related parts of the mortgage market still are functioning well and the underlying economic fundamentals promise to remain solid for some time – providing support to the longer-run housing outlook. We now expect to see home sales return to an upward path by early next year and we expect housing starts to begin a gradual recovery process by mid-2008. From there, the market will have plenty of room to grow in 2009 and beyond.”


The last paragraph is pretty laughable. Lenders have tightened their lending standards. The inventory of new and existing homes stand near all time highs and the mortgage market is generally a really big mess right now. While the credit markets might be better by early 2008, I don't see lending standards loosening up anytime soon. This lowers the number of buyers in an already over-supplied market. I think early 2008 is way too optimistic.

Consumer Spending, Gas Prices and the Housing Market

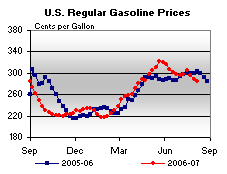
Here is a chart of gas prices from This Week In Petroleum. Notice that gas prices peaked in late May. Since then they have dropped a bit, essentially settling into their standard higher price range of the summer.


Now, when did the sub-prime mess really start to blow-up? Although there were a few problems before the week of July 22, it was that week when Bear Stearns announced it's problems with two hedge funds. So, there was a period of a month 1/2 to month 3/4 when the consumer had some breathing room in terms of negative news.

However, notice that June and July Personal Consumption expenditures were still weak on an inflation adjusted basis. In other words, the consumer is still reeling from high gas prices and the turmoil in the markets.


That leads to a question. What is the possibility that consumer spending increases? Probably not that high right now. There are a ton of reasons for the consumer to be fearful.

Inflation Up .1%

From the BLS:

The Consumer Price Index for All Urban Consumers (CPI-U) was virtually unchanged in July, before seasonal adjustment, the Bureau of Labor Statistics of the U.S. Department of Labor reported today. The July level of 208.299 (1982-84=100) was 2.4 percent higher than in July 2006.


There are some important caveats to this statement. Ignore them if you don't consume energy or food.

Food prices increased .3% and are up at a compound annual 3-month rate of 4.3% and increased 4.1% in the last 12 months.

Energy prices decreased 1% and are up at a compound annual 3-month rate of 16% and increased 1% in the last 12 months.

The core rate (again this assumes you don't buy food or energy) 2.2% in the last 12 months.

Here's more from the report:

During the first seven months of 2007, the CPI-U rose at a 4.5 percent seasonally adjusted annual rate (SAAR). This compares with an increase of 2.5 percent for all of 2006. The index for energy, which rose 2.9 percent in 2006, advanced at a 21.3 percent SAAR in the first seven months of 2007 despite registering declines in each of the last two months. Petroleum-based energy costs increased at a 36.9 percent annual rate and charges for energy services rose at a 3.8 percent annual rate. The food index has increased at a 5.7 percent SAAR thus far this year, following a 2.1 percent rise for all of 2006. Excluding food and energy, the CPI-U advanced at a 2.3 percent SAAR in the first seven months, following a 2.6 percent rise for all of 2006.


Here's how Bloomberg reported the numbers:

Consumer prices in the U.S. rose 0.1 percent in July, the smallest gain in eight months, signaling the Federal Reserve may view inflation as less of a threat.

The increase in the cost of living followed a 0.2 percent advance in June, the Labor Department said today in Washington. Core prices, which exclude food and energy, climbed 0.2 percent and were up 2.2 percent from a year earlier.

``Price pressures are declining because of a slowing economy and higher interest rates, and I think those pressures will continue to ease,'' Lindsey Piegza, an analyst at FTN Financial in New York, said before the report. ``Inflation is still at the top of the Fed's range, so the Fed continues to downplay the declines because it wants to make sure.''


And CBS.Marketwatch:

With gasoline prices falling, U.S. consumer prices increased 0.1% in July, the slowest inflation rate in eight months, the Labor Department reported Wednesday.

The core consumer price index, which excludes volatile food and energy prices, increased 0.2% for the second straight month.

The seasonally adjusted inflation figures were exactly as expected by economists surveyed by MarketWatch.

Falling energy prices, a moderate rise in housing costs and flat auto prices held the CPI down in July, partially offsetting higher prices for apparel and medical care.
The CPI is up 2.4% in the past year, while the core CPI is up 2.2%, close to the upper end of Federal Reserve's target zone.


Expect this news to encourage talk about a rate cut. However, here's why I don't think that will happen.

Subprime Issues Nowhere Near Done

From the WSJ:

The oft-repeated problem is that the funds, and even some companies, can't get prices for many debt securities and derivatives with direct or indirect links to loans made to homeowners with spotty credit histories. Given that, they ask, how are they supposed to mark holdings to market when there is no market?

Typically to "mark" or estimate the value of a holding, funds use market prices, quotes from broker-dealers, values tallied by third-party pricing services, internal models or some combination of all four. Sometimes funds will block redemptions of their securities in an effort to prevent having to sell into a market that they think is below reasonable values. Still, funds have an obligation to estimate the value of their holdings to reflect market realities. But, without a market, doing so can get tough, especially when markets take a dive.

How to do so is open to debate, and in some cases the methods may be pretty unpalatable for managers dealing with the turmoil now gripping markets. One answer is that everything has a price -- if it is low enough. That is tough for many managers to swallow if they think the long-term value of a holding isn't impaired. Trading at such a price is also a difficult prospect if a manager wants to avoid selling into a distressed market. The key point with BNP, for example, was the use of the word "fairly."

But if there are no buyers to be found, there may be an even worse alternative. "Then the price is zero," says Jack Ciesielski, editor of the Analyst's Accounting Observer newsletter. "If there's a bid out there, then there's a price. Take your pick."


This is one of the central problems managers are facing right now -- what is the value of some of the assets they hold in their portfolio. Because the markets are going through a correction, the value of some assets is falling. But according to the article, managers can't even get a broker to give a price for some security. That means several things;

1.) If a broker won't give you a bid on a bond, it means the market is completely frozen for some bonds.

2.) How does a manager value his portfolio if he can't get a price quote on a bond? The answer is he can't. Now if the manager isn't facing a rash of redemptions then he can ride this situation out. However,

For anyone worried hedge funds could spark another market crisis, Wednesday is a red letter day: the final chance for investors to put in demands for their money back by the end of September at many funds using standard redemption terms needing 45 days’ notice.

By Thursday, hedge funds with these terms will know exactly how much cash they must find to repay shareholders; cash they are likely to find by selling their investments. Large-scale redemptions may prompt big sell-offs; something BNP Paribas analysts say could cause “irrational” markets.


The real issue going forward is the amount of redemptions hitting funds right now. This could be similar to a run on banks. However -- and I will caution here in the strongest possible terms -- we don't know what the level of redemption requests is right now. If it is high (and again, WE DON'T KNOW WHAT THE LEVEL IS) then we're in for another round of serious problems. If it's low, then we could be able to ride this out. Again -- this is definitely a wait and see what the news says type of situation.

Australian Hedge Fund Loses 80%

From the Sydney Morning Herald

Basis Capital Fund Management - the first Australian company to get caught up in the subprime mortgage rout - today said losses on its funds may exceed 80 percent, according to a Bloomberg report.

The deteriorating subprime mortgage market has prompted some of its creditors to force the sale of some assets which is causing the worst-then-expected losses, according to the report.

The Sydney-based hedge fund has been unable to "accurately estimate" the net asset value of units in its Yield Fund because of "further deterioration of market conditions," Basis said today in a letter sent to investors and obtained by Bloomberg.

"The situation in global structured credit markets remains fluid and uncertain," Basis said in the letter.


This is not a new announcement; this is an assessment of a fund we already knew about. But the amount of the losses should indicate the breadth and depth of the problems some funds are facing right now.

Tuesday, August 14, 2007

Today's Markets

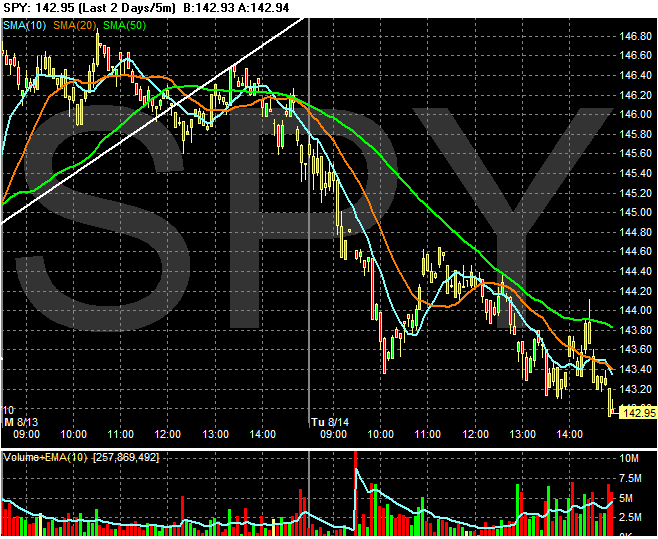
Between the Home Depot/Wal-Mart announcement and Sentinel's halting redemptions (see below) the market had plenty of bad news to send it lower. Here's the 2-day 5 minute chart. Notice

1.) The clear downtrend that started about 11 AM and continued for the rest of the trading day.

2.) The market sold-off at the end of the day on big volume.

3.) All three simple moving averages (SMAs) are moving lower and the short-term averages (10 and 20 minute SMAs) are lower than the 50 minute SMA. Both of these factors are bearish.


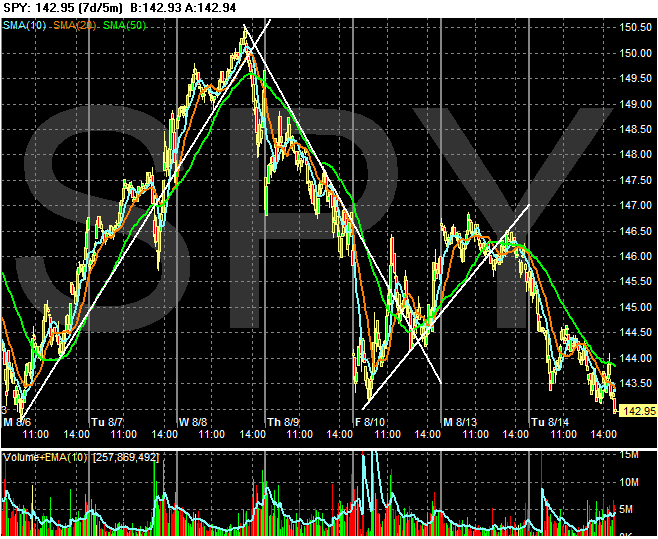
Here's a 7-day chart that goes back to Monday of last week. Notice we're right where we started last week.


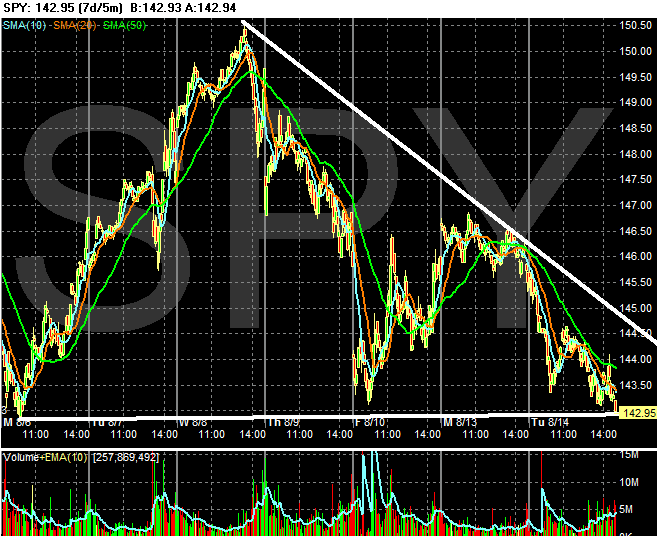
Here's another way to look at the chart. The last 7-days are a triangle consolidation pattern. This could mean that prices are ready to move strongly in one direction or another. The big question is which direction.


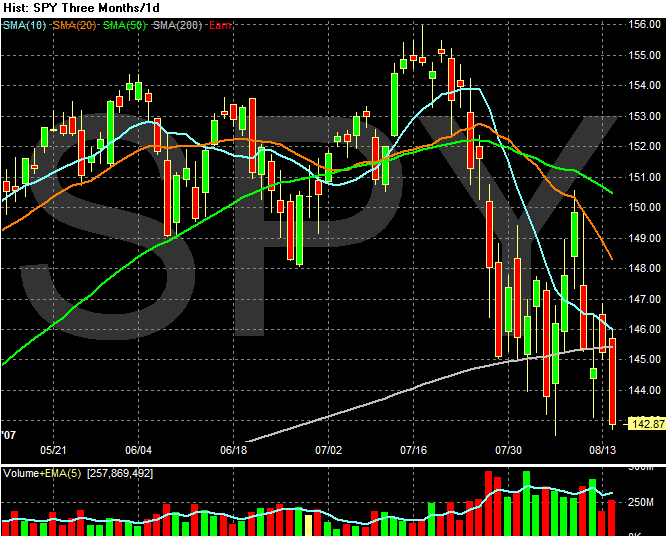
Finally, here's the daily chart, which looks terrible. The 10, 20 and 50 SMAs are all moving lower. The shorter-term SMAs are below the longer SMAs, strongly indicating a further downtrend. The index closed below the 200 day SMA pretty decisively. Bottom line -- this chart stinks for anyone going long.

More On Sentinel's Halting of Redemptions

From Bloomberg:

Sentinel Management Group Inc., the Illinois-based firm that manages $1.6 billion, said it asked regulators for permission to freeze client withdrawals because credit-market turmoil made it impossible to trade.

....

Sentinel invests for clients such as managed-futures funds, high-net-worth individuals and hedge funds that want to be able to withdrawal their cash quickly. Its investments include short- term commercial paper, foreign currency, investment-grade bonds and Treasury notes, according to its Web site.

.....

``Investor fear has overtaken reason and has induced a period in which most securities have simply ceased to trade,'' according to the client letter, which does not specify which funds are affected. ``We are concerned that we cannot meet any significant redemption requests without selling securities at deep discounts to their fair value and therefore causing unnecessary losses to our clients.''


From Sentinal's Website:

» Sentinel is a pioneer in the field. Since 1979, our success has been the result of managing clients' cash with utmost safety, daily liquidity and a high rate of return. Throughout our history, no client has suffered a loss as a result of its dealings with Sentinel.

» Sentinel is recognized by clients and peers for its professionalism and performance.

» Sentinel is registered with the Securities and Exchange Commission (SEC) pursuant to the Investment Advisers Act of 1940. Our stewardship of client funds is overseen by multiple federal and industry regulators.

» We provide our clients with liquidity and operational ease. Funds can be added or withdrawn as late in the day as 4pm, Eastern time. A complete report of activity and value is provided daily.


They have three funds.

Treasuries Only Portfolio

» Treasury Bills, Notes, and Bonds
» Government National Mortgage Association (Ginnie Mae) obligations
» Repurchase Agreements collateralized by the above instruments


123 Portfolio

» Obligations of the U.S. Treasury and GNMA
» Short term commercial paper rated A1/P1
» Medium and long term debt rated AA or higher
» Bank time deposits
» Repurchase agreements collateralized by the above


They also have a prime fund which is currently off-line.

From what I am seeing, I don't see any major problems; this looks like solid conservative money-management to me. According to CBS Marketwatch:

Sentinel Management Group Inc., a firm that manages cash for other investors, has moved to halt client redemptions to avoid selling securities at deep discounts.

Sentinel told clients in a letter that it has asked the Commodity Futures Trading Commission for permission to halt withdrawals.

A liquidity crisis in credit markets has made it "virtually impossible" to properly price and trade securities, leaving highly rated debt trading like junk bonds, Sentinel explained in the letter, a copy of which was obtained by MarketWatch.

"We are concerned that we cannot meet any significant redemption requests without selling securities at deep discounts to their fair value and therefore causing unnecessary losses to our clients," Sentinel said. "We contacted the CFTC today and asked for their permission to halt redemptions until we can honor them in an orderly fashion."

.......

However, Sentinel invested some of its clients cash in debt that had longer maturities. The weighted average maturity of the firm's prime portfolio was 396 months at the end of June, according to its Web site. The longer the maturity, the greater the potential risk.


Let's assume there aren't any off-balance sheet transactions or other accounting funny-business (and there is no reason to think so at this point). Sentinel is saying the market for even solid, high-quality paper is literally frozen right now, that Sentinel can't get a decent bid (offer to purchase) on large amounts of high-quality paper. Assuming that to be true, then the markets have a real problem.

The length of Sentinel's portfolio might be an issue right now, but again assuming they have stayed with their goal of only buying high-quality paper it still seems they should be able to get a decent bid.

I want to add with emphasis, there is no reason to think Sentinel has in any way violated its stated goal of managing funds in a very conservative manner. However, it's also a bit difficult to believe that no one is offering good prices on decent corporate and government paper right now. I'm not saying it can't happen, just that it would indicate a severe constriction in the debt markets.

This situation appears to be a riddle at this point. I'll keep an eye on this situation as it continues.

Wal-Mart And Home Depot Reports Lead to Concerns About Cosumer Spending

From Bloomberg:

Wal-Mart Stores Inc. and Home Depot Inc., the two largest U.S. retailers, said the housing slump, rising mortgage defaults and high energy prices will depress earnings for the year.

``U.S. consumers continue to be under difficult pressure economically,'' Wal-Mart Chief Executive Officer H. Lee Scott said on a recorded call today. ``It is no secret that many customers are running out of money toward the end of the month.''

Wal-Mart, the world's largest retailer, fell $2.29, or 5 percent, to $43.88 at 12:32 p.m. in New York Stock Exchange composite trading for the biggest drop since July 2002. Home Depot fell $1.02, or 2.9 percent, to $34.22. They have declined 15 percent this year.

....

Home Depot Chief Executive Officer Frank Blake said today that the U.S. home-improvement market will ``remain soft'' due to slowing home sales and declining house prices.

Second-quarter net income fell to $1.59 billion, or 81 cents a share. Revenue dropped 1.8 percent to $22.2 billion, the first decline in four years.

Excluding the company's HD Supply unit, earnings were $1.52 billion, or 77 cents a share. On that basis, analysts estimated 73 cents. Sales were predicted to be $22.6 billion.

Sales in stores open at least a year decreased 5.2 percent, the fifth straight decline.


Wal-Mart is by far the largest discount retailer, with a market cap of $189 billion. The next largest is Target with a market cap of $53 billion. According to Wal-Mart's latest annual income statement, they did $348.6 million in sales. Bottom line -- they're a really big company and what they say about the consumer is very important and relevant financial information.

Home Depot is the largest home building store with a market cap of $70 billion. They are almost twice as large as their nearest competitor Lowe's whose market cap is $41.8 billion. According to their latest annual income statement, HD had $90 million in annual revenue. Again -- what they say about the consumer is very important.

Let's relate this to the overall economic picture.

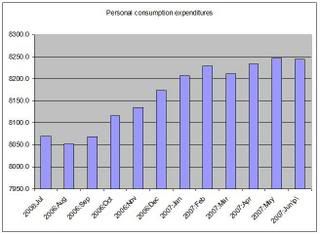
Here's a graph of the last few months reports of personal consumption expenditures from the Bureau of Economic Analysis. These figures are the seasonally adjusted annual rate in 2000 chained dollars. Notice that the figures haven't really moved much in the last 5 months.


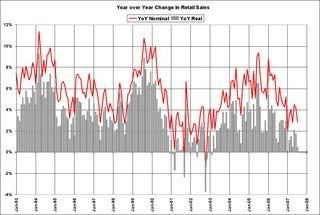
Here is a chart of year-over-year annual change in retail sales from the blog Calculated Risk. The gray bars are retail sales adjusted with the personal consumption deflator. Notice the trend is down both for teh adjusted and unadjusted numbers.


In the latest GDP report, Personal consumption expenditures increased 1.5%. This falls under the luke-warm heading -- not great but not bad. However, it does indicate the consumer is slowing down in his spending for now.

More Fund Problems

From CNBC:

CNBC's Steve Liesman reported that Sentinel Management Group, an Illinois-based money market mutual fund for commodities, has halted redemption in its money market funds. Sentinel said it cannot meet significant redemption requests.

PPI Up .6%

From the BLS:

The Producer Price Index for Finished Goods advanced 0.6 percent in July, seasonally adjusted, the Bureau of Labor Statistics of the U.S. Department of Labor reported today. This increase followed a 0.2-percent decline in June and a 0.9-percent rise in May. At the earlier stages of processing, prices received by manufacturers of intermediate goods rose 0.6 percent in July compared with a 0.5-percent gain in June, and the index for crude materials climbed 1.2 percent subsequent to a 0.3-percent increase a month earlier. (See table A.)


PPI isn't as important an economic indicator as CPI. However, it's important to keep track of where this number comes in to see if producers are passing cost increases off to consumers.

The reporting on the figure was mixed.

From Bloomberg:

Prices paid to U.S. producers rose more than forecast in July on higher fuel costs. Excluding food and energy, the inflation rate was less than predicted.

The 0.6 percent gain followed a 0.2 percent decline in June, the Labor Department said today in Washington. So-called core producer prices that exclude fuel and food rose 0.1 percent, the smallest gain in three months.

The report may help ease the concerns of Federal Reserve policy makers, who reiterated at their meeting last week that inflation remains the biggest risk to the economy. Competition is restraining businesses from raising prices, even as overseas demand boosts raw materials costs.

``Prices look contained at the producer level,'' Chris Rupkey, senior financial economist at Bank of Tokyo-Mitsubishi UFJ Ltd. in New York, said before the report. ``It doesn't look like pipeline pressures are strong enough to push up prices at the consumer level that the Fed is concerned about.''


However, CBS.Marketwatch reported:

Led by a 2.5% increase in energy prices, wholesale prices increased a larger-than-expected 0.6% in July, the Labor Department reported Tuesday.

Wholesale food prices fell 0.1%, the third straight decline after hefty increases at the beginning of the year.

Excluding food and energy prices, the core producer price index increased 0.1%, as expected.

Economists surveyed by MarketWatch were expecting the PPI to rise 0.3% in July after a 0.2% decline in June.

Producer prices are up 4% in the past year, while core prices are up 2.3%, the biggest gain in nearly two years.

The report shows a mixed picture on wholesale inflation, with firms largely unable to pass along the higher costs they pay for crude materials and partially processed goods. Crude goods prices rose 1.2% in July, while prices for intermediate goods needing further processing rose 0.6%.


Simply eyeballing the last 6 months of total figures, this month's number appears to be right around the average.

Same report -- two different interpretations. As of this writing, the SPYs are down .54%.

Future Interventions -- Not Rate Cuts -- Are Possible

From the WSJ:

As strains in financial markets eased yesterday, the Federal Reserve, the European Central Bank and the Bank of Japan breathed sighs of relief and scaled back their injections of cash into money markets. But they said they remain poised to act again if necessary.

"Money-market conditions are normalizing and...the supply of aggregate liquidity is ample," said the ECB, which has been the most aggressive of the major central banks in trying to keep short-term market interest rates from rising above its target.

...

The Fed and the ECB -- playing the traditional role of central banks as lenders of last resort -- have been responding to an apparent shortage of lendable funds in their markets, exacerbated in part by a widespread reluctance to accept mortgage-backed securities as collateral in the wake of rising defaults on home loans. The spread of complex, hard-to-value securities has complicated matters, increased uncertainty and threatened to make it hard to borrow against good collateral.


Over the last 4-5 trading days we've seen European and American central banks perform the largest cash infusion since 9/11. The reason for the infusions was the price of short-term loans (30 days or less) spiked as banks became more reluctant to make loans to each other. This round appears to be over. However, there are still many questions left.

For example, suppose there is another round of problems at hedge funds, insurers or banks? Right now we simply don't know the extent of subprime ownership. They have spread all over the globe and are held by a variety of institutions (to get an idea for the geographic breadth of the problem go to this interactive FT map). The possibility of a fund announcing major problems right now is still high.

And central banks are faced with a policy dilemma. Under Greenspan, the Fed developed a policy of lowering rates whenever there was a financial crisis. This led to the term Greenspan Put or the less flattering nick-name easy Al. Regardless, Wall Street got used to being bailed out with lower interest rates.

This led to the term moral hazard:

Moral hazard is an old economic concept with its roots in the insurance business. The idea goes like this: If you protect someone too well against an unwanted outcome, that person may behave recklessly. Someone who buys extensive liability insurance for his car may drive too fast because he feels financially protected.

These days, investors and economists use the term to refer to the market's longing for Federal Reserve interest-rate cuts. If investors believe the Fed will rescue them from their excesses, people will take greater risks and, ultimately, suffer greater consequences. Some grumble that the Fed created problems this way in 1998, 1999 and 2003.

If the Fed were to cut rates now, it certainly could help with the current market crisis. The cheaper money would reduce pressure on stock and bond markets by making it easier to buy beaten-down stocks, bonds and other securities world-wide. Wall Street is a powerful lobby in Washington, and its bleating for help can be hard to resist for politicians, whose campaigns often depend on financial contributions from Wall Street figures.

But if the Fed were to ride to the rescue, the skeptics worry, it would encourage people to speculate even more, creating an even bigger bubble later.

"You don't want to see the Fed bail out these guys who have made a lot of money. They have made their bed and you want to see them lie in it," says a veteran trader at a New York brokerage house. "Then again, you don't want to see the economy go into recession."


But Bernanke may be different. The Fed's policy announcements for the last 6 months have consistently stated the following:

......the Committee's predominant policy concern remains the risk that inflation will fail to moderate as expected. Future policy adjustments will depend on the outlook for both inflation and economic growth, as implied by incoming information.


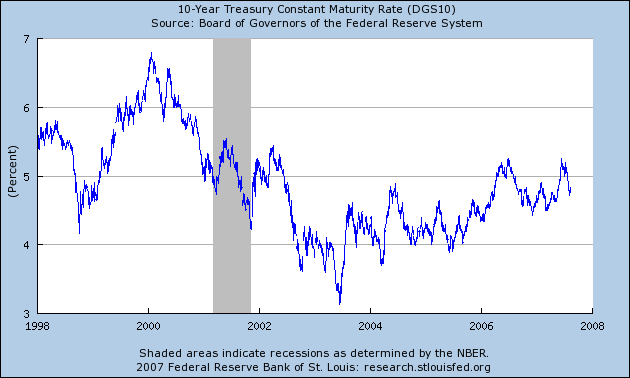
The Fed has consistently said it's primary policy goal right now is price stability. That means keeping rates where they are. I should also add that interest rates aren't that high right now. Here's a 10-year chart of the 10-year Treasury. Rates were a lot higher at the end of the 1990s when the economy was expanding faster than it is now.


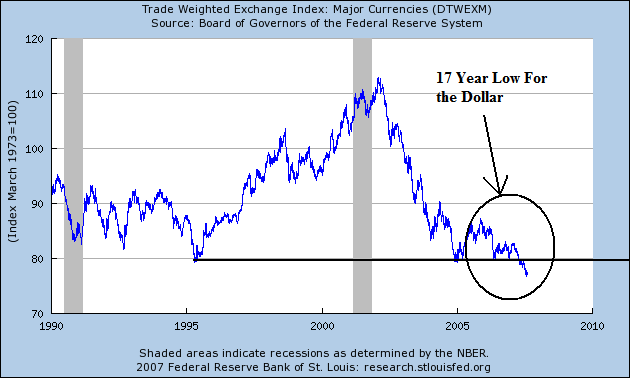
In addition, those arguing for a rate cut are ignoring this long-term chart of the dollar:


While I am just as guilty of making fun of Bernanke as the next guy, I honestly don't think Bernanke is going to lower rates barring a major catastrophe. Interventions? Yes; that's the Fed's job. But rate cuts? Not unless the crisis gets a whole lot worse.

Monday, August 13, 2007

Australian Lender Takes A Hit

From Bloomberg:

Shares of RAMS Home Loans Group Ltd., a Sydney-based mortgage lender, slumped after the company said the shakeout in global debt markets may cut earnings.

Yield spreads on its A$6.2 billion in U.S. commercial loans were higher than forecast and the impact on 2008 profit ``is likely to be material,'' the company said in a statement today.

Market Internals Are Still Weak

These charts are from stockcharts.com

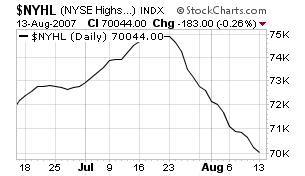
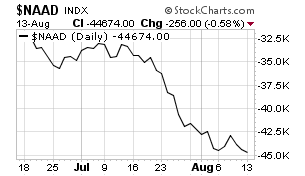
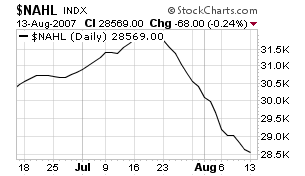
This indicate the internal condition of the markets is still weak.

The New York Advance/Decline Line is still trending slightly lower.


The New York High/Low is still heading lower


The NASDAQ advance/decline is still heading lower


And the NASDAQ new high/new low is still heading lower


These are not bullish charts in any way.

Today's Markets

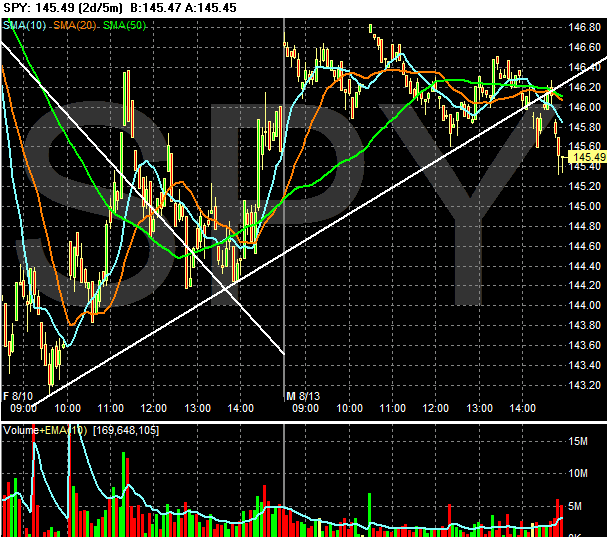
The SPYs traded in a range today. They opened higher, but couldn't move much beyond their opening spike. Also notice the average broke a two day uptrend in the last hour of trading and then sold-off at the end of high volume. This indicates traders are still nervous about the underlying situation.


Here's a 6-day chart. I put this up merely to put today's action in perspective. After last week's roller coaster ride today was remarkably quiet.


Here's the daily chart, which shows the SPYs are still clinging to the 200-day SMA. In other words, we're not out of the woods by a long shot.

Why There Is Still Risk Out There, Especially In Financials

Yesterday I commented on the technical reasons why the financials may rebound. Technical analysis is a self-fulfilling discipline. Because people/traders/computer models pay attention to it, understanding technical buy and sell signals can explain why the market may behave in certain ways. Yesterday's chart showed there are technical reasons for moving into financials.

I will also add that I started the post with this observation:

The fundamental side of the financials is terrible. For the last month or so we have seen bankruptcies, fund blow-ups and bail-outs.


Like an good economist or lawyer, I of course qualified my answer.

Here is one of the fundamental reasons that may effect the financials in the coming quarters:

As the leveraged buyout boom peaked earlier this year, large banks such as Citigroup (C) and JPMorgan Chase (JPM) indulged powerful private equity clients by granting them temporary equity, or bridge loans, to help fund the monster deals.

.....

In theory, a bridge loan is similar to a home buyer who takes out a short-term loan to cover the down payment, which he plans to repay as soon as he sells his current home. But what if the current home can't be resold? The lender can try to resell the loan, but as current market conditions suggest, that isn't always possible. Banks now face a similar quandary. They lent private equity firms hundreds of millions of dollars to use as equity in the buyouts. The bridge loans were supposed to be repaid as soon as the buyout firms found other investors who wanted an equity stake in the leveraged buyouts. But as market conditions have tightened, private equity firms have found it difficult to find investors to take some of the bridge loans from the banks. The banks can keep trying to sell the loans, a tough bet in the current market. Or they can keep them on their books—and possibly have to write down their value.

....

JPMorgan and Citi declined to comment beyond their previous public statements. Bank of America (BAC) officials referred inquiries to the company's second-quarter conference call on July 19, during which executives declined to specify the bank's exposure.


The bottom line is there is a reason why traders have sold their financial shares over the last month or so. If you're reentering the financials, pay particular attention to their balance sheet.

The Argument For A Rebound

There were several pieces over the weekend which argued for a rebound. Barron's ran an article (subscription required) arguing that some cash rich companies look attractive. CBS Marketwatch ran a story that said Google and Cisco don't have mortgage market exposure and that the tech sector looked interesting.

I will add this word of caution. Warren Buffet said, "When others are greedy I try to be fearful, and when others are fearful I try to be greedy." Well, right now there is a lot of fear. However, there is also a ton of volatility. I don't think we're out of the woods yet by a long shot. And until we are, expect more extreme market gyrations.

In other words, if you're going to move into the market, there are some good fundamental reasons to do so. But make sure you can take the ride we're probably going to have in the next few months.

Retail Sales Up

From the Census Bureau:

The U.S. Census Bureau announced today that advance estimates of U.S. retail and food services sales for July, adjusted for seasonal variation and holiday and trading-day differences, but not for price changes, were $376.1 billion, an increase of 0.3 percent (±0.7%)* from the previous month and 3.2 percent (±0.8%) above July 2006. Total sales for the May through July 2007 period were up 4.1 percent (±0.5%) from the same period a year ago. The May to June 2007 percent change was revised from -0.9 percent (± 0.7%) to -0.7 percent (± 0.2%).


There is one very important point from the above paragraph. These figures are not adjusted for price changes. But the July inflation report isn't out yet. So, we don't know how much to adjust these figures yet. However, we do know these figures will be lower by some amount in the next few days. So, realize these figures are incomplete right now.

Here's what Bloomberg said about the report:

Aug. 13 (Bloomberg) -- U.S. retail sales rose more than forecast in July, a signal that consumer spending will moderate, not collapse, as the housing recession persists.

The 0.3 percent increase followed a revised 0.7 percent decline the prior month that was smaller than previously estimated, the Commerce Department said today in Washington. Purchases excluding automobiles climbed 0.4 percent after falling 0.2 percent.


They gave the IPhone credit for a 1% increase in sales at electronics stores.

However, car sales are still sagging:

The 0.3 percent rise in overall retail sales last month was slightly better than the 0.2 percent gain that had been expected. It was driven by increased demand for electronics gear and appliances, furniture and clothing. These increases helped to offset a 0.3 percent slump in sales at auto dealerships which followed an even bigger 2.9 percent drop in June.


I have speculated that weak car sales are a sign of consumer concern, that the consumer doesn't want to make a big purchase right now.

This isn't a bad report, but it's not great either. I would put this under, "things are luke-warm right now".

ECB Injects More Liquidity

From the WSJ:

In its third consecutive unscheduled cash injection, the ECB pumped €47.665 billion ($65.28 billion) into euro zone money markets. That follows the €156 billion the bank put into markets last week as overnight lending rates shot up on concerns about European banks' exposure to the U.S. subprime market. The Fed injected $38 billion on Friday, following a $24 billion intervention Thursday.

"The ECB notes that money market conditions are normalizing and that the supply of aggregate liquidity is ample. With this fine tuning operation, the ECB is further supporting the normalization of conditions in the money market," the ECB said in a statement. The Bank of Japan added 600 billion yen ($5.06 billion) on Monday.


The ECB has added a ton of money into the system to ease fears. This is what a central bank is supposed to do. However, a question now emerges: what if another big problem emerges? Will any future ECB actions be considered credible by the market players in all of this? Or will further liquidity be seen as an attempt to throw money at the problem?

Sunday, August 12, 2007

Two More German Banks Announce Problems

From Bloomberg:

WestLB AG, Germany's third-largest state bank, has 1.25 billion euros ($1.7 billion) invested in securities linked to the U.S. subprime mortgage market.

``We're relatively relaxed regarding the long-term valuation of our securities because of their high underlying quality,'' spokesman Hans Obermeier said in an interview today. Of the subprime securities, 98 percent are rated A or better and 87 percent AA or better, he said.

WestLB on Aug. 9 said the bank, including its Brightwater Capital Management unit, isn't facing a ``liquidity crisis,'' rebuffing a report about possible losses at the New York-based division. Late payments on U.S. subprime mortgages to borrowers with poor credit histories are at their highest since 2002, driving down the value of bonds backed by home loans and causing turmoil in credit markets.


From Bloomberg:

Deutsche Postbank AG, Germany's biggest consumer bank by clients, has about 800 million euros ($1.1 billion) of investments linked to U.S. residential mortgages, including subprime loans.

The lender last week moved 600 million euros of investments, including 200 million euros in subprime-related securities, on to its own balance sheet, Postbank spokesman Joachim Strunk said. The 600 million euros stem from liquidity lines to two special- purpose vehicles run by Rhineland Funding Capital Corp., the U.S.-based company whose subprime woes led to a government- sponsored bailout of IKB Deutsche Industriebank AG.

``We still don't see any material effects from our property- related investments,'' Strunk said. Postbank remains ``convinced of the quality of these papers,'' all of which are rated AAA and AA, the highest investment grades, he said.


These are big banks. While the banks official statements regarding this exposure is one of calm, these banks are not going to say, "we've got major problems" -- at least not yet.

The Current Problem in a Nutshell

From CNBC

Until more information is available on the scale of exposure to complex debt derivatives created in the U.S. subprime market and sold worldwide, analysts said it will be hard to restore a lasting investor calm.

Mark to Market May Be A Good Or A Bad Thing....

From theStreet.com

In the coming week, many fund managers may see their day of reckoning: July's month-end portfolio evaluations by prime brokerage firms that lend to these funds will include some of these best attempts at valuations. Many investors have pointed to Aug. 15 as a day to watch, as margin calls and collateral requirements issued then could generate some forced selling of more liquid assets.

With the Securities and Exchange Commission now combing through Wall Street brokerage firms' books to ensure they are being consistent in their accounting methodology, the pressure will likely be on for these firms to be conservative in their valuations.

This could well mean more hedge fund blowups and cascading, fear-driven selloffs. It may also mean more declines for the financial sector, particularly brokerage houses like Bear Stearns (BSC - Cramer's Take - Stockpickr - Rating), Lehman Brothers (LEH - Cramer's Take - Stockpickr - Rating), JPMorgan (JPM - Cramer's Take - Stockpickr - Rating), Morgan Stanley (MS - Cramer's Take - Stockpickr - Rating) and Goldman Sachs (GS - Cramer's Take - Stockpickr - Rating), among others.

Will The Financials Rebound?

The fundamental side of the financials is terrible. For the last month or so we have seen bankruptcies, fund blow-ups and bail-outs.

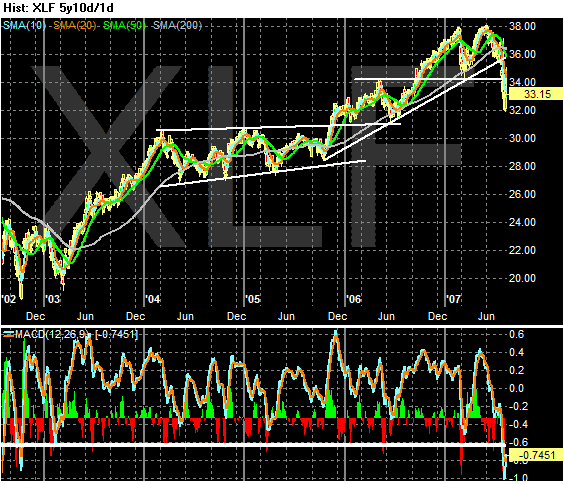
However, the technical side of the financials is bullish right now. Here is the daily chart. Pay particular attention to the MACD reading which is very oversold. The MACD hasn't been this low on the daily chart in 5 years. The last two times the index was at these levels the market rallied 4 1/2 points (2002) 6 points (2003).


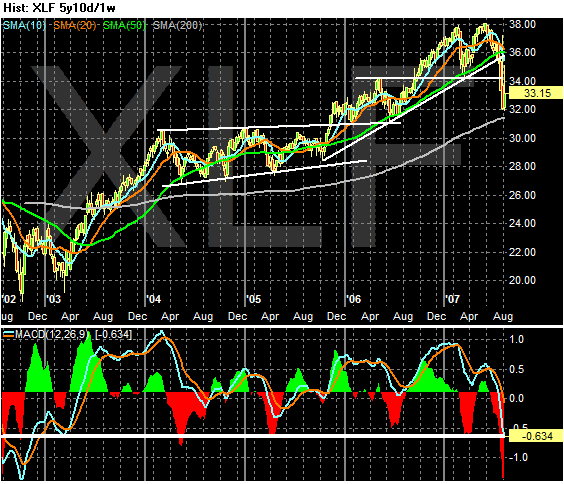
Now here is the weekly chart over a 5-year period. Notice the exact same reading of the MACD.


I am not making a recommendation either way; I'm simply relaying what the charts are saying.

The Week Ahead

OK -- It's Sunday and we need to start looking at the upcoming week.

1.) Expect a lot of volatility. The bottom line is we don't know when the credit markets will settle down. My guess is it's going to be a while. We simply don't know how much damage the subprime issue is going to do. The Financial Times said it best:

Investors are braced for a turbulent start to trading on Monday and this week’s data releases will take second place as fears over a liquidity crisis persist.

Last week saw a serious liquidity squeeze in money markets and short-term money rates rose higher as institutions’ willingness to lend evaporated.


The Financial Times also has a really good interactive graphic that shows how this mess has moved across the globe (thanks to the Big Picture for posting this). The bottom line is the problem is in the "getting worse" stage and probably will be for awhile.

2.) PPI comes out on Tuesday and CPI comes out on Wednesday. If these numbers are below consensus estimates, expect the markets to start arguing for a rate cut and for prices to rally. Given the dollar's current situation I don't see how the Fed can think about doing this. Also remember this part the Fed's statement from last week:

Although the downside risks to growth have increased somewhat, the Committee's predominant policy concern remains the risk that inflation will fail to moderate as expected. Future policy adjustments will depend on the outlook for both inflation and economic growth, as implied by incoming information.


When the Fed made this statement, the credit markets were already frozen. Given the Fed's position in the economy, I have to think they knew about the Countrywide/WAMU announcements early in the week before both companies formally made the announcements. While the Fed added liquidity on Friday, I think that's about all they're going to do right now. Bernanke has continually stated he believes the US financial system is strong implying the US will be able to withstand the pressure the credit mess is currently creating. While I wouldn't be surprised to see the Fed add more liquidity, I'm not expecting them to cut rates.

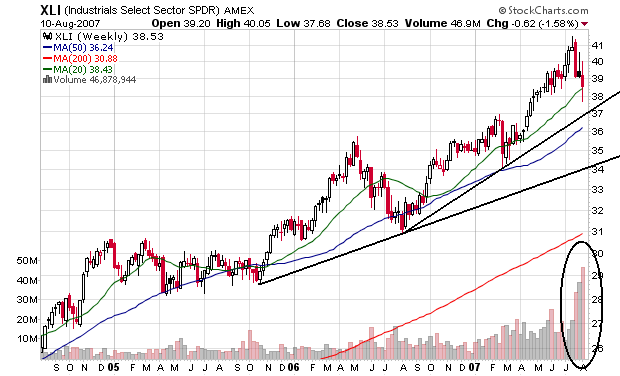
3.) The Empire State Index, Industrial Production and the Philly Fed Survey are also on tap this week. Exports have been one of the bright spots in the US economy over the last few months/quarters. If these reports show weakness expect added volatility. Here is a chart of the XLIs (Industrials) that I posted yesterday. While the chart isn't great, it's technically not in a horrible place. My guess is the losses over the last three weeks are advantageous profit taking rather than concern over the sector. However, if the previously mentioned numbers are weak this sector might take a hit.


4.) We're on a roller coaster folks. It's going to be crazy for awhile. Get out the antacid of your choice and keep it handy.