- by New Deal democrat
As I noted again yesterday, house prices lag home sales, which in turn lag mortgage rates. Yesterday we got the final February reading on sales. This morning we got the final January read on prices, for repeat sales of existing homes.
Last week’s report on existing home sales showed a sharp increase in February, a repeat of the seasonally adjusted sharp increase last February, which was almost completely taken back over the next two months. YoY sales remained down by over 3%, but the median price of an existing home remained higher by 5.7% - very much *unlike* new homes, where sales have firmed, but price remain almost 20% down from their peak.
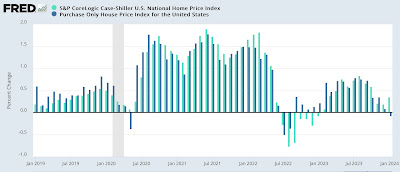
This morning the FHFA purchase only price index through January declined -0.1% on a seasonally adjusted monthly basis, while the YoY gain decelerated from 6.6% to 6.3% YoY. Meanwhile the Case Shiller National index declined -0.4% for the month of January on a seasonally adjusted basis, but accelerated from 5.1% to 6.1% YoY. Since the FHFA index (dark blue) has frequently led the Case-Shiller index (light blue) at turning points by a month or two, I put more weight on that Index.
But first, here’s what the monthly numbers look like for the past five years:
Next, here is the long term graph of both of them below, compared with the CPI for shelter (red, *2.5 for scale) shows that the YoY gain particularly in the FHFA index is actually similar to gains during the majority of the past 25 years outside of recessions:
Here’s the close-up view of the last five years, better to show the current trend in both prices and shelter inflation:
For the next seven months the comparisons will be against an average 0.7% increase per month in 2023. Because house price indexes have shown a demonstrated lead over shelter costs as measured in the CPI, if present trends continue, as these YoY comparisons drop out, the YoY deceleration in OER in the CPI index should continue towards its more typical rate of between 2.5% to 4% YoY in the ten years before the pandemic. How soon it gets there will have a lot to do with when the Fed might begin to lower interest rates.


