Friday, April 19, 2024

The bifurcation of the new vs. existing home markets continues


 - by New Deal democrat


The bifurcation of the new vs. existing home markets continued in March, per the report on existing home sales and prices yesterday. Remember that, unlike existing homeowners, house builders can vary square footage, amenities, lot sizes, and offer price and/or mortgage incentives to counteract the effect of interest rate hikes.

On a seasonally adjusted basis, existing home sales declined from 438,000 to 419,000 in March. But this is well within the seasonally adjusted range of the past 16 months (gray, right scale in the graph below){also, note I am using Trading Economics graphs due to restrictions put on FRED by the Realtors; also note difference in scales):


At their worst seasonally adjusted levels last year, existing home sales were down over 40% from their 2021 peak. Meanwhile new home sales (blue, left scale), at their low in July 2022 down almost 50% from their 2021 peak, responded to mortgage rates by rebounding during much of last year before fading again in the past few months. They are presently down 35% from peak.

Some of the difference in trajectories between new and existing home sales can be explained by prices. Because so many homeowners have been frozen in place by their existing 3% mortgages, the inventory of existing homes for sale remains low, and that has driven prices higher almost consistently since the onset of the pandemic:


Although I can’t show you a graph, similar to the trajectory of the FHFA and Case Shiller repeat sales indexes, the median price for existing homes briefly turned negative in early 2023, troughing at -3.0% YoY in May. Thereafter YoY comparisons increased to a peak of higher by 5.7% in February. In March median prices were higher by 4.8%, which may or may not just be a pause.

Meanwhile the median price for new houses was down by -7.6% YoY in February. The below graph shows actual median prices for the last 5 years of new homes vs. the last 12 months (all that Realtor.com allows FRED to publish) of existing homes:


Median existing home prices are currently about 40% higher than their immediate pre-pandemic level, while new home prices are about 30% higher. 

Ultimately both the new and existing home markets are driven by mortgage rates. With a diminished supply of existing homes (because of prospective sellers being frozen in place by their current mortgage rates), their relative scarcity has driven prices comparatively higher than for new homes, especially as builders have moved aggressively to bring the purchase price of new homes down. This bifurcation will continue until the Fed moves significantly on rates.

Thursday, April 18, 2024

Initial jobless claimZzzzzzzzzz . . . .


 - by New Deal democrat


For the last 8 months, initial and continuing claims have been remarkably consistent. Initial claims have varied between 194,000 and 228,000, and continuing claims have with the exception of three weeks right at the new year varied between 1.787 million and 1.829 million.


That rangebound trend continued this week as initial claims were unchanged at 212,000, and the four week average was also unchanged at 214,500. With the usual one week delay, continuing claims rose 2,000 t0 1.812 million:


Indeed, with the exception of last spring, initial claims have been essentially rangebound for the entire last 2 years!

For forecasting purposes, the YoY% change is more important. There, initial claims are down -5.5%, the four week average down -3.8%, and continuing claims are higher by 4.3% — still the lowest YoY reading for continuing claims in the past 13 months:


Needless to say, this suggests continued economic expansion in the next few months.

A reader over at Seeking Alpha several weeks ago asked what these looked like compared with population, since that is a more true measure of the tightness of the jobs market. Here’s the post-pandemic look:


The 4 week average of initial claims is 0.13% of the entire civilian labor force, while continuing claims are 1.1%.

Let’s compare that with the entire pre-pandemic record:


The 4 week average of initial claims is tied with the lowest ever pre-pandemic reading it had in 2019, while continuing claims are lower than the entire 50+ year pre-pandemic period except for 2017-19.

This in short remains a very tight labor market, where finding a new job is easier than at almost any time ever before the pandemic.

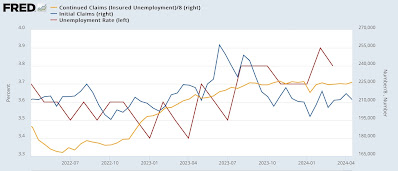
Finally, let’s update the Sahm rule implications with the first two weeks of April under our belt. Remember that both initial and continuing claims lead the unemployment rate, the former by more than the latter:


As per form, the unemployment rate followed jobless claims higher last year. Initial claims are now lower again, and continuing cliams remain flat. This suggests no further upward pressure on the unemployment rate in the months ahead, and likely some downward pressure towards 3.7% or 3.6%. In short, the Sahm rule is not going to be triggered.

Tuesday, April 16, 2024

Industrial production for March is positive, but the overall trend remains flat


 - by New Deal democrat


Industrial production, one of the premier series the NBER has historically used to declare recessions vs. expansions, has faded in importance since China was admitted to regular trading status in 1999. As you can see in the first graph below, both total and manufacturing production peaked in 2007. Further, manufacturing has continued to fade, as its post-pandemic peak has not equaled its 2010’s peak either:


In March, total production increased 0.4% from an upwardly revised, by 0.2%, February; but it is still down -0.6% from its September 2022 post-pandemic peak. Manufacturing production increased 0.5%, but is also down, by -0.2% from its post-pandemic peak as well:


Before the “China shock,” a YoY downturn in industrial production almost always meant recession. As the YoY graph below shows, there was a significant “industrial recession” in 2015-16 without any generalized economic downturn:


Whether the 2019 downturn would have resulted in a recession by itself had the pandemic not intervened will always remain an unanswered question. But again in 2023 production was again down YoY with no recession. As of March, manufacturing production is flat YoY, while total production is now up by 1.0%.

Bottom line: while March was positive, the overall trend remains generally flat.

Simultaneous declines in housing permits, starts, and units under construction in March suggests seasonality glitch, not a change in trend


 - by New Deal democrat


There was a big decline in housing starts last month, and a smaller but significant decline in permits. Whether that signifies a change in trend or just noise is the issue. I lean towards the latter. To wit, in reaction to both January and Feburary’s housing construction report I wrote, “To signify a likely recession, units under construction would have to decline at least -10%, and needless to say, we’re not there. With permits having increased off their bottom, I am not expecting such a 10% decline in construction to materialize.” I also indicated that I expected to see more of a decline in the actual hard-data metric of housing units under construction.

That is still the case.

To recapitulate my overall framework: mortgage rates lead permits, which lead starts, which lead housing units under construction, all of which lead prices. Of those metrics, the least noisy one that conveys the most signal vs. noise is single family permits.

In response to inflation data which generally stopped declining towards the holy 2%, mortgage rates have risen about .25% since the end of last year. For March as a whole, they averaged 6.82%. This is about average for the past 18 months, in which overall they have varied between 6.1% and 7.8%. In response permits have stabilized in the range of 1.42 million to 1.52 million units annualized. In March they declined -65,000 to 1.458 million annualized:


The relationship shows up even better when we compare the two series YoY:


With mortgage rates higher by a slight 0.25% YoY, permits went slightly positive YoY and are still higher by 1.5%.

As per usual, starts (light blue in the graph below) are the noisier of the metrics, declining 228,000 to 1.321 million annualized in March. Permits (dark blue) declined -65,000 to 1.458 million, and single family permits (red, right scale) declined -59,000 to 973,000:


These are among the poorest numbers for each in the past 12 months, but the simultaneity of the downturn (as opposed to a 1-2 month lag in starts) makes me suspect there may be a seasonal adjustment issue in play, perhaps having to do with Easter. Still, there isn’t enough there to break out of their range, and as discussed above mortgage rates have not suggested one is coming.

Next, to reiterate: housing units under construction (red in the graph below) are the best measure of the actual economic activity in the housing market. Here’s the long term historical view:


Those also declined, by -15,000, to 1.646 million units annualized:


Once again note the synchronicity of the downturn, making me suspect a seasonality glitch. Further, they are only down -3.7% from their peak, nowhere near the historical -10% most consistent with the onset of a recession.

Below I have broken out single vs. multi-family construction. Because, in response to record high house prices, builders turned to higher density, lower cost apartment and condo construction. Hence the record high last year in that metric. Last month multi-family construction faded slightly, while single family units under construction actually continued their slightly increasing trend:


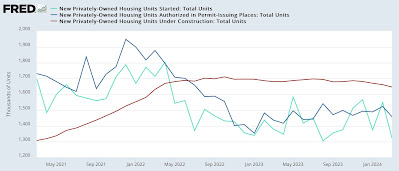
As I wrote last month, I do expect a further gradual decline in total housing units under construction in the months ahead, to catch up with the decline in permits that bottomed one year ago. Here’s the post-pandemic view of starts, permits, and total units under construction:


But, as shown above, I doubt we will cross the -10% threshold that it would normally take to signal a recession, given the general stabilization of both permits and starts over the past 16 months.

Monday, April 15, 2024

Real retail sales rebound, forecast a continued “soft landing” for jobs growth


 - by New Deal democrat


As per usual, real retail sales is one of my favorite indicators, because it gives so much information about the consumer, and since consumption leads employment, it helps forecast the trend in the latter as well.


And the news this morning was good, as nominally retail sales increased 0.7% in March, while February’s number was revised higher by 0.3% to 0.9%. After accounting for 0.4% inflation in March, real retail sales increased 0.3%, and February was revised up to 0.5%.

To the extent there was bad news, it was that January’s -1.2% decline has still not been completely erased.

To the graphs: first, below I show the historical record for the past 15+ years of both real retail sales (dark blue) and real personal spending on goods (light blue), a similar but more comprehensive measure. The two metrics tend to trend together over time, although the latter has tended to increase more (hence I adjust to bring the trends more in line):


Here is the close-up post-pandemic view:


Real retail sales are still -2.9% below their April 2022 peak, and also about -1% below their nearer term August 2023 peak. Real spending on goods has been more positive. More importantly for the long term trend, real spending on goods has now completely caught up with real retail sales. The bigger picture is that real retail sales have trended neutral, while real spending on goods has trended higher.

Turning to the effect on employment, here is the longer term YoY% gains in both spending measures /2, which is the best match to forecast the near term trend in jobs (red):


Employment doesn’t respond to every noisy move in spending, but does tend to peak and trough about 6 months after spending, and responds to the longer term trend. If FRED allowed 6 or 12 month moving averages, the correspondence would be much closer.

With that caveat, here is the post-pandemic close up:


Historically negative YoY comparisons in real retail sales have usually meant recession, while positive comparisons have almost always meant continued expansion. Needless to say, that didn’t happen in 2022-23. The overall trend since mid year 2023 has been “less negative” to neutral, while real spending on goods has remained positive.

And as those YoY comparisons in consumption have improved, we have seen the decelerating trend in employment shift to a more consistent “soft landing” scenario. Thus real retail sales are forecasting continued growth in the neighborhood of the last few months’ numbers going forward through most of this year.