Saturday, March 30, 2024

Weekly Indicators for March 25 - 29 at Seeking Alpha


 - by New Deal democrat


My “Weekly Indicators” post is up at Seeking Alpha.


After several weeks of flirting with full recovery, the remaining regional Fed’s weighed in with their monthly manufacturing indexes, and they all went in the tank again. On the bright side, payroll tax withholding has had its best month in the fiscal year so far.

As usual, clicking over and reading will bring you up to the virtual moment with the economic data, and reward me a little bit for my efforts in organizing it for you.

Friday, March 29, 2024

Real personal income and spending: if last month was “Goldilocks”, this month was close to “anti-Goldilocks”


 - by New Deal democrat


Personal income and spending has become one of the two most important monthly reports I follow, because it nets out the impacts of higher interest rates and abating inflation due to the unlinking of the supply chain. To repeat, the big question this year is whether the contractionary effects of Fed tightening have just been delayed until this year, or whether the fact that there have been no rate hikes since last summer mean that the expansion will strengthen.

Because real personal spending on services for the past 50 years has generally risen even during recessions, the more leading components of this report have to do with spending on goods. Additionally, there are several components that form part of the NBER’s “official” toolkit for determining when and whether a recession has begun, including real spending minus government transfers, and real total business sales.

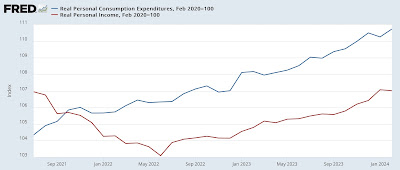
In February, nominally income rose 0.3%, while nominal spending rose a sharp 0.8%. Prices as measured by the PCE deflator increased 0.3% for the month, meaning that in real terms income were unchanged and spending (after rounding) rose 0.4%. Since just before the pandemic real incomes are up 7.0%, and spending is up 10.7% (NOTE: Data in all graphs below except for YoY comparisons, and the personal saving rate, is normed to 100 as of just before the pandemic):


On a YoY basis, the PCE price index is up 2.5%, just above January’s three year low of 2.4%. In the previous 16 months, the YoY measure had been declining at the rate of 0.25%/month, suggesting that it would hit the Fed’s 2.0% target this spring:


This month’s slight increase is probably just noise due to rounding, as the monthly change in the YoY rate was only 0.02%.

As I indicated above, for the past 50+ years, real spending on services has generally increased even during recessions. It is real spending on goods which declines. Last month real services spending rose 0.6%, while real goods spending rose 0.1%:


As per form, real services spending has risen consistently since the pandemic, while goods spending has been somewhat of a mirror image of gas prices, which peaked in June 2022.


Real durable goods spending tends to turn before non-durable goods spending. The former rose 1.2% for the month, reversing about half of January’s very sharp decline, while the latter declined -0.6% for the second such drop in a row:


Durable goods spending had been very much affected over the past several years by the shortage of new vehicle inventory, which has largely abated as 2023 progressed.

Another important metric for the near future of the economy is the personal savings rate. In February it declined -0.5% from an upwardly revised January’s rate of 4.1% to 3.6%. This longer term look shows how the present compares with the all time low rate of 1.4% in 2005:


On the positive side, the declining trend in this rate since last May indicates a lot of consumer confidence. But on the negative side it remains close to the all time low readings of 2005-07, indicating vulnerability to an adverse shock. One of my forecasting models uses such a shock as a recession warning indicator. In any event, there is no such shock indicated at the moment.

Also as indicated above, the NBER pays particular attention to several other aspects of this release. Real income excluding government transfers (like the 2020 and 2021 stimulus payments) declined -0.1% for the month, the first such decline since November 2022:


This has been something of a mirror image of gas prices, which not coincidentally have been rising sharply in recent weeks.

Finally, the deflator in this morning’s report is used to calculate real manufacturing and trade sales (with a one month delay), another metric relied upon by the NBER. This declined sharply for January, by -1.4%, more than reversing December’s downwardly revised 0.7% increase:


I described last month’s report as being pretty close to “Goldilocks.” Well, this morning’s report for February was something of “anti-Goldilocks.” Real spending on durable goods is off peak for the second month in a row. Inflation YoY did not decelerate further. Real business sales also declined sharply. Spending rose - the most significant continued positive in the report - because consumers went into their savings. 

While, as I noted above, it could just be noise, there is some evidence of a real slowing in YoY spending on goods in general and durable goods in particular:


As this has historically been the first sign of consumer distress, it will need to be watched extra carefully.

Thursday, March 28, 2024

Initial claims remain somnolent, while continuing claims pop slightly


 - by New Deal democrat


The divergence in the trends between initial and continuing claims continued this week, as the former continued their somnolent good news, while the latter had a slightly disconcerting pop.

Initial claims declined -2,000 to 210,000, and the four week average declined -750 to 211,000. On the other hand, with the usual one week delay, continuing claims rose 24,000 to 1.819 million:


The first two are in the same range they have been in for the past 4 to 6 months, while continuing claims are at their highest number but for 2 weeks in the past two years.

On the more important YoY basis for forecasting purposes, initial claims are down -9.5%, and the four week average is down -7.0%, the best YoY comparison in the past 12 months. Continuing claims are up 7.2%, but this is the second lowest YoY comparison in the past 12 months:

.

Now let’s update the forecast of the Sahm rule. With last month’s 2 year high in the unemployment rate, I’ve been wondering whether, because unemployment includes both new and existing job losses, it followed continuing claims more than initial claims (although initial claims leads both). The historical graphs, which I posted two weeks ago so I won’t repeat now, indicated that continuing claims also lead the unemployment rate, although with much less of a lead time.

With that in mind, here is this week’s update of the post-pandemic record for the past two years on a monthly YoY% basis (unemployment rate YoY shown in red):


Since on a monthly basis so far initial claims are significantly lower YoY, and continuing claims a little over 7% higher, I expect the unemployment rate to be either unchanged or slightly higher YoY in the next several months. This would take it back down to the 3.7% area.

Here’s the same comparison on an absolute rather than YoY basis:


This similarly suggests a slight decline in the unemployment rate to 3.7% or 3.8%. Since the lowest three month average of the unemployment rate in the past 12 months was 3.5%, it would take an increase to 4.0% averaged over three months to trigger the Sahm rule. Both initial and continuing claims indicate that is not going to happen in the immediate future.

Wednesday, March 27, 2024

A detailed look at manufacturing, and an update on frieght


 - by New Deal democrat


As I wrote on Monday, the big question for this year is whether the recessionary effects of the Fed rate hikes have just been delayed, or whether, because the rate hikes have stopped, so has the headwind they normally produce. Watching manufacturing and construction, especially housing construction, is what I expect to supply the answer.


On Monday I focused on housing construction and sales. Since there’s no big economic news today, let’s take a more detailed look at manufacturing.

There are three manufacturing metrics that are “official” components of the index of Leading Economic Indicators: the ISM manufacturing new orders subindex, average weekly hours of manufacturing workers, and capital goods new orders. Note that since manufacturing makes up less of the US economy than it did in the 20th century, it takes a steeper downturn in these components to be consistent with a recession than it used to.

Let’s start with the ISM manufacturing index and its new orders component, which were last updated at the beginning of this month:


These are in a definite uptrend, although neither has definitively broken above the dividing line of 50 which separates expansion from contraction.

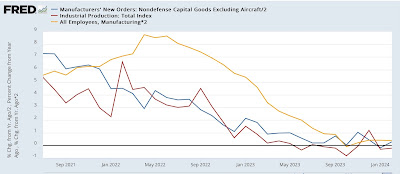
Next, let’s compare capital goods new orders, which were reported yesterday for February (dark blue), with industrial production (red), a premier coincident indicator, and also manufacturing employment from the payrolls survey (gold), all YoY for easier comparison. First, here’s the historical look:


Note that capital goods orders are very noisy (one reason I typically don’t highlight them), and did not turn negative in advance of the Great Recession. Nevertheless, they generally do turn in advance of industrial production, which typically turns in advance of manufacturing employment.

A similar dynamic has existed since the pandemic:


YoY gains in new capital goods orders decelerated first, followed by industrial production, followed last by manufacturing employment. The two first metrics are generally flat YoY, and manufacturing employment is only slightly positive.

Now let’s compare the average manufacturing workweek (black) with capital goods orders, both again YoY and first historically:


The average manufacturing workweek is even more leading than capital goods orders, turning first, but is even more noisy, and over-sensitive to the downside. That is, sharp declines in manufacturing hours always happen before recessions, but a downturn in hours frequently does not presage a recession at all.

Here’s the post-pandemic look at these two metrics:


Hours turned negative first, and if anything are getting “less bad” in recent months, while capital goods new orders, as already indicated, are essentially flat YoY.

Put the data together, and you get a relatively mild manufacturing recession in 2023, which appears to be recovering this year, as the ISM new orders index and the manufacturing workweek are trending higher (if not positive yet), while capital goods orders and production are flat. Manufacturing employment growth -the least leading metric - appears still to be decelerating. 

Before I conclude, let’s take a brief updated look at transportation. Remember, the theory is that everything that is produced must be shipped to market. So to confirm a trend, both should be moving in the same direction.

Here is the Freight Transportation Index through January (dark blue), the noisier and more negatively biased Cass Transportation Index (light blue), compared with heavy weight truck sales which has been an excellent leading indicator (red):


In February, preliminarily there was a steep drop in excess of -3.5% in the Freight Transportation Index, but it has not been updated at FRED, possibly because at least one component (air freight) was withheld pending further seasonal adjustments.

There was a steep drop off in all of these metrics late last year following the Yellow Freight bankruptcy. The Cass Index and truck sales may be showing the beginning of a recovery from that, although the data is too noisy to say anything definitive.

One final note: we’ll bet a detailed updated look at the spending side of construction and production via the personal spending report this Friday.
Tuesday, March 26, 2024

Repeat home sales price declined slightly in January; expect deceleration in the CPI measures of shelter to continue


 - by New Deal democrat


As I noted again yesterday, house prices lag home sales, which in turn lag mortgage rates. Yesterday we got the final February reading on sales. This morning we got the final January read on prices, for repeat sales of existing homes.

Last week’s report on existing home sales showed a sharp increase in February, a repeat of the seasonally adjusted sharp increase last February, which was almost completely taken back over the next two months. YoY sales remained down by over 3%, but the median price of an existing home remained higher by 5.7% - very much *unlike* new homes, where sales have firmed, but price remain almost 20% down from their peak.

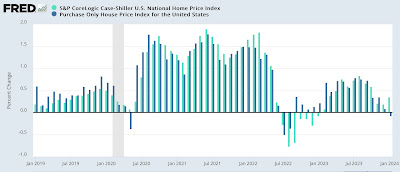
This morning the FHFA purchase only price index through January declined -0.1% on a seasonally adjusted monthly basis, while the YoY gain decelerated from 6.6% to 6.3% YoY. Meanwhile the Case Shiller National index declined -0.4% for the month of January on a seasonally adjusted basis, but accelerated from 5.1% to 6.1% YoY. Since the FHFA index (dark blue) has frequently led the Case-Shiller index (light blue) at turning points by a month or two, I put more weight on that Index.

But first, here’s what the monthly numbers look like for the past five years:


Next, here is the long term graph of both of them below, compared with the CPI for shelter (red, *2.5 for scale) shows that the YoY gain particularly in the FHFA index is actually similar to gains during the majority of the past 25 years outside of recessions:


Here’s the close-up view of the last five years, better to show the current trend in both prices and shelter inflation:


For the next seven months the comparisons will be against an average 0.7% increase per month in 2023. Because house price indexes have shown a demonstrated lead over shelter costs as measured in the CPI, if present trends continue, as these YoY comparisons drop out, the YoY deceleration in OER in the CPI index should continue towards its more typical rate of between 2.5% to 4% YoY in the ten years before the pandemic. How soon it gets there will have a lot to do with when the Fed might begin to lower interest rates. 

Monday, March 25, 2024

As mortgage rates remain rangebound, so do new home sales


 - by New Deal democrat


Let’s begin this post by putting why I am watching new home sales in context.

The economy was kept out of recession last year, despite aggressive Fed rate hikes, in large part by commodity price deflation, much or most of which was triggered by the un-kinking of supply chains after the pandemic. That gale force economic tailwind is gone, but the Fed rate hikes remain. So the big question for this year is whether the effects of the Fed rate hikes have just been delayed, or whether, because the rate hikes have stopped, so has the headwind they normally produce. Watching manufacturing and construction, especially housing construction, is what I expect to supply the answer.

So, to the data, starting with my usual caveat: while new home sales (blue in the graphs below) are the most leading of the housing metrics, they are noisy and heavily revised. There was little this month, as January was only revised higher by 3,000 to 664,000. February gave back -2,000 of that, coming in at 662,000 annualized. In the below graph I also show th slightly less leading but much less noisy single family permits (red, right scale):


Before I discuss this graph a little further, let’s compare sales with the even more leading metric of mortgage rates. Both are shown YoY (rates inverted, and *100 for scale):


Except for the distortion created by the pandemic shutdowns in spring 2020 and the YoY comparisons in spring 2021, we see that new home sales have almost simultaneously followed the trajectory of mortgage rates: the higher the mortgage rate YoY, the lower new home sales YoY. Because mortgage rates remain slightly elevated compared with one year ago, the progress YoY in new home sales has almost completely stopped. As a result, I expect single family permits to follow the more noisy downward trend in month over month comparisons in sales in the immediate future.

In other words, so long as mortgage rates remain in the 6%-7% range, I expect new housing sales and construction to stall out as well, but not to decline significantly either.

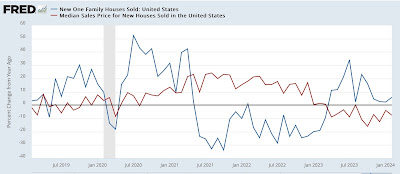
Finally, as I always reiterate, prices lag sales. So here’s the YoY update on median prices (red), which are not seasonally adjusted (red) compared with YoY sales:


Again, aside from the spring 2020 and 2021 YoY distortions due to the pandemic lockdowns, we see that prices followed sales higher, and then in 2023 followed sales lower. We will probably continue see negative YoY comparisons in prices for a few months more before they follow sales back higher YoY probably by late this year.

But the big takeaway remains that, generally speaking, I am not expecting much in the way of big moves in new home sales or prices until there is a significant change in mortgage rates.