Saturday, March 9, 2024

Weekly Indicators for March 4 - 8 at Seeking Alpha


 - by New Deal democrat


My “Weekly Indicators” post is up at Seeking Alpha.

Generally speaking, there is a demarcation between consumer-oriented data, which is in the main positive, and manufacturing-oriented data, which is mainly weak or negative.

As usual, clicking over and reading will bring you up to the virtual moment on the economy, and reward me with a little lunch money.

Friday, March 8, 2024

February jobs report: the Household Survey is downright recessionary, while the Establishment Survey is decidedly mixed


 - by New Deal democrat


In the past few months, my focus has been on whether jobs gains are most consistent with a “soft landing,” i.e., no further deterioration, or whether deceleration is ongoing; and more specifically: 

  • Whether there is further deceleration in jobs gains compared with the last 6 month average, or weather gains have held steady. In February, they held steady.
  • Whether the unemployment rate is neutral or decreasing; or whether there is further weakness. The recent excellent reports in initial claims suggested this rate would decline. To the contrary, it increased to a new 2 year high; and
  • Based on the leading relationship of the quits rate to average hourly earnings, whether YoY wage growth would continue to decline slightly. It did decline, and is tied for a 2.5 year low.

Here’s my in depth synopsis.


HEADLINES:
  • 275,000 jobs added. Private sector jobs increased 223,000. Government jobs increased by 52,000. 
  • Both December and January were revised downward, by -43,000 and -124,000 respectively, for a total of -167,000. After a break last month, this resumes the pattern from nearly every month last year, when there were a steady drumbeat of downward revisions.
  • The alternate, and more volatile measure in the household report, declined by -184,000. On a YoY basis, in this series only 667,000 jobs, or 0.4%, have been gained. This is the lowest since the pandemic lockdowns.
  • The U3 unemployment rate rose 0.2% to 3.9%. As indicated above, this is a 2 year high.
  • The U6 underemployment rate increased +0.1% to 7.3%, 0.8% above its low of December 2022.
  • Further out on the spectrum, those who are not in the labor force but want a job now declined -121,000 to 5.672 million, down from its highest level since September 2022, vs. its post-pandemic low of 4.925 million set last March

Leading employment indicators of a slowdown or recession

These are leading sectors for the economy overall, and help us gauge how much the post-pandemic employment boom is shading towards a downturn.  With two exceptions, these were negative, generally reversing last month’s gains:
  • the average manufacturing workweek, one of the 10 components of the Index of Leading Indicators, reversed last month’s decline, and was up sharply, by 0.3 hours to 40.5, but is still down -1.0 hour from its February 2022 peak of 41.5 hours.
  • Manufacturing jobs declined -4,000.
  • Within that sector, motor vehicle manufacturing jobs declined -400. 
  • Construction jobs increased by 23,000.
  • Residential construction jobs, which are even more leading, declined by -200 from last month’s post-pandemic high.
  • Goods jobs as a whole rose 19,000 to another new expansion high. These should decline before any recession occurs. After revisions, these are up 1.1% YoY, the lowest growth since early in the pandemic, but which is nevertheless average compared with most of the last 40 years.
  • Temporary jobs, which have generally been declining late 2022, fell by another 15,400, and are down about -250,000 since their peak in March 2022.
  • the number of people unemployed for 5 weeks or fewer rose 186,000 to 2,326,000.

Wages of non-managerial workers
  • Average Hourly Earnings for Production and Nonsupervisory Personnel increased $.07, or +0.2%, to $29.71, a YoY gain of +4.5%. This is tied with December for a 2.5 year post-pandemic low.

Aggregate hours and wages: 
  • the index of aggregate hours worked for non-managerial workers increased a strong 1.0%, reversing last month’s big decline. This metric is now up 1.2% YoY.
  •  the index of aggregate payrolls for non-managerial workers rose 1.3%, and is now up 5.9% YoY. This is 2.8% above the most recent YoY inflation rate. This is powerful evidence that average working families continue to see gains in “real” spending money.

Other significant data:
  • Leisure and hospitality jobs, which were the most hard-hit during the pandemic, rose another 58,000, which is only -17,000, or -0.1% below their pre-pandemic peak.
  • Within the leisure and hospitality sector, food and drink establishments rose 41,600,. This sector has completely recovered from its pandemic downturn. 
  • Professional and business employment increased a meager 9,000. These tend to be well-paying jobs. This series had generally been declining since last May, but in the last 3 months has resumed its increase.
  • The employment population ratio declined -0.1% to 60.1%, vs. 61.1% in February 2020.
  • The Labor Force Participation Rate was unchanged at 62.5%, vs. 63.4% in February 2020.


SUMMARY

This month’s report, as is so often the case, was a study in marked contrasts between the Establishment Survey, which reported generally strong numbers, and the Household Survey, which was very weak. Nowhere was this more apparent than in the comparative YoY gains. In the former survey, jobs have increased 1.8%, while in the latter they are up a paltry 0.4%. With the exception of 1952, and isolated months in 1996, 2011, and 2013, the latter is downright recessionary.

The poor showing in the Household survey also included the number of unemployed, which increased. Together with the declined in employed people, this gave rise to a new 2 year high in the unemployment rate - very much NOT what initial claims have been forecasting. 

There were some negatives in the Establishment Survey as well. In addition to most of the leading jobs sectors, which as indicated above showed declines, the drumbeat of downward monthly revisions resumed.

But the positives in the Establishment Survey were powerful as well. In addition to the headline number, wage increases are still very good, as were aggregate hours and payrolls. And until goods employment declines, despite the poor Household Survey, it is hard to conceive that any recession is near. 

So I will give this a decidedly mixed grade, and be on the lookout for a reversal in the noisier Household Survey.

Thursday, March 7, 2024

Initial jobless claims continue positive, suggesting good news for the tomorrow’s February unemployment rate as well


 - by New Deal democrat


The most important reason I cover initial jobless claims is because they are an “official” short leading indicator. They are also very good at forecasting the short term trend in the unemployment rate in the monthly jobs report, which will be updated for February tomorrow.


And the news continues to be positive. Initial claims were unchanged at 217,000, continuing near their 50 year lows from several months ago. The four week moving average declined -750 to 212,250, while continuing claims, which comparatively lag, and are reported with a one week delay, rose 8,000 to 1.906 million, close to a two year high:


More important for forecasting purposes is the YoY% change. In that regard, initial claims are down -11.4%, and the four week moving average is down -5.6%. While continuing claims are up 7.0%, this is the lowest YoY comparison in almost a year:


Continuing claims rose significantly immediately following the Silicon Valley Bank meltdown, as tech companies all laid off workers. It is likely the increased difficulty in finding suitable new positions in that sector of the economy that has driven the increase in continuing claims. Nevertheless, as I wrote above, they generally lag initial claims, which is the pattern we see in the YoY data.

Finally, as indicated at the outset of this post, initial claims, averaged monthly, have an excellent record of forecasting the trend in the unemployment rate in the ensuing months, and so lead the Sahm rule for forecasting recessions by several months. Here is that update:


The downshift in initial jobless claims over the past 6 months has started to be reflected in the monthly unemployment rate. As a result, in tomorrow’s report I am expecting the unemployment rate to remain at 3.7% or decline to 3.6%. An increase above 3.8% is almost certainly not going to happen.

Additionally, based on yesterday’s JOLTS report, since the quits rate (which leads wages YoY) declined to new post-pandemic lows, I am expecting average hourly earnings for nonsupervisory workers to decelerate further YoY from 4.8%, possibly to a new post-pandemic low of 4.5%. This doesn’t mean the jobs report will be poor, just that the supercharged wage growth that immediately followed the pandemic is continuing to ebb.

Wednesday, March 6, 2024

January JOLTS report shows more (relative) weakening, downward revisions to 2023


 - by New Deal democrat


The JOLTS report for January showed only minor changes compared with December, all to the downside, but was somewhat overshadowed by mainly downward revisions to all of 2023.

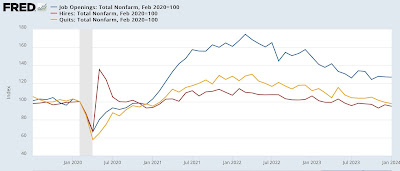
Starting with the monthly changes, job openings (blue in the graph below), a soft statistic that is polluted by imaginary, permanent, and trolling listings, declined -26,000 to 8.863 million. Actual hires (red) declined -100,000 to 5.687 million. Voluntary quits (gold) declined -54,000 to 3.385 million. In the below graph, they are all normed to a level of 100 as of just before the pandemic:


Openings are at their lowest point except for last November since March 2021. Actual hires and quits are at their lowest in 3 years, and both are significantly lower than they were before the onset of the pandemic, and indeed all the way back to March 2018.

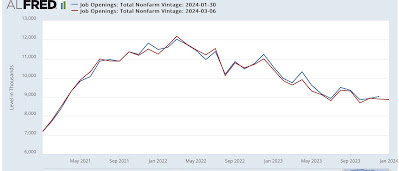
Just as significantly, job openings were revised downward for 11 of the 12 months of 2023:


Actual hires were revised downward for 8 months, and quits were revised down by 9 months as well (not shown).

Meanwhile, for the month layoffs and discharges (blue in the graph below) declined -35,000 (an improvement) to 1.572 million:


This is of a piece with the recent decline in more timely weekly initial jobless claims (red, right scale). These were revised *higher* for 7 of the 12 months of 2023 (not shown).

All of the revisions above indicated weaker readings for 2023 than previously reported.

Despite this, for a more historical perspective, the below graph norms the rates of hires, quits, and layoffs and discharges to 100 as of this month’s readings, and shows their record in the 20 years before the pandemic:


So even though January’s numbers were “poor” relative to the past 6 years, they exceeded any point since the inception of the series up until then.

Looking forward to Friday’s jobs report, since the quits rate tends to lead average hourly earnings, we see that the quits rate declined to the lowest rate in 6 years!This implies that average hourly earnings will decelerate further in coming months:


We’ll see in two days.

Tuesday, March 5, 2024

Real incomes and Presidential approval: most measures did not surpass pre-pandemic levels until 2023, or this year!


 - by New Deal democrat


This post is somewhat of a follow-up to one I wrote two weeks ago, about perceptions of income vs. inflation, as well as following up on yesterday’s post considering the electoral implications of the current economy.

It’s a truism - if certainly an oversimplification - that people vote their pocketbook. Real incomes are thought by some analysts to be an important determinant of that behavior. But, alas, there’s no one way to measure real income. Back 10 years ago, I occasionally used to track 4 of them. Adding real median household income, there’s five.

So let’s take a look at the entire pack.

First off below is an update of all 4 measures of real income I tracked 10 years ago: real nonsupervisory hourly wages, the employment cost index, median real weekly income, and real compensation per hour. Here is the historical look since the turn of the Millennium up until the pandemic, normed to 100 as of just before the pandemic:


The first three tell similar stories. They were generally stagnant during the George W. Bush Administration’s expansion. When gas prices fell below $1.50/gallon late in the Great Recession, there was a brief small spike, followed by a decline for several years thereafter. Finally, beginning in 2013 when the unemployment rate fell below about 7%, real wages rose consistently until the pandemic hit.

The fourth series, real business compensation, is subject to compositional issues. As higher paid professions pulled away from nonsupervisory, non-professional jobs, their pay increased more than the lower tiers of job holders. As a result, their real pay increased significantly during the Bush Administration, and declined only slightly after the Great Recession.

Now here is the update for the past five years:


Once again, the compositional effects of the pandemic stand out. Recall that lower paid services workers, especially in leisure and hospitality, were especially hard hit by pandemic related layoffs. This shows up in the surge in real hourly compensation, and to a lesser extent in real average hourly wages, and median real weekly earnings. 

By contrast, the employment cost index tracks pay for the same mix of job categories, so is not subject to the same compositional issues. 

Further, note that all four show the effects of the spike in gas prices surrounding Russia’s invasion of Ukraine, and the subsequent undoing of that spike.

But what really stands out is that, except for real average hourly wages, the other three measures of real job income fell below their pre-pandemic levels and stayed there at least into 2023. Real hourly compensation of all workers finally rose above its February 2020 level in the 2nd quarter of 2023 (and most recently is up 1.1%), and real median weekly earnings not until the 4th quarter (up only 0.4%). The employment cost index in real terms is *still* below its pre-pandemic level (by -1.6%).

Finally, let’s compare with real median household income. Recall from my post two weeks ago that Motio Research has a method for calculating and updating this monthly, rather than having to wait for the annual update in September of the following year. Here’s their most recent graph through January:


Since then they have published an essay on their methods and the current status of their metric. Most importantly they say:

The spike and sharp decline in March-October 2020 are primarily attributed to the effect of nonresponse bias in the CPS during the initial months of the pandemic [due to n]onresponse bias … [of] lower-income households . . . . We recommend taking the February 2020 value as the peak for 2020 for practical purposes.

. . . . The index reached a post-Covid minimum value in April-May 2023 and has shown renewed strength since June 2023. With a value of 112.8 in January 2024, the index is approaching the pre-Covid peak of 112.9 observed almost four years ago, in February 2020.

As I noted in my post two weeks ago, this is a powerful explanation for the poor approval ratings of President Biden. By most measures, the median household was worse off following the pandemic up until late last year, and by some measures ever so slightly even now.

Because the short leading indicators continue to suggest improvement in the economy in the months ahead, I do expect real income measures to further improve as well. Once households feel that improvement, Biden’s approval rating, and his standing in the polls, should improve as well.

Monday, March 4, 2024

What real spending and the unemployment rate portend for the 2024 Presidential election (so far)


 - by New Deal democrat


The economic news later this week will focus on employment: the JOLTS report for January on Wednesday, weekly jobless claims on Thursday, and of course the February jobs report on Friday.


In the meantime, since this is a Presidential election year, let me focus on several economic fundamentals that have a long term record of correlating with election result; in particular, today, on real consumer spending and the unemployment rate.

I am discussing this against a backdrop of months of polling showing that Biden and Trump are locked in a very tight race, including lots of polling that shows Trump ahead. Are such polls supported by the economic fundamentals?

To cut to the chase, yes they are. Because what typically matters is not the *abolsute level* of things like the unemployment rate (remember that FDR was elected in a landslide in 1936 with over 10% unemployment, and Obama won handily in 2012 with just under 8% unemployment), but rather the *trajectory* of the consumer economy.

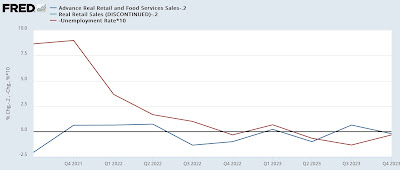
Both real retail sales and the unemployment rate data go all the way back to 1948. Below I show them together in 24 year increments through 2019, and then a close-up on the last several years. Specifically the below shows the Quarterly exchange in each. The data on real spending subtracts 0.2% to account for population change, and change in the unemployment rate is inverted (so that worse shows up as a negative, and multiplied *10 for scale. Discussion follows afterward:


For simplicity of analysis, below I divide election years into three levels: where both series are positive, where both average close to 0, and where both are negative.

Positive: 1952, 1964, 1968, 1972, 1984, 1988, 1996, 2004, 2012
Neutral: 1948, 1956, 1976, 2016, 2024 (so far)
Negative: 1960, 1980, 1992, 2000, 2008, 2020

Here’s the summary version: in all but two elections (1952 and 1968), when the data was positive, the incumbent party was returned to power.

In *every* election where the data was negative, the incumbent party was defeated.

There is also an element of “what have you done for me lately?” involved in the results. Incumbents with neutral data were re-elected if they had served only one term (1956), but their successor was generally not able to be elected if the incumbent party had served two terms (1976, 2016). The two cases where there was positive data but the incumbent party’s candidate was not elected also took place where it had been in power for two or more terms (1952, 1968). The only other exception was 1948, where Harry Truman got elected even in the face of a recession and neutral spending and unemployment data.

As indicated above, so far the 2024 taking place against a background of neutral real spending and unemployment data. I suspect in the coming months that situation is going to improve. Since Biden has only served one term, this will be a benefit for him. And apropos of Truman’s 1948 campaign, this GOP dominated (in the House) Congress has been the least productive in many terms. Biden will be able, if he chooses, to run a similar campaign against them (in addition, of course, to all of the other, non-economic issues involved in this election).

Sunday, March 3, 2024

Weekly Indicators for February 26 - March 1 at Seeking Alpha


 - by New Deal democrat


My “Weekly Indicators” post is up at Seeking Alpha.

With the interest rate environment improving, more of the short leading and coincident data - with a few notable exceptions - is turning a little more positive as well.

As usual, clicking over and reading will bring you up to the virtual moment as to the state of the economy, and bring me a little lunch money as well.