Saturday, January 20, 2024

Weekly Indicators for January 15 - 19 at Seeking Alpha


 - by New Deal democrat


My Weekly Indicators post is up at Seeking Alpha.


The big headlines yesterday were that stocks made a new all time high, for the first time in two years.

Meanwhile, estimated plus actual earnings so far for the 4th Quarter of 2023 were on track for their lowest number since Q1 of 2021.

Either corporate earnings are going to rebound sharply or stocks have gotten far ahead of themselves. Either way this discrepancy is going to resolve.

If corporate earnings are not just in a one Quarter air pocket, we can expect increased layoffs and cutbacks in capital spending. We’ll see.

As usual, clicking over and reading will bring you up to the virtual moment as to the economy, and reward me with a little lunch money for my efforts.

Friday, January 19, 2024

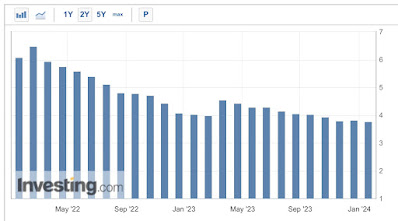
Briefly noted: existing home sales appear to be bottoming near 30 year lows as prices continue to firm


 - by New Deal democrat


Last month I wrote that existing home sales “are likely in the process of bottoming, as they have been in the range of 3.79 million to 4.10 million for the past five months:”


That continued to be the case in December, as sales declined -3,000 on an annualized basis to 3.78 million:


On a longer term basis, existing home sales are at the lowest level in almost 30 years, and down over -40% from their post-pandemic peak:


With so many people locked in to mortgages of 3% or so, inventory continues to be anemic, so potential buyers are bidding on the relatively few homes available. This is keeping prices close to their highs. Prices have been higher YoY for the past six months, currently up 4.4%:


This is in contrast to new homes, where builders can control sizes, amenities, rebates, and prices to generate demand. In that market prices are down about 10% YoY and sales are down about 25% from just before the Fed started raising rates. So the bifurcation of the two markets continues.

Thursday, January 18, 2024

Housing construction changes little in December; but increased mortgage rates from H2 2023 have not yet been digested


 - by New Deal democrat


For this post, I’m going to show what the housing market looks like from most to least leading of the indicators. That shows that, although this morning’s release for housing permits and starts for December was generally positive, it is more likely that housing construction will decline rather than advance further in coming months.


Since interest rates lead housing construction, let’s start with the YoY change in mortgage rates (inverted, red) vs. the YoY change in housing permits (/10 for scale):


In December, mortgage rates were only about 0.4% higher than they were one year ago, suggesting that housing permits, which were actually 6% higher than in December 2022, will cool off in the coming months.

This shows up better when we compared the actual numbers. Mortgage rates rose significantly in October and November of both 2022 and 2023, only to decline in December of both years. In the first part of 2023, they remained lower than they had been in late 2022. With a lag, permits followed, turning down at the end of 2022 and then rising in the first half 2023 before leveling off in the second part of the year:


We are probably going to see a downturn in permits in the coming months, in reaction to the increase in mortgage rates during autumn.

The next most leading marker is that single family new home sales, although very noisy and heavily revised, tend to lead single family permits by several months. In reaction to the rise in interest rates in late 2023 discussed above, new home sales (blue) have already turned down (their 3 month average is down -7.5% from last spring’s peak), suggesting that single family permits (red), which made 1.5 year high in December) are going to follow:


Housing starts (light blue in the graph below) follow typically permits (blue) with a one to two month lag, and they are noisier:


Starts have trended sideways to slightly higher in the second part of 2023, but their noise makes a true trend almost impossible to see.

Finally, lagging all of the above is the actual economic impact of housing, units under construction. In contrast to conditions which have preceded recessions, these have turned down only slightly in the past year:


Because there has been a particular emphasis on multi-unit construction, here are single family (red), multi-unit (gold), and total units (blue) under construction for the past 5 years:


Single family housing under construction is down about -20%, at the lowest level since May 2021, while multi-unit construction has declined only -1% from its peak early last year. Total units, which typically have declined -10% or more before recessions, are only down -2%, nevertheless at their lowest level since April 2022.

To see where these trends are headed, here are permits for each:


All of the recent increase in permits has been for single family housing, which increased to its highest level since May 2022. The big increase in multi-unit permits has completely reverted to pre-pandemic levels, a -35% decline. While multi-unit permits increased slightly in December, they remain just slightly higher than their 3 year low set in November. Because multi-unit construction takes much longer than single family housing construction, the decline in apartment and condo construction is likely to slowly play out over this entire year.

To summarize: although there was a big decline in mortgage rates in December, the higher rates of the second half of 2023 have yet to work their way through housing construction. We can expect permits, starts, and units under construction to decline in the months ahead. Because manufacturing for the past year has been generally recessionary, how much housing construction declines will be very important for the economy in the latter part of this year. The course of housing thereafter depends on whether the decrease in mortgage rates since Thanksgiving is sustained or continues. 
Jobless claims: bar one week, the lowest number of layoffs in over half a century


 - by New Deal democrat


To reiterate my theme from last week, we’re back to the virtuous scenario where almost nobody is getting laid off.


Initial jobless claims last week declined -16,000 to 187,000. Except for one week in September 2022, this is the lowest number in over 50 years (since 1969, to be more precise). The 4 week average declined -4,750 to 203,250, the lowest since last January. With the usual one week delay, continuing claims declined -26,000 to 1.806 million:


The one caution here is that some of this may be due to seasonal adjustments, which are particularly hard during and just after the holiday season, especially as distorted by the pandemic years.

On a YoY% basis, initial claims were down -6.5%, and the more important 4 week average was down -1.3%. Continuing claims were up 10.5%, which nevertheless was the lowest increase since the end of last March:


All of this bodes well for employment in the next few months.

Finally, since initial claims lead the unemployment rate by several months, for purposes of forecasting the effect on the “Sahm rule” measure of the unemployment rate, the first two weeks of January have averaged a decline of -4.2% YoY:


Since in the first half of 2023, the unemployment rate varied between 3.4% and 3.8%, this forecasts that the unemployment rate in the next few months is going to tend down towards the lower part of that range. Needless to say, this strongly suggests that the “Sahm rule” is not going to be triggered anytime soon.


Wednesday, January 17, 2024

Industrial production continues in near-recessionary trajectory


 - by New Deal democrat


In contrast to this morning’s good news on consumption, production continued its lackluster 2023 all the way to the end.


Total industrial production (blue in the graph below) increased 0.1% in December, but revisions to the two previous months totaled -0.2%, so the net result was a -0.1% decrease compared with where we thought we were in November. Manufacturing production (red) had an identical December increase and negative revisions. The below graph shows each in comparison with their respective September and October 2022 peaks. 


Total production remains down -1.0% since then, and manufacturing production down -1.2%.

Because December 2022 was awful, with declines of -1.5% and -2.2% respectively, the YoY comparisons for total and manufacturing production improved to +1.0% and 1.2%:


The conclusion remains that manufacturing is in at least near-recessionary conditions. But because manufacturing forms a significantly lower share of the economy now than it did before the “China shock” that began in 1999, it isn’t enough to tip the entire economy over. Construction in particular has been holding up well - and we’ll get the latest read on that sector with tomorrow’s report on housing permits and starts.

December real retail sales: the good economic news keeps on coming


 - by New Deal democrat


The good economic news kept coming with this morning’s retail sales report for December. Remember that this is one of my favorite indicators because, adjusted for population, it is a fairly good long leading indicator, and on a short term basis has a consistent record of leading the trend in employment.


Nominally retail spending increased 0.6% for the month. More importantly, after adjusting for inflation, which rose 0.3%, real retail spending rounded to up 0.2%. This continued a nearly perfect record of monthly increases that started last March, and is 2.2% above its post-pandemic stimulus low in February 2022. The only negative is that it does remain -1.9% below its post-pandemic peak in April 2022:


The best way to visualize retail sales’ lead over employment (red in the graph below) is YoY (blue, /2 for scale), shown for the past 30 years. I also show real personal consumption on goods since the turn of the Millennium (light blue), which has a similar record:


Here is the close-up since July 2022:


The good news here is that YoY comparisons of real retail sales continue to improve, now up 1.1%. Real personal consumption on goods has similarly improved, up 1.8% as of November. Since nonfarm payrolls were up 1.7% YoY, both consumption series suggest that any further deceleration in jobs gains will be slow, and it is possible we get the fabled “soft landing,” with job growth leveling out at this trend rate.

To reiterate: this was a good report.

Tuesday, January 16, 2024

As vehicles and outdoor appliances become increasingly electric, long term gas usage - and “real” prices - decline


 - by New Deal democrat


What is the “real” cost of gasoline? When measuring this, some people compare with the CPI. But that actually just tells you the *relative* inflation in gas vs. other items. That’s why, for example, when I want to look at the “real” cost of housing, I measure against income, such as average hourly earnings. That tells you how much labor it costs the average person to buy an item.


So here are oil prices (blue, right scale) and gas prices (red, left scale) divided by average hourly wages for nonsupervisory workers since 1998. I start here because gas prices hit a generational low of $0.80/gallon at the beginning of 1999 - barely above where they were in 1974:


At their peak in July 2008, oil prices were 8x their price in wage-adjusted terms compared with 1999. Gas prices were almost 3x as high. At their pandemic lockdown lows, they were barely unchanged since 1999. Currently oil prices are 2.6x their cost in wages compared with their 1999 low. Gas at the pump is only 50% higher than 1999. This is on the low side of average since the big slide in prices 10 years ago in 2014.

Put another way, right now gas is relatively cheap compared with most of the past 25 years.

And there is good reason to believe that going forward oil price shocks will not be as big a deal as they have been over the past 50 years. That’s because many outdoor appliances like lawn mowers and leaf blowers are now electric powered. Even more importantly, in the past 3 years the percentage of new light vehicles sold that are hybrids or electric has risen from 5% to 16%:


I suspect if anything this trend is going to accelerate, as electric vehicles become less expensive and have increased range, and more two vehicle households buy at least one for shorter trips. Meanwhile hybrids have solved their previous issues with acceleration.

The effects of this can be seen in the weekly update of gasoline usage by the E.I.A., data on which goes back to 1991:


The all-time peak of gasoline usage was in August 2019, when nearly 9.8 million barrels were used per day. The post-pandemic peak was 9.528 million in August 2021. This past summer the peak was 9.388 million barrels.

As a bigger and bigger percentage of vehicles on the road are hybrids or EVs, I expect the decline in gas usage to continue. This in turn will lessen considerably the effect of oil price shocks in the future.

Monday, January 15, 2024

For MLK Day: Blacks are faring better during the post-pandemic Boom than at almost any time in the previous 50+ years


 - by New Deal democrat


On this MLK Jr. national holiday, let’s take a look at how Blacks are faring in the current economy.


And the answer is, pretty good!

The unemployment rate for Blacks in December was the 2nd lowest ever in 50+ years of history, at 5.2%. The lowest was last April at 4.8%:


The Black unemployment rate was only 1.7% higher than that for Whites, also the lowest gap in 50+ years (blue, right scale). Because Black unemployment has typically risen faster than White unemployment when the economy weakens, and has typically been in the range of twice the level of White unemployment, I also show the ratio of Black to While unemployment as well (red, left scale):


Black unemployment was slightly below 1.5x the level of White unemployment in December, the lowest multiple ever.

Finally, the employment-population ratio for Blacks was 60.1% (vs. 59.9% for Whites, not shown):


This is the 2nd lowest of the past 25 years, vs. last March’s 61.7%. These numbers were only exceeded during the late 1990s tech Boom, peaking at 61.4%, vs. 65.5% for Whites.

The post-pandemic jobs Boom hasn’t just been a “rising tide lifting all boats,” it has particularly benefitted those historically most marginalized in the jobs market.