Saturday, December 30, 2023

Weekly Indicators for year end 2023 at Seeking Alpha


 - by New Deal democrat


My “Weekly Indicators” post is up at Seeking Alpha.

2023 has been a year of improvement, and that improvements continued in the final installment, as ever so slowly more and more indicators flip neutral or positive.

As usual, clicking over and reading will bring you up to the virtual moment, and reward me a little bit for my efforts throughout the year.

Next week, as we begin a new year, I anticipate adding a weekly “real” measure of consumer spending. Stay tuned!

Thursday, December 28, 2023

Jobless claims end the year on a solidly positive note


 - by New Deal democrat


For our last data of 2023, initial jobless claims remained at a very low level, up 12,000 from one week ago to 218,000. The four week average declined 250 to 212,000. With the usual one week delay, continuing claims rose 14,000 to 1.875 million:


On a YoY% basis, initial claims are up only 2.3%, while the more important four week average is up a mere 0.1%. Continuing claims, which have been running higher all year, are still up 15.2%. But this is the lowest comparison since the beginning of April:


Finally, since initial claims lead the unemployment rate, and thus lead the “Sahm rule,” the monthly YoY% change in claims for December is only 0.7%, implying only a 0.1% increase in the unemployment rate YoY in the months ahead:


Needless to say, none of the YoY metrics above imply the slightest chance of recession in the immediate future.

I’ll have my usual “Weekly Indicators” update this weekend, and I plan on an end-of-year update about the COIVD situation. After taht, it is on to a new year of economic data!

Tuesday, December 26, 2023

Repeat home sale prices may be easing back into their pre-pandemic YoY range


 - by New Deal democrat


As I forewarned last week, this holiday week is very light on data, so don’t be surprised by me taking some time off.


We did get November home prices for repeat sales this morning from both Case Shiller and the FHFA, so let me just pass on a brief note.

Seasonally adjusted prices per the FHFA rose 0.2% in November. For the last half year, they have risen on average at about a 2.5% annual rate. *Not* seasonally adjusted prices from Case Shiller also rose 0.2%, a little “hot” for this time of year. Here’s what the last four years of the monthly changes in each look like:


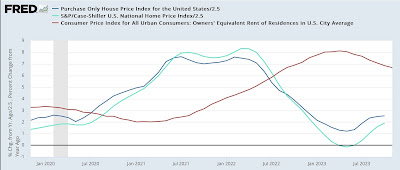
And here’s what the YoY% changes in each look like, /2.5 for scale, compared with Owners’ Equivalent Rent in the CPI:


Here’s a longer term look at the same:


Over the longer term, a 2.5% annual increase has been about par for the course, especially for the FHFA index. Note that the YoY change in that index in particular looks like it may be easing back into that range.

Because the house price indexes lead OER by 12 months or more, I expect that YoY change in the latter to continue to decline, although the pace of decline has been slower than I expected earlier this year.