Saturday, July 22, 2023

Weekly Indicators for July 17 - 21 at Seeking Alpha


 - by New Deal democrat


My Weekly Indicators post is up at Seeking Alpha

At least when it comes to weekly measures of consumer spending, the “waiting for godot” recession seems to have finally arrived. Meanwhile other metrics have been picking up steam as to the near future. This suggests a period of wobbling ahead.


As usual, clicking over and reading will bring you up to the virtual moment, and reward me a little bit for my efforts.

Friday, July 21, 2023

How long until the historically tight jobs market reverts to trend?


 - by New Deal democrat


There are some very unusual cross-currents going on in the housing sector, revealed by yesterday’s existing home sales report. But it will take some time-intensive organization to present it to you, so I’m saving it for (hopefully) Monday.


In the meantime, let’s take another look at the job market and how it compares with consumer spending.

One of my favorite long-time graphs has been that the YoY% change in real retail sales, /2, forecasts the YoY% change in jobs growth, with a delay of some months. Here’s the latest update of that:


Works like a charm, until the pandemic. Then there’s a disconnect, first on the downside (2020) for jobs, as they declined over 5% vs. over 2% growth in sales), and then on the upside (2022-23), with an actual decline in sales vs. over 2% growth in jobs.

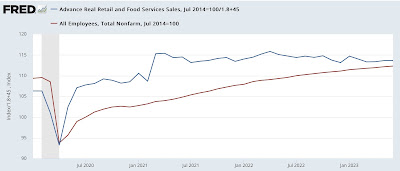
When will the disconnect resolve itself? For that, let’s take a different look at the same data. The above implies that sales grow faster than jobs,  vs. their long-term trend in the first part of an expansion, and sales grow slower than jobs in the last part. To show that, I’ve normed both real sales and job growth to 100 as of the mid-point for jobs growth in the last expansion in mid-2014. Because sales historically have tended to grow almost twice as fast as jobs, I account for that mathematically in the sales data.

Here’s what the last 30 years look like:


This shows that sales exploded in 2020 and 2021 with the pandemic stimulus, while jobs initially plummeted and then grew back strongly.

Now let’s zoom in on the post-pandemic era:


Real sales have been flat to slightly declining over the past 2 years. Meanwhile jobs have almost entirely caught up, and are now only 1% (about 1.5 million jobs) under trend compared with their pre-pandemic norm. This can be resolved by a further decline in sales, a further increase in jobs, or both.

Which brings me to the job openings data from the latest JOLTS report:


Over the past 16 months, job openings have declined about 50% towards their pre-pandemic level. If that trend continues, in about another 16 months the anomaly will have disappeared. 

The sales vs. jobs data highlighted previously above suggests that it will be quicker than that, on the order of 6 to 12 months. At that point the historically tight labor market will revert to mean, and an actual downturn in jobs in response to flagging sales would become much more likely.

Thursday, July 20, 2023

Jobless claims: close but no cigar for the red flag


 - by New Deal democrat


Initial claims declined -9,000 to 228,000 last week, and the four week average declined -9,250 to 237,500. Continuing claims, with a one week delay, rose 33,000 to 1.754 million:


More importantly for forecasting purposes, initial claims are up 7.0% YoY, the four week average up 10.6%, and continuing claims up 30.8%:


Just as importantly, the average for July so far is about 233,000, only about 8.4% above last year’s average for the month.

My discipline requires 2 straight months, or 8 weeks in a row, of comparisons higher by 12.5% or more YoY. Otherwise, the spike could just be transitory noise. Thus, with this week’s number, the chain has been broken. Unless there are sharp increases in new claims in the remaining weeks of July, there is no red flag recession signal.

Despite that, since initial claims lead the unemployment rate, a slight increase in the unemployment rate during the next few months is still forecast:


Keep in mind that the unemployment rate in the above graph is rendered as a “percent of a percent,” so even a 10% YoY increase from 3.5% would sill only be about 3.9%, not enough to trigger the Sahm Rule.


Wednesday, July 19, 2023

June housing report: a tale a two diametrically opposed sectors


 - by New Deal democrat


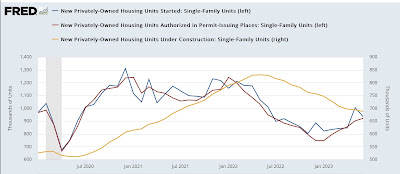
Yesterday I wrote that housing under construction, along with new vehicle sales, were two important reasons that no economic downturn had occurred yet. Today’s report on housing construction for June showed two almost diametrically opposed trends: single family houses had a sharp increase in permits and starts, while units under construction made a 12 month low. Conversely, multi-family dwellings had sharp declines in permits and starts, while units under construction were at multi-decade highs.


So let’s break this month’s report down into those two categories: single-family vs. multi-family dwellings.

Permits (red in the graph below) are the most leading of the metrics, and single family permits have the least noise and most signal of any metric. These increased 20,000 annualized to a new 12 month high. Starts (blue) declined -70,000 annualized, but were nevertheless close to the 12 month high set last month. But units under construction (gold, right scale) declined -6,000 to a new 12 month low:


The story was completely reversed for multi-family dwellings. Permits (red) declined -73,000 to a new 12 month low, and starts (blue) declined -63,000 to the 3rd lowest level in 12 months. But units under construction (gold, right scale) increased 7,000 to not just a 12 month, but another all-time high:


It’s easy to see in the above how the data progresses from permits to starts to units under construction. Since mortgage rates lead permits, below are mortgage rates averaged monthly (inverted) vs. single family permits (red, right scale):


You can see that last year’s big increase in mortgage rates led to a big decrease in permits. The decline in mortgage rates earlier this year has led to an interim increase in permits. I suspect permits will decline slightly again as the recent increase in rates back to 7% filters through the system.

But the actual economic impact is via units under construction. Below I show total units under construction (blue, right scale)), as well as the single-family (red) and multi-family (gold) units components:


In total, units under construction have fallen slightly from their peak (meaning a very minor effect on the economy), while single-family units have declilned at a recessionary pace. But that has been almost totally offset by the record increase in multi-family units under construction. Undoubtedly the dominant reason for that is the big surge in housing prices after the pandemic, which priced single family dwellings out of the price range of many younger potential buyers. Since multi-unit apartments and condos tend to be less expensive, and thus somewhat of a replacement good, this is where the growth has been.

For forecasting purposes, most importantly, in the booming multi-family sector, permits have fallen to their lowest level since October 2020. Starts are close to their lowest level since the end of 2021. Units under construction have not peaked yet, and are probably several months away from peaking.  The exact reverse is true about single family units. Since multi-unit construction is over 60% of total activity, and more importantly because there is a much greater downside to multi-family construction if they follow permits, vs. limited upside for single family units, I anticipate downward pressure on the economy overall as a result.

Tuesday, July 18, 2023

Industrial and manufacturing production continue to falter


 - by New Deal democrat


I frequently call industrial production the King of Coincident Indicators, because so often the turning point in this metric has been at the peaks and troughs of the economy as a whole. That has not been the case since last September, when this indicator last peaked.


And it continued its declining trend in June. Total production declined -0.5%, and manufacturing production declined -0.3%:


On a YoY basis, total production is down -0.4%, and manufacturing production is down -0.3%:


As you can see, up until the recent past, such declines had almost always been recessionary. But since the “China shock” that began in 1999, there have been similar production declines that have not spread out into the wider economy.

Finally, here’s a look at the sub-sector of motor vehicle production:


This series is noisy, so while the big decline played a role in the declines in both total and manufacturing production in June, there is simply no way to know if this is simply one bad month, or the beginning of a downward trend.

The bottom line is that this important indicator continues to be negative. Recession as been avoided - at least so far - because of resolving supply bottlenecks in vehicle production and housing construction, and robust spending on services. As we saw above, June was a poor month for vehicle production. We’ll find out about housing construction later this week.

June retail sales continue to falter, with the important exception of motor vehicles


 - by New Deal democrat


As usual, retail sales is one of my favorite indicators, because it tells us so much about the 70% of the US economy that is consumption, as well as being a short leading indicator for employment. It has been faltering for the past year, and June was no different.


Last month retail sales increased 0.2% nominally, but because consumer prices also increased 0.2%, real retail sales were unchanged:


In real terms, retail sales remain -3.1% below their 2021 peak.

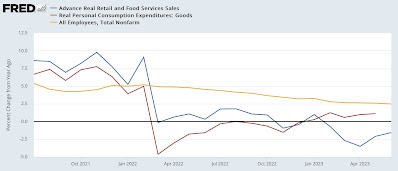
The YoY comparisons, which have been very negative, continued to be negative, although slightly less so. The below graph also shows real personal consumption on goods, which tends to closely track real retail sales, although with a different deflator which tends to make it more positive:


Although I won’t show the long term graph, the simple fact is that, going back 75 years, with rare exception a YoY decline of 2% in real retail sales has been recessionary.

Since real retail sales tend to lead the trend in employment by several months, nonfarm payrolls are also shown above in gold. The indication is that the deceleration in YoY employment gains is going to continue in the coming months.

Finally, because a unique aspect of the current economic environment is the outsized role played by motor vehicle sales, which had been severely constrained by supply shortages - leading to outsized price increases as well - here is the comparison among nominal total, motor vehicle, and sales ex-motor vehicles for the past several years, all normed to 100 as of just before the pandemic recession of 2020:


Note again that the above graph is nominal, not real, and is shown for comparison among the sectors. Real sales of motor vehicles increased 0.1% in June. This sector continues to be a boon for the economy, and - along with robust real spending on services, which aren’t part of retail sales - an important reason why no recession has occurred yet.

Sunday, July 16, 2023

Weekly Indicators for July 10 - 14 at Seeking Alpha


 - by New Deal democrat


My Weekly Indicators post is up at Seeking Alpha.


Several indicators that had been stubbornly positive throughout the decline in leading metrics as of this past week finally turned either neutral or negative. Much as the dominant punditry at the moment is that the economy will actually stick a “soft landing,” these turns argue that instead consumers may finally be reining in purchases, and holdout metrics in the important construction sector may finally be turning down.

As usual, clicking over and reading will bring you thoroughly up to date, and bring me a little pocket change.