Friday, March 10, 2023

February jobs report: the decelerating trend resumes


 - by New Deal democrat


As I’ve written several times this week, my focus on this report was on whether manufacturing and residential construction jobs turned negative or not, whether temporary jobs continued on their downward trajectory, and whether the deceleration apparent in job growth would reappear after the blockbuster January report.

Deceleration absolutely reasserted itself:


and manufacturing jobs appear to have rolled over, while construction and temporary jobs held up:


Although here too the decelerating trend is apparent. 

Here’s my in depth synopsis.

HEADLINES:
  • 311,000 jobs added. Private sector jobs increased 265,000. Government jobs increased by 46,000. The three month moving average of growth declined slightly to 351,000, still 67,000 higher than the average in December.
  • The alternate, and more volatile measure in the household report rose by 177,000 jobs. The above household number factors into the unemployment and underemployment rates below.
  • U3 unemployment rate increased +0.2% to 3.6%.
  • U6 underemployment rate also rose 0.2% to 6.8%.
  • December was revised downward by -21,000, and January was also revised downward by -13,000, for a net decrease of -34,000 jobs compared with previous reports. 

Leading employment indicators of a slowdown or recession

These are leading sectors for the economy overall, and will help us gauge whether the strong rebound from the pandemic will continue.  These were mixed, although as indicated above even the positive indicators still weakened:
  • the average manufacturing workweek, one of the 10 components of the Index of Leading Indicators, declined -0.2 hours to 40.7, down -0.9 hours from February peak last year of 41.6 hours.
  • Manufacturing jobs declined by -4,000.
  • Construction jobs increased 24,000.
  • Residential construction jobs, which are even more leading, increased by only 1,200.
  • Temporary jobs, which had been declining late last year, rose for the second month in a row, by 6,800.
  • the number of people unemployed for 5 weeks or less rose 343,000 to 2,289,000.

Wages of non-managerial workers
  • Average Hourly Earnings for Production and Nonsupervisory Personnel increased $.013, or +0.5%, to $28.42, a YoY gain of 5.3%, an increase from its previous deceleration to 5.1% in January.

Aggregate hours and wages: 
  • the index of aggregate hours worked for non-managerial workers declined -0.4%.
  •  the index of aggregate payrolls for non-managerial workers was unchanged, and resumed its deceleration to 7.4% YoY, the lowest since early 2021, although still more than 1% higher YoY than inflation as of the last reading.

Other significant data:
  • Leisure and hospitality jobs, which were the most hard-hit during the pandemic, rose 105,000, and have improved to -2.4% below their pre-pandemic peak.
  • Within the leisure and hospitality sector, food and drink establishments added 69,900 jobs, and are now only -0.9% below their pre-pandemic peak. 
  • Professional and business employment rose 45,000. This series has also been decelerating consistently, and is now up 2.7% YoY, the lowest increase since mid-2021.
  • The Labor Force Participation Rate increased 0.1% to 62.5%, vs. 63.4% in February 2020.
  • The number of job holders who were part time for economic reasons rose 17,000.
  • Those not in the labor force at all, but who want a job now, declined -211,000 to 5.103 million, compared with 4.996 million in February 2020.


SUMMARY

In absolute terms, this report was yet another solid positive report in terms of job growth. In relative terms, however, the deceleration which was apparent for most of last year resumed. 

Positive signs included growth in temporary and construction jobs, the nearly total recovery in food and drinking places jobs, resumed stronger wage growth, an increase in labor force participation, and a decline in those who aren’t in the labor force but want a job now.

Negatives included a resumption in the decline of the manufacturing work week, a decline in manufacturing jobs (plus downward revisions for the prior two months), increases ini both the un- and under-employment rates as well as short term unemployment, and an outright decline in the number of hours worked.

Deceleration was apparent in residential construction jobs, professional and business jobs, and aggregate non-supervisory payrolls.

In sum, we have further deceleration but no indication of any imminent downturn in the number of actual jobs available in the economy.

Thursday, March 9, 2023

Jobless claims, like JOLTS, consistent with softening within a strong labor market


 - by New Deal democrat


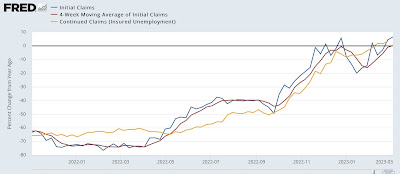
Initial jobless claims increased 21,000 last week to 211,000, still a very low number even if it is the highest since the beginning of January. The 4 week average increased 4,000 to 197,000, also still an excellent level. Continuing claims, with a one week delay, increased 69,000 to 1.718 million, tied for the highest since January 2022:


Just like the JOLTS report yesterday, continuing claims tell us that the labor market, while still objectively very strong, has softened compared with last year.

The YoY% changes also indicate relative softness, with continuing claims up 3.2%, initial claims up 6.6%, but the most important 4 week average only up 0.1%:


For initial claims to warrant even a cautionary yellow flag for recession, the 4 week average would have to be up 10% YoY. Needless to say, we’re nowhere near that marker.

Finally, initial claims are a leading indicator for the unemployment rate, typically with a lag of several months. Here is what the last 16 months look like:


In general, the unemployment rate in tomorrow’s jobs report should be within 0.1% of unchanged, and is a little more likely to increase than to decrease, given the lag compared with November and December’s increase in jobless claims.

I expect tomorrow’s report to revert to the general trend of deceleration that we’ve seen over the past year, since unlike January in February seasonally the data “expects” some hiring vs. massive layoffs as in January. I’ll be especially focusing on whether there is weakness in the leading temp help, manufacturing, and residential construction sectors. We’ll see then.

Wednesday, March 8, 2023

January JOLTS report consistent with a softening, but still very strong, labor market


 - by New Deal democrat


This morning’s JOLTS report for January, unlike the recent payrolls report, generally showed further softening in the labor market.


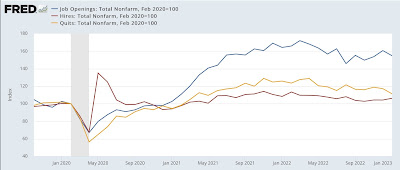
While hires (red in the graph below, normed to a value of 100 as of February 2020) increased 121,000, quits (gold) declined 207,000, and openings (blue) declined 410,000:


The downward trend in quits is most noticeable. Since employees voluntarily quit more, the more confident they are about new job prospects, this is a clear sign of *relative* weakening. The increase in hires is more a flattening of the trend, which had been decelerating. The trend in openings does appear to be softer, although given the increase in the last few months before January, that is more questionable.

For comparison purposes, here is the same graph covering the period since the inception of the series through 2019:


Note that all three appeared to be weakening just before the 3 recessions since 2000; but openings have continued to increase on a secular basis. That businesses may have been maintaining job postings even when they were not actively looking, but just to troll for resumes; and further that that behavior has probably been spreading throughout industry; is one reason why I do not place as much value in this series as I do in others. Still, the overall trend is useful evidence of the status of the jobs market.

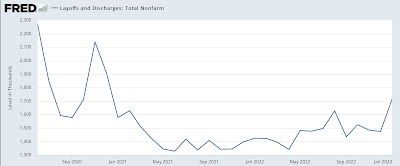
Finally, layoffs and discharges increased sharply, by 241,000, in January, to their highest level since October 2020:


Here is their record before the pandemic:


Note that the current level of layoffs and discharges would be very good for any period since 2000 up until the pandemic hit.

To summarize: the January JOLTS report is most consistent with a continued very strong labor market, but one which is softening in comparison with even stronger levels during 2021-22.

A weakening of this report, particularly as to job openings, is one of the main indicators I have been looking at for evidence that broader employment metrics are beginning to capitulate. I don’t think this report puts us there in any meaningful sense. Still, in Friday’s employment report I will be focusing most intently on whether employment in three leading sectors - temporary jobs, manufacturing, and residential construction - has either continued negative (as to the first sector) or turned negative (as to the last two).

Tuesday, March 7, 2023

Coronavirus dashboard: the first year of COVID endemicity


 - by New Deal democrat


As I indicated back in January, I don’t plan on any regular COVID dashboard updates unless something noteworthy has occurred. Since we are now 1 year into endemicity, this is a good time to look back and see what that means.


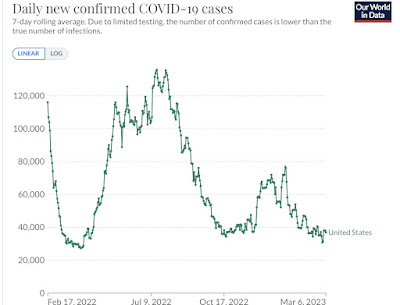
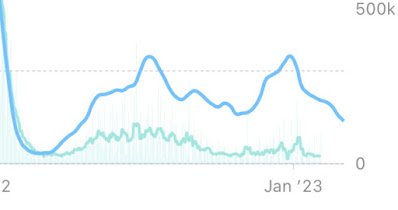
The huge initial Omicron spike started in late November 2021 and ended early in March 2022. Since March 1 of 2022, here is the range of confirmed cases daily:


Confirmed cases have varied between a low of 27,400 last April 3 to a high of 140,000 on July 17. The winter Holiday wave only reached a peak of 76,800. As of yesterday, cases were 37,000. 

But with the advent of home testing over a year ago, fewer and fewer people are having the “official” tests to confirm their cases. To get a more accurate reading, Biobot’s waste particles analysis is the better metric (dotted line = 2,000 copes per mL):


At the peak of the Omicron wave, Biobot measured 4,553 particles per milliliter. By contrast, the lowest number was 40 per milliliter on May 26, 2021, at the point where we thought the initial round of vaccinations might conquer the virus.

Since March 1, 2022, particles have varied from a low of 110 particles on March 9, 2022 to a peak of 1,160 on December 28, with a close secondary peak of 1,140 on July 20. The most recent reading last week on March 1 was 460, even lower than last October’s 536. This suggests that the “real” number of daily cases has varied from about a low of 75,000 to a high of 600,000 during the Holidays.

That cases have been as high as they are is probably a combination of the nearly total abandonment of mitigation measures, plus the fact that each new variant has been indicated as inherently more immune-evasive than the last. Thus BA-1 was superseded by the even more transmissible BA-2, then the ever more transmissible BA-2.12.1, BA-5, and finally XBB.1.5, which according to the CDC is so dominant that as of last week it accounted for over 90% of all cases:


Regionally XBB varies from a “low” of 75%+ in the Pacific Northwest to over 98% of all cases in the Northeast and Mid-Atlantic. In fact, XBB.1.5 has so thoroughly transmitted through the vulnerable portion of the population of the Northeast that that Census Region now has a lower particle count than at any point since last March (dotted line = 2,000 particles per mL; Northeast is gold, West green, South pink, and Midwest violet):


Advances in treatment, the percent of the population that has been vaccinated, and increased resistance from prior infections has meant that hospitalizations, which reached a peak of over 160,000 during the Omicron wave, have varied between just below 10,300 last April 5 to a peak of 47,500 this January 3, with a secondary peak of 46,400 last July 25. Currently hospitalizations are at a new 11 month low of 22,800, just below last October’s 22,900:


Which brings us, finally, to deaths, which during last March were still declining from their Omicron peak of 2600 per day in January 2022. Since then they have varied from a low of 234 at the end of November to a high of 642 in January:


Currently deaths average 371 for the past week.

Deaths during each of the first two years of the pandemic totaled about 500,000. Since April 1 of last year, total deaths have increased by 139,000, for an annual rate of 150,000. While this is the equivalent of a very bad flu season, that masks the fact that vulnerability to dying from COVID is very much a factor of immunization status and age.

Here is the death rate by vaccination status for all age groups in total since the start of the pandemic:


In general the unvaccinated are more than 10x as likely to die from COVID as are the unvaccinated.

But age is also a huge determinant. Here are the death rates by various age groups, broken down into vaccinated vs. unvaccinated.

Age 80+:


Age 65-79:


Age 50-64:


Age 30-49:


Age 18-29:


As you can see, regardless of vaccination status, risk rises steeply with age. A fully vaccinated senior is almost as likely to die of COVID as is an unvaccinated person age 50-64.

To summarize: in the first year of endemicity, case rates have averaged 1 person in 1000 each day, varying between a low of 1 in 4000 to a high of 1 in 500. Hospitalizations have ranged between roughly 10,000 to 50,000 per day (well below the crisis point of roughly 150,000 per day). Deaths have ranged between roughly 250 to 600 per day (vs. 1000 to 2600 during the first 2 years of the pandemic), heavily skewed towards the unvaccinated and the aged. 

Finally, if we break down seniors between roughly 7 million unvaccinated and 57 million vaccinated, with about 75,000 of the former dying in the past 12 months and 30,000 of the latter, we get a death rate of 1 in 1000 for the unvaccinated and 1 in 20,000 for the vaccinated. Over the next 10 years, if that were to continue, unvaccinated seniors have a 1 in 100 likelihood of dying from COVID, while the unvaccinated have a 1 in 2000 likelihood for dying from the disease over that period.

Monday, March 6, 2023

The Fed still seems determined to bring about a recession


 - by New Deal democrat


As I wrote on Saturday, several coincident indicators have stabilized in the past several months (for example, Redbook consumer sales, which has been at roughly 5% YoY for 8 weeks; and payroll tax withholding, which was only up 1.2% YoY for the last 4 months of 2022, but is up 4.7% YoY for the first 9 weeks of this year). This has led to increased speculation that the US will avoid an economic downturn, and maybe even avoid a slowdown altogether.


But unless the Fed changes its perspective, I find it difficult to see that happening.

First of all, Fed Chairman Jerome Powell as well as other Board members have expressed concern about the continued elevated level of inflation in their favorite metric, the “sticky” price index for core PCE’s. Here’s the long term historical view of that in comparison with the Fed funds rate:


And here is the close up since the end of the pandemic recession:


For most of the past 60+ years, the Fed funds rate was higher than core PCE inflation. While that wasn’t the case for most of the last 15 years, it is certainly the case that the 5%+ difference during 2021 was the most by which PCE core inflation exceeded the Fed funds rate. Given the historical comparisons, the Fed probably feels that they should hike at least another 0.50% so that the Fed funds rate at very least is equal to the inflation rate.

And as I’ve noted a number of times before, this is the steepest rate at which the Fed has hiked interest rates since 1982:


Only in 1974, 1980, and 1981 did the Fed hike rates more rapidly. Since it takes time for the effects of Fed rate hikes to spread through the economic system (for example, as I have recently pointed out, housing under construction is less than 1% below its all time record set in October), the downward pressure put on the economy from those rate hikes is far from abating.

Further, some members of the Fed have been transparent that they want to see sharp deceleration in wage growth, which as of January was down from its 2021 peak of 7.0%, but still at 5.1% YoY, an extremely strong rate of gains compared with the last 40+ years:


In order to do that, they are going to have to bring the game of “reverse musical chairs” to an end.  By this game I mean the cycle by which the lowest paying employers at any given time find themselves being unable to fill positions, leading to competition to escalate wages on offer, so as not to be the unlucky loser. So long as the cycle continues, there are always employer “losers,” and so ongoing pressure to continue to raise wages.

And that means bringing down the number of job openings compared with actual hires:


the latest number of which we will find out in Wednesday’s JOLTS report for January.

Another way of looking at the same thing is that the trend line of sales vs. employment, as to which the former has completely outperformed the latter since the rounds of pandemic stimulus:


must be brought back into equilibrium. Unless there is going to be a renewed surge in employment gains (*extremely* unlikely), that means bringing down real sales. And in the past, brining down real consumption has *always* meant recession:


Under these circumstance, I just can’t see how we can avoid a real downturn in consumption and employment.