Saturday, April 30, 2022

Weekly Indicators for April 25 - 29 at Seeking Alpha


 - by New Deal democrat

My Weekly Indicators post is up at Seeking Alpha.

Conditions have been deteriorating for awhile. This week, for the first time, real M2 and at least one credit condition reading contributed to that deterioration in the long leading forecast, enough to make a significant difference.

To get brought up to speed on the potential implications, click on over and read the post. As usual, doing so will also reward me just a little bit for the efforts I put in to obtaining and aggregating the information. 

Friday, April 29, 2022

Lackluster spending, a decline in real income and savings in March; when the house price spiral turns, consumers are in real trouble


 - by New Deal democrat

In March nominal personal income rose 0.5%, and spending rose 1.1%. But since the personal consumption deflator, i.e., the relevant measure of inflation, rose 0.9%, real income declined -0.4%, and real personal spending rose only +0.2%.

While both real income and spending are well above their pre-pandemic levels, I have stopped comparing them with that, but instead with their level after last winter’s round of stimulus. Accordingly, the below graph is normed to 100 as of May 2021: 


Since then spending is up 2.4%, while income has declined -1.3%.

Comparing real personal consumption expenditures with real retail sales for March (essentially, both sides of the consumption coin) shows a small increase in the former and a decrease in the latter for the month. Both numbers can be considered lackluster:


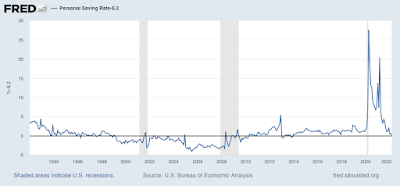
Meanwhile, the personal saving rate declined -0.7% from a revised 6.8% in February to 6.1% in March. The below graph of the last 30 years subtracts 6.1% from all months, so that the current reading is shown as 0 (before then all values were higher than 6.1%): 


Usually the savings rate has tended to decrease as expansions grow longer, leaving consumers more vulnerable to shocks (e.g., gas prices). The current value is the lowest since 2013 (when a different stimulus program ended). In other words, so far consumes are making up shortfalls by digging into savings or tapping a source of credit.

One of my recession models - the “consumer nowcast” - is based on such a shock that is unable to be made up from increased real income, or an increased source of wealth to be cashed in. Income has clearly faltered, and stocks have not made a new high in over three months. That leaves housing equity - and as you may recall from my last installment on housing sales and prices, sales have taken a distinct dive, meaning that I fully expect house prices to follow suit. Whenever that happens, unless something else reverses, consumers - and the economy - are in trouble.


Thursday, April 28, 2022

Q1 GDP negative; but more importantly, two of three long leading indicators have deteriorated


 - by New Deal democrat

First things first: yes, it was a negative GDP print. No, it doesn’t necessarily mean recession. I’ve been expecting weakness to show up by now ever since last summer; so here it is.

But the big culprits were non-core items. Personal consumption expenditures, even adjusted for inflation, were positive. The three big negatives were a big decline in exports vs. imports, followed in about equal measure by a decline in inventories and a downturn in defense production by the government. The inventory adjustment is temporary. So, most likely, was the downturn in defense production. We’ll see about exports and imports (supply chain issues!).

But there are two components of GDP which are helpful in finding out what lies ahead: real residential fixed investment (housing) and proprietors income (a proxy for business profits). Both of these have long and good track records as helping forecast the economy one year in advance. Here, the news was mixed, but a little more positive than negative.

Proprietors income (blue in the graph below) rose 1.2% nominally. Since unit labor costs have averaged an increase of 0.9% per quarter over the last year, they probably rose to a new high on an adjusted basis as well. This generally rises and falls with corporate profits (red), although it is not quite so leading. But since the latter won’t be reported for at least another month, it is a good placeholder:


So, this was a positive.

The news was more mixed in housing. Real private residential fixed investment rose slightly:


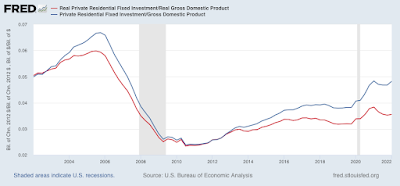
Further, both nominal and real residential fixed investment as a share of GDP (the actual measurement that is part of the long leading indicators) also rose for the quarter:


So far, so good. 

The problem is that recessions have typically happened on average 7 quarters after the last peak in this measure. And even with the improvement in Q1, this measure is still below its peak of one year ago. So real residential investment is still a negative for forecasting purposes.

In addition to the above two long leading components of GDP, real money supply for March was reported on Tuesday, and the news wasn’t good there, either.

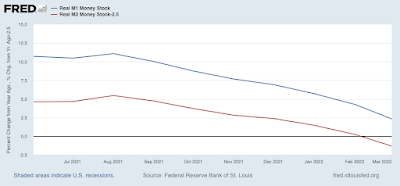
Recessions have typically occurred one year or more after real M1 turns negative, or real M2 is up by less than 2.5% from one year previous. Here’s what they look like through March:


Real M1 is up 2.4% YoY, and has deteriorated rapidly, although it is still a positive. Real M2 is also up less than 2.5%, which means it is consistent with an oncoming recession.

All in all, the picture continues to deteriorate, even though the profits component held up in Q1.


Jobless claims: yet another 50+ year low in continuing claims


 - by New Deal democrat

[Programming note: I’ll comment on the Q1 GDP report later this morning].

Initial jobless claims declined -5,000 to 180,000, but above the recent 50+ year low of 166,000 set in March. The 4 week average rose 2,250 to 179,250, compared with the all-time low of 170,500 set three weeks ago. Continuing claims declined -1,000 to 1,407,000, yet another new 50 year low (but still well above their 1968 all-time low of 988,000):


This is yet another installment in the saga of “nobody is getting laid off.” The “job openings” component of the March JOLTS report, which will be released next Tuesday, is the next important metric, because that will tell us if there is any abatement in the number of employers participating in the new game of employment “musical chairs.”

Wednesday, April 27, 2022

Coronavirus dashboard for April 27: Estimating the BA.2.12.1 wave


 - by New Deal democrat


The CDC updated its variant proportions data yesterday. BA.2.12.1 cases grew from 19% to 29% of all US cases: 


and from 45% to 60% in NY and NJ. At the other end of the spectrum, BA.2.12.1 was only 9% of cases in the Pacific Northwest and 8% in the South Central region. BA.1 is down to only 2% of cases:


Focusing on NY and NJ, NJ has had a little spurt in the last couple of days, probably just due to an artifact of daily reporting one week ago, and is now up 15% for the week. Deleting that artifact, NJ is only up 4% for the week. NY appears to be peaking right now, 6.5 weeks after its recent lows, with cases essentially flat for the last 6 days, and up only 7% for the week. Cases tripled during that period:


For the US as a whole, as of yesterday cases rose to 50,300, and are up over 20% in the last week:


Hospital admissions rose 400 to 13,167, an increase of  almost 20% in the last week, but still a very low historical number:


Deaths declined to a new low of 338. Deaths were only lower in late June and July of last year:


Applying the template from NY to the US as a whole, I suspect we will see a US peak from BA.2.12.1 by about Memorial Day at 75,000-90,000 cases and 25,000-30,000 hospitalizations. Because deaths have not bottomed yet, where they will peak in this wave is much more uncertain, but as of now they seem likely to peak a little under 1000 by mid year.

The CDC also published an Important study of seroprevalence through February. I’ve cleaned up the text somewhat, and omitted the 2%-3% confidence interval noted for each subgroup.

 “During December 2021–February 2022, overall U.S. seroprevalence increased
  • From 33.5% to 57.7%. 
  • from 44.2% to 75.2% among children aged 0–11 years
  • from 45.6% to 74.2% among persons aged 12–17 years.
  • from 36.5% to 63.7% among adults aged 18–49 years
  • from 28.8%  to 49.8% among those aged 50–64 years
  • from 19.1% to 33.2% among those aged ≥65 years.

“[In summary, a]s of February 2022, approximately 75% of children and adolescents had serologic evidence of previous infection with SARS-CoV-2, with approximately one third becoming newly seropositive since December 2021. The greatest increases in seroprevalence during September 2021–February 2022, occurred in the age groups with the lowest vaccination coverage ....”

According to the CDC, 66%, or 196M of 258M adults have had at least 2 shots, and 50M, or 90% of seniors have. But only 43% of eligible children (ages 5-17) have had 2 shots.

The CDC noted that these findings are subject to some limitations, most importantly that “all samples were obtained for clinical testing might overrepresent persons with greater health care access or who more frequently seek care,” and “these findings might underestimate the cumulative number of SARS-CoV-2 infections because [testing for] seroprevalence cannot account for reinfections.”

I see no way to read this study without concluding that somewhere between 90%-95% of all Americans have either been vaccinated and/or infected (since 60% of the 34% unvaccinated amounts to only 13.6% of the population - and the unvaccinated have had confirmed cases at a *much* higher rate than the vaccinated). This is going to put enormous evolutionary pressure on the virus in the direction of immune avoidance. I think this also strongly suggests that the fatality rate will continue to decline.

So we will await the next variant, which if it arrives 3-4 months after BA.2.12.1, will be in June or July.


Tuesday, April 26, 2022

Prices soar, sales drop; oh by the way, sales lead prices


 - by New Deal democrat

New home sales declined -8.6% in March, which isn’t a sharp as it seems, since declines of this magnitude happen 2-3x/year. The series is also heavily revised, so no new month’s number should be given too much weight. On the other hand, new home sales are frequently the first series to decline after a peak, so the fact that they have not made a new high since January of last year, and are now almost 25% below that mark is certainly a sign that higher interest rates and prices have taken their toll:


Very much on the other hand, the month over month % change in both the Case Shiller and FHFA Indexes rose at record paces of ~2% last month alone:


All of this has caused the National Affordability Index kept by Realtor.com to decline to 135:


This is the lowest level of affordability since 2008 (note below graph stops in 2018)


And as I always say, sales lead prices, so here is the YoY% change in sales (averaged quarterly, blue) vs. both FHFA and Case Shiller prices:


So it shouldn’t take a genius to figure out where I think home prices are headed. 

Lessons for the present from the Postwar Boom


 - by New Deal democrat

One of the things I harp on from time to time is that from 1932 to 1956 there was never a yield curve inversion, and yet recessions certainly did happen! Too many modern models get hung up on Fed intervention.

But what happens when the Fed doesn’t intervene, as was the case for that 25 year period? Or is perhaps the case now, with the Fed funds rate at record levels below the inflation rate?

The case of the immediate postwar Boom of 1946-48 and the recession of 1949 bears a lot of similarities to our current situation - but some significant differences too.

I wrote a lengthy post about it, and it is up at Seeking Alpha.

A factor I didn’t even get in to in that discussion was how the GI Bill, and the swift integration of returning servicemen into the labor force mirrors the swift increase in re-employment of those laid off during the initial period of lockdowns and closures.

For example, the modern unemployment rate statistics just started to get published in 1948, and like now, it was close to 3%:


As usual, by clicking over and reading, you should learn some important historical information, and it also  puts a couple of pennies in my pocket as well.