- by New Deal democrat
Dan Guild follows presidential approval closely, and uses it to model election outcomes, including State level as well as Congressional and Senate races. He’s been very consistent, and very good.
For the past several months, his hair has been on fire about a real decline in Biden’s approval ratings, for example,
here. He is particularly concerned about
the big decline among young adults, who all but boycotted Tuesday’s State level elections.
So, why has Biden’s approval rating declined? There are three very good reasons, two of which are related to economics.
Let’s start with his inability to get his major economic program, “Build Back Better,” through Congress.
Here’s an excellent graph comparing the last 4 Presidents’ first year in office:
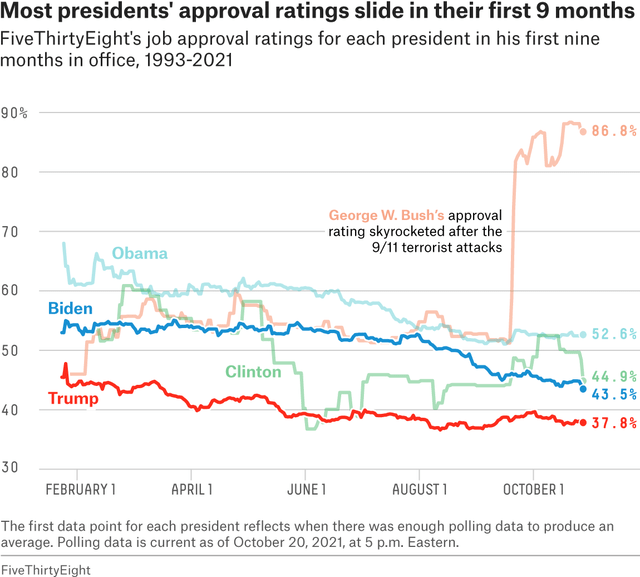
What is most noteworthy is that all 3 of the last Presidents have had similar trajectories, and for largely similar reasons. After initial success passing emergency stimulus, Obama’s Affordable Care Act was hopelessly mired in Congressional committees. Similarly, Trump was unable to “repeal and replace” Obamacare.
When a President is completely stymied by Congress, their approval rating tanks.
Secondly, there’s the price of gas. Back in the George W. Bush Administration, there was a graph entitled “Presidential approval: it’s a gas, gas, gas” which persuasively showed that Bush’s approval rating closely correlated with the price of gas. Quite simply, people use the price of gas as an easy proxy for inflation (indeed, in my “Weekly Indicators” posts, the price of gas is a component of the “Miller Score” insofar as it helps measure the trade off between inflation and unemployment).
I recall that I occasionally noted that this heuristic continued in the Obama Presidency. His approval generally rose and fell with with price of gasoline as well.
So let’s update through the present. Below is the price of gasoline as a share of disposable personal income (blue) vs. consumer sentiment as measured by the University of Michigan (inverted, right scale, red):
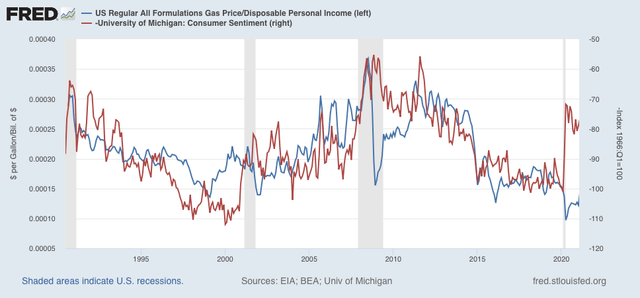
For the past 30 years, the two series track pretty well with the exception of periods right around recessions, where they tend to invert. That is to say, consumer sentiment generally falls as the price of gas rises, except when gas prices tank during recessions coincident with sentiment being at its worst.
Now here is the last two years, to focus on the pandemic:
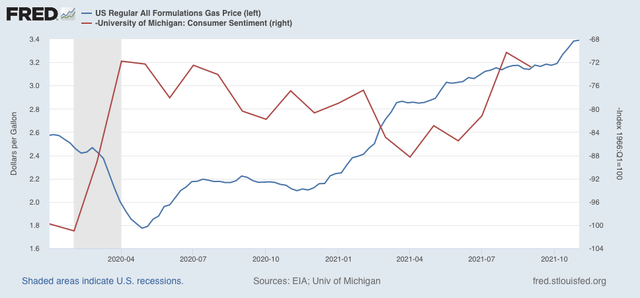
Beginning this past spring, gas prices and consumer confidence reverted to their normal configuration. The confidence numbers end with September, but October was actually a little worse, consistent with the continued rise in gas prices last month.
Consumers are noticing the pinch from gas prices, and it has influenced their opinions of Biden.
Finally, let’s turn to the one non-economic variable: the Delta wave.
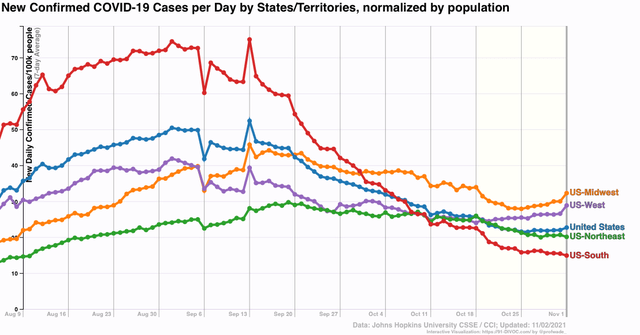
Here is the last 6 months of US coronavirus infections per capita:
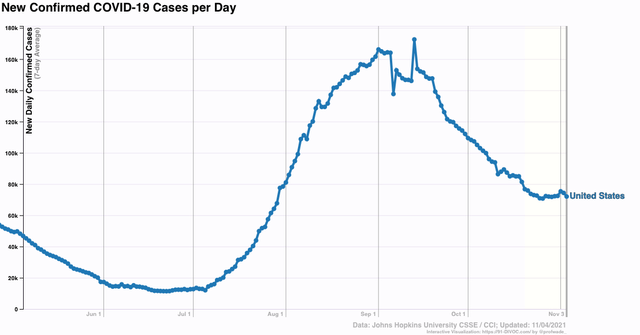
As you probably already recall, with vaccines the number of cases fell precipitously this past spring, to a low point of 11,300/day in late June. From that point until Labor Day, the Delta wave hit like a tsunami as case rose sharply to over 160,000/day. In the two months since, only half of that increase has been taken back by the Delta wave rolling out, as the US is still averaging over 70,000 cases/day.
I think the 3 above reasons are a succinct and accurate summary of the reasons for the decline in Biden’s popularity, and a reason why Election Day did not go so well for Democrats (in addition to the simple behavioral fact that anger is a much stronger motivator for voting than gratitude, a factor in all off-year elections).
If inflation abates (likely), COVID cases decline (likely with increased vaccinations and more resistance due to higher numbers of previous infections), and Biden is able to get the Build Back Better reconciliation through Congress (?????), then Democrats are going to be - relatively speaking - in better shape for the 2022 midterms.


