Saturday, March 12, 2016
Weekly Indicators for March 7 - 11 at XE.com
- by New Deal democrat
My Weekly Indicator post is up at XE.com.
For the last month I have pointed out that the trends that were established in 2015 are all reversing. That process continued this week, as one more turned positive, and one deteriorated closer to negative.
Friday, March 11, 2016
Potpurri for a light week of economic data
- by New Deal democrat
Well, this has been just about the lightest week I can ever remember for economic news. Even the JOLTS report, which is usually issued the week after the jobs report, was put off until next week.
So here are a few things to hopefully interest you until something actually, you know, happens.
1. Labor conditions were negative, but there's no cause for imminent concern.
The Labor Market Conditions Index does a good job forecasting the trajectory of the YoY% change in jobs. Here's the long view:
Here is the last 5 years:
We're not any worse than we were in 2012, so there's no cause for panic. On the other hand, the continuing weakness in the LMCI indicates that were are going to get progressively weaker jobs gains in the coming months.
2. Wholesalers' inventory to sales ratio. OUCH!
No updated graph, because FRED waits for retail sales to update total sales and inventory data.
The high frequency weekly data has been pointing to a bottom in the shallow industrial recession. That wholesalers' inventories grew as well as sales falling contradicts that narrative. Bad news. Hopefully a one-month glitch? I dunno.
3. Can you really have a recession when nobody is getting laid off?
Jobless claims:
I mean, seriously, how could that be even possible!?!
4. Speaking of high frequency weekly data...
My rule of thumb for not-seasonally-adjusted data is that, when the series is less than half as good, or bad, as it was at its best/worst YoY, then it has probably made a bottom or top
Here's steel (through February):
Here's steel (through February):
and staffing:
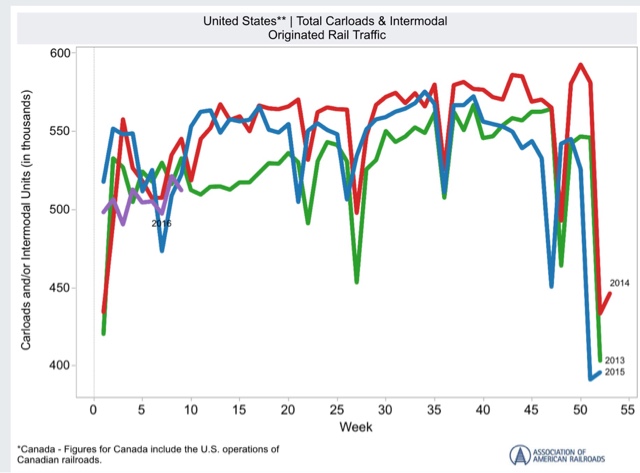
and rail (this year is that purple squiggle on the left):
Steel does look like it has bottomed. Staffing not quite yet, although the YoY comparisons are clearly "less bad" than they were in the September through December frame. Rail is probably benefitting from less bad February weather this year - another two or three weeks of data will tell the tale.
Wednesday, March 9, 2016
Updating the mid-cycle indicators: part 2 of 2
- by New Deal democrat
A majority of the 7 mid-cycle indicators should have turned south well before the beginning of a recession. Since lots of commentators are talking about recession now, I've taken an updated look at these 7 indicators.
Part 2 of 2, with the conclusion, is up at XE.com.
Tuesday, March 8, 2016
Updating the Mid-cycle indicators: part 1 of 2
- by New Deal democrat
If the mid-cycle indictors haven't turned, talk of an imminent recession is clearly premature.
So, have they? I take a detailed look in two parts. Part 1 is up at XE.com.
Monday, March 7, 2016
Four out of five leading jobs indicators show weakening
- by New Deal democrat
Every month when I discuss the jobs report, I have a section devoted to those parts of the report which tell us where the overall numbers are likely to go in the future.
We may be at a turning point for those numbers, as 4 out of 5 either look like they are turning or have already turned.
First, here are temporary jobs:
Note that these typically turn down about a year before the overall jobs numbers turn down.
Here is a close-up on the last year:
These look like they are making a peak now (or may have made a peak 2 months ago).
Next, here are the number of unemployed between 0 and 5 weeks. This was identified by Dr. Geoffrey Moore, the founder of ECRI, and in his 1993 book he wrote that it was more accurate than initial jobless claims:
These are quite noisy. But they have not made a new low in 5 months.
Third, here are jobs in manufacturing:
In the post-World War 2 era, these sometimes but not always peaked significantly before the onset of a recession. Sometimes they went sideways for awhile before rolling over as well.
Since 1990, they have undergone a secular decline. But even then the first derivative (i.e., rate of decline) accelerated before the last 2 recessions (red, right scale):
Now here is a close-up on the last 5 years:
These have pretty clearly gone sideways in the last year, and the first derivative has declined.
Fourth, here is the manufacturing workweek:
This is one of the actual components of the LEI. Note that these peaked almost two years ago, although they are improving off their recent bottom in late 2015, thus being consistent with an ebbing of the shallow industrial recession.
Finally, here are residential construction jobs, which also typically peak a year or more before jobs as a whole turn down:
These are still growing, as the housing sector is doing quite well.
The poor improvement in manufacturing jobs is a representation of the shallow industrial recession in the economy during the past year. But the other three either have not made new highs in months, or even going on two years, suggesting that the overall labor market is decelerating. This is a caution flag for jobs possibly turning negative next year.


