Texans have a saying: if you don't like the weather, wait 10 minutes and it will probably change. So, too, is the character of the current US equity markets. Three weeks ago the market experienced a sell-off, leading some commentators to once again argue the market was over-valued and that the long-awaited correction (which was going to be large) was upon us. In response, I argued that the underlying economic fundamentals didn't support that conclusion (Last week, I also theorized that the US markets were in a slow-motion downward rally to their 200 day EMA last week, so I'm certainly not perfect). Two weeks ago, the markets formed a v-shaped bottom from which they have been rallying ever since.
The rally has gained momentum from two important sources. The first is a very strong initial 3Q US GDP reading:
Real gross domestic product -- the value of the production of goods and services in the United States, adjusted for price changes -- increased at an annual rate of 3.5 percent in the third quarter of 2014, according to the "advance" estimate released by the Bureau of Economic Analysis. In the second quarter, real GDP increased 4.6 percent.
And the second is a massive liquidity injection from the Bank of Japan:
Bank of Japan Governor Haruhiko Kuroda yesterday expanded what was already unprecedented monetary stimulus, delving deeper into financial markets to boost purchases of assets from government debt to real-estate investment trusts. Hours later, the Government Pension Investment Fund, helmed by Takahiro Mitani, said it would put half its holdings in local and foreign stocks, double previous levels. The Topix index soared the most in a year, leading a rally in equities around the world, as the yen plunged to the weakest since January 2008.
Both of these events are very equity positive, contributing to the current rally.
The 30-day SPY chart really highlights this rally. Prices started at a low of 181.92 mid-way through trading on the 15th. Since then they've been rallying, using various EMAs as technical support. There have been five intra-day gaps higher and several consolidation areas to support these gains. Also note there have been no major sell-offs along the way; prices have continued to move higher in a solid technical manner. This is a very impressive technical rally.
The daily chart also shows a solid rally. Prices have quickly rebounded from below the 200 day EMA and are now in record high-territory.
Adding to the upward momentum is a very bullish development in the micro-cap index. The overall trend shown in its daily chart has been downward since the beginning of February. But prices last week ended just about technical resistance. Underlying indicators -- the rising MACD and CMF along with a strengthening RSI index -- point to a continued move higher.
And last week's overall performance is also very encouraging. Tech, financials, industrials and cyclicals all did well.
The primary areas of concern are still in the bond market. Last week, the Fed announced it was ending QE -- although they will still be reinvesting principal payments. This statement takes one of the largest bids out of the fixed income market. But the bond market didn't meaningfully sell-off. Instead, both the 7-10 year charts (top) and 20+ year charts (bottom) continued a slow but consistent move lower. Both also remain above their respective yearly trend lines. This is not fatal, but simply something to keep an eye on.
While the rally has been impressive, the S&P 500 still faces strong headwinds in the form of high valuation. According to the WSJ's market data report, the PE ratio stands at 18.68 with a dividend yield of 1.96%. While this isn't over-bought, it's a pretty hefty current valuation. And according to the same source, the forward PE is 16.65 -- again, not overbought but a not exactly a value proposition. Earnings are growing, but not at a blockbuster rate. From Zack's Research:
Including all of this morning’s earnings announcements, we now have now Q3 results from 245 S&P 500 members that combined account for 60.2% of the index’s total market capitalization. Total earnings for these 245 companies are up +4.3% from the period last year, with 70.2% beating earnings estimates. Total revenues for these companies are up a much stronger +4.6%, with 52.7% beating top-line estimates.
But starting next quarter, we'll start to see a negative impact as companies with a moderate to high level of international sales exposure will have a higher dollar lowering their earnings.
So, in conclusion, we're where we were a few weeks ago: a market that is pretty expensive that has decent earnings growth potential but whose various companies also face some a weak international environment and a stronger dollar. That limits the upside potential a bit.
Saturday, November 1, 2014
Weekly Indicators for October 27 - 31 at XE.com
- by New Deal democrat
My Weekly Indicator post is up at XE.com . It may have been Halloween yesterday, but there was nothing scary in this week's economic data.
Average US gas price falls to below $3 a gallon!
- by New Deal democrat
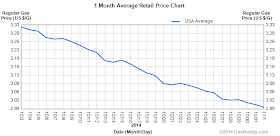
According to price graphs from GasBuddy, in the last 24 hours average gas prices in the US nationwide have fallen to $2.99 a gallon:
Here's the same graph expanded to the last 4 years:
This may seem tiny. After all, if I bought $50 of gas a week one year ago, and the price falls by 10% compared with a year ago, that only means an additional $5 in my pocket. But for many lower income families, that $5 is a significant addition to the ability to support themselves. Now multiply by about 130 million households for just one week's impact on the economy.
I have no idea how long this will last. But for now, this is about as close to unalloyed good news as you can get.
Friday, October 31, 2014
Employment cost index shows some improvement on the wage front
- by New Deal democrat
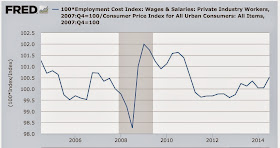
This morning the BLS released its quarterly Employment Cost Index. And the news was pretty good. Overall compensation, including benefits, rose 0.7% in the quarter. Wages rose 0.8%. Since consumer prices actually fell ever so slightly during the quarter, the entire increase was seen in workers' paychecks. And it is a median, rather than mean, measure, so it is not skewed by high earners.
On a YoY basis, wages rose 2.1%, and overall compensation 2.2%. This is the best YoY improvement during the entire recovery:
On an absolute basis, and adjusted for inflation, median wages are still below their 2009 peak, but are at their best level in 3 years:
For contrast, here are inflation adjusted average hourly wages for nonsupervisory workers, a monthly measure from the jobs report:
These have also improved and are less than 1% from their 2010 high.
Not worth three cheers, or Happy Day are Here Again. But definitely one cheer. As the labor market slowly tightens, as predicted wages are beginning to improve.
Thursday, October 30, 2014
Apartment rents still not in a bubble, despite record low vacancy rates
- by New Deal democrat
I have a new post up at XE.com.
Apartment vacancy rates are lower than they have ever been since the series started being kept, but median asking rents, both in inflation-adjusted terms and also as a percentage of median wages, are still relatively subdued.
Wednesday, October 29, 2014
Weekly Indicators for October 20 - 24 at XE.com
- by New Deal democrat
My Weekly Indicators piece for last week is Up at XE.com
The recent theme of positve, but less strongly so continues.
Tuesday, October 28, 2014
September housing reports: interest rates show their effect
- by New Deal democrat
Aaaannnd, I'm back! Didja miss me?
Anyway, I have a new post up at XE.com, discussing how lower interest rates are showing up in slightly improving housing reports.
Sunday, October 26, 2014
John "Trillion Dollar Loss" Hinderaker's Stunning Ignorance of Economics Revealed
Over at Powerline, John Hinderaker is stating that Hillary Clinton is ignorant of economics.
So, let's just review Mr. Hinderaker's absolute and demonstrable history of having literally zero clue about the same topic.
Hinderaker was one of the numerous people who argued that the Fed's QE program would lead to a massive spike in inflation. As we all know now, this didn't happen. Bloomberg calculated the net investment returns a Hinderaker portfolio would have earned and came up with a net loss of $1 trillion.
So, before you give any credence to Hinderaker's statement, remember that if you'd followed his advice, you would have lost money. BIG MONEY.


