Saturday, December 21, 2013
Weekly Indicators for December 16-20 at XE.com
- by New Deal democrat
Weekly Indicators are up at XE.com. Coincident measures have weakened significantly this month.
Friday, December 20, 2013
Yesterday's poor initial jobless claims report: some signal buried in the snow of seasonal noise?
- by New Deal democrat
Yesterday's surprisingly poor initial jobless claims report of 379,000 was certainly a head-scratcher. I didn't see any obvious explanations. At the same time, coming in the middle of the holiday season, only two weeks after a 298,000 report, and with no other economic data showing any serious signs of tanking, my inclination is to treat it as noise and wait to see if a few more weeks sorts the matter out.
But let's go deep into the weeds for this one.
To begin with, December seasonal adjustments can be huge. Here's a graph of non-seasonally adjusted initial jobless claims divided by seasonally adjusted claims for the last 10 years:
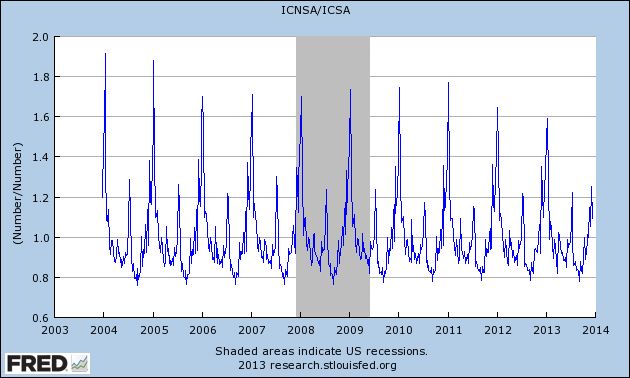
It's pretty easy to see that we are at the time of year when the largest seasonal adjustments of the year take place.
Not only that, but the variation just from week to week can be large. For example, the adjustment in the previous week was ~0.80. Last week it was ~0.92. Had the previous week's seasonal adjustment been used, jobless claims would only have been reported at 331,000!
Even for this reference week, which creeps by a day or two YoY, the adjustments can vary substantially. This year's 0.92 is the smallest adjustment for the reference week in the last 10 years. Last week it was 0.91, but in 2004, 2005, and 2009 the average of the two closest reference weeks was 0.85 - which would give us a report of 343,000. In other recent years, it would have been higher than 343,000 but lower than 375,000.
None of this is to fault the DOL, The point is simply that seasonal adjustments are particularly prone to noise at this time of year.
Other evidence that seasonality may be playing havoc with the claims number comes from the fact that, as I've said a number of times before, weakness starts with a slowdown in hiring before there is an increase in firing, i.e., hiring precedes firing. Below is an update of a scatterplot graph I've run before comparing the monthly jobs report (net hiring) with the monthly average of new jobless claims (firing), in which the last 20 months are highlighted in red:
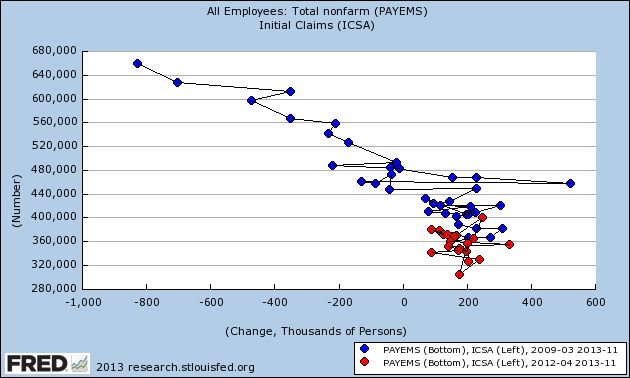
Before a recession, the scatterplot points shift significantly to the left. But as you can see from the above, while the points have stagnated, there has been no significant shift to the left in recent reports.
Further evidence of the relative strength in hiring comes from this graph of the YoY% change in jobs, which has been showing a slight increase during this year:
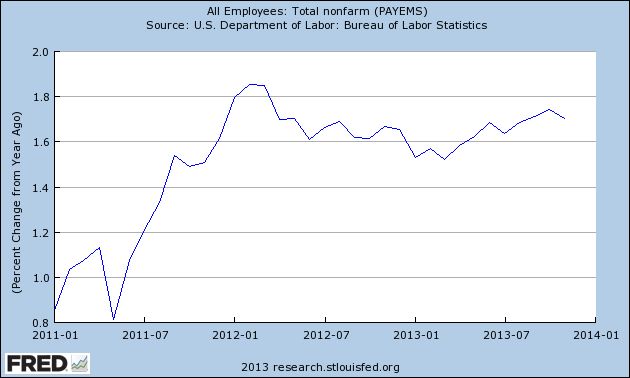
This is simply not something I would expect if we were on the cusp of a near-recession.
Also, even if there is "signal," it still may be affected by the season. Last year, due to tax shifting, there was a huge spike in personal income in November and December. That was reflected in large gains in the 14 day average of Gallup's daily consumer spending report, which ramped up from $65 in November to $90 in December 2012. This year in the equivalent period spending has only increased from about $87 to $100 at its peak so far.
What follows is my best guess, so take it with appropriate grains of salt, but if retailers mistakenly expected a similar ramping up this year, they have been sorely disappointed. Not to mention, in many parts of the country there have been some unusually significant December winter storms, which kept shoppers home. Those retailers may have begun layoffs of seasonal hires early, which would have a heightened impact on the jobless claims reports.
The bottom line is, while it looks like some actual signal (in most years, even with the seasonal adjustment, the number would have been reported as 350,000 or more), there is an excellent chance that this week's jobless report is still primarily seasonal noise.
Thursday, December 19, 2013
Interest rates' effect on housing in 2014
- by New Deal democrat
We've had interest rates back up by over 1% since April. I have a piece up at XE.oom discussing the likely negative impact of that rise in rates on housing in 2014, disagreeing (politely of course) with the position taken by Bill McBride a/k/a Calculated Risk.
Wednesday, December 18, 2013
Subdued inflation takes average wages to near 3 year high
- by New Deal democrat
So anyway, we've gone from a dry spell where there was barely any data to write about, to a deluge of new information, which means I don't have the time to write posts highlighting all the interesting (well, interesting to a nerd like me) trends!
Yesterday was the first time since I've been using the price of gas as a KISS method to track inflation that my forecast was off: non-seasonally adjusted CPI was -0.2% and seasonally adjusted was unchanged, vs. unchanged NSA and +0.3% seasonally adjusted as I had forecast. But YoY inflation was +1.2%, which was within 0.1% of my +1.3% forecast.
One by-product of this subdued inflation, caused in large part by somnolent gas prices, is that real, inflation-adjusted wages are starting to rise again. Here's a graph of average hourly wages on non-supervisory workers adjusted by inflation for the last 10 years:
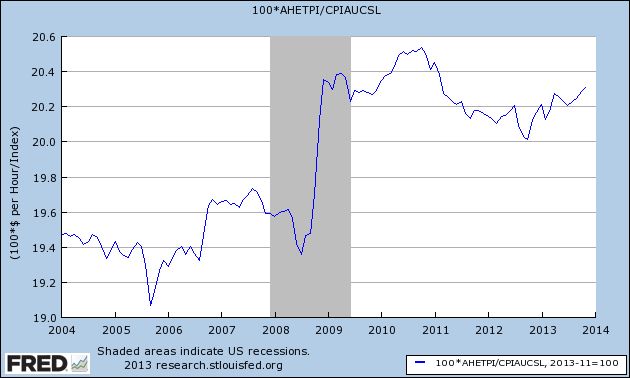
Yes, real wages did spike higher during the Great Recession, because in late 2008 gas prices fell from $4.25 a gallon to about $1.50 a gallon. They declined in 2011 and 2012 as gas prices went back as high as $3.95 a gallon again.
With the loosening of the Oil choke collar in 2013, however, real average wages as of yesterday rose to their highest level since February 2011, nearly 3 years ago.
The trend has turned positive, with YoY real wages rising by about 1%, as shown in the graph below of the YoY% change in real wages:
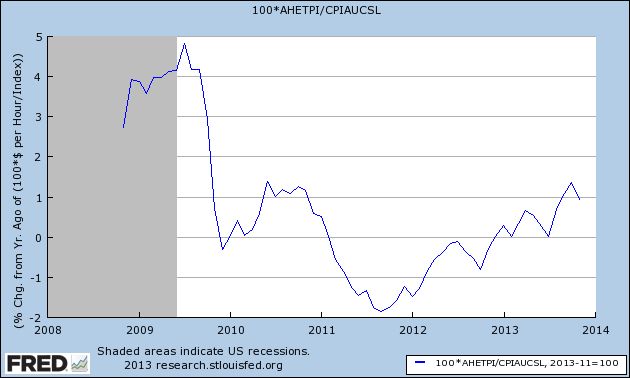
Since YoY real wages are about 1% below their 2010 peak, this means that we could actually establish a new high in average (not necessarily median) real wages for nonsupervisory workers by the end of 2014 - if gas prices remain somnolent.
Not grounds for "Allelulia's," but a welcome trend nevertheless. One which is going to be overlooked by about 98% of econobloggers because it doesn't fit their worldview.
Tuesday, December 17, 2013
Monday, December 16, 2013
Industrial production now higher than before recession.
- by New Deal democrat
This is Up over at XE.com.. At this point, 3 of the 4 indicators used by the NBER to determine recessions and expansions have risen above their pre- Great Recession peak.
France Holding Back EU Recovery
Above is a chart of the French ETF. First, notice the strong rally from mid-July to mid-November, when prices rose from a low of 22.58 to to a little over 28 -- a net percentage gain of 25.5%. Prices consolidated sideways after the move higher, trading between the lower 27s and 28s. However, now prices are slowly drifting lower, pulling the shorter EMAs with them. Also notice the declining MACD and negative reading on the CMF.
Sunday, December 15, 2013
An NDD holiday special: semi-healthy pecan pie with maple, caramel, and peanut butter
- by New Deal democrat
My mom made a terrific pecan pie. Unfortunately, most pecan pie recipes basically consist of corn syrup, sugar, and pecans, and they taste that way. They may as well be obesity and diabetes on a plate. So I experimented to come up with a recipe that is relatively healthy, has less calories, and is more flavorful. Here is my own, original, recipe for pecan pie that you can enjoy several times during the holiday season without guilt.
Start with either a store-bought or homemade 9 inch pie crust.
Pre-heat the oven to 350 degrees.
Take about 12-16 caramel candies, and put in a measuring cup.
Add 3 tablespoons of brown sugar.
Add 3 tablespoons of Splenda.
You want the total to equal 3/4 cup. You may need to add or subtract one or two of the candies so that you wind up with the right amount.
Put in a saucepan over low heat. Add:
1/4 cup (4 tablespoons) peanut butter
3/4 cup real maple syrup (dark is better than light)
1/2 teaspoon vanilla
1 tablespoon orange zest (or orange juice)
Stir as necessary. Keep the mixture over the heat just long enough so that the caramel and peanut butter completely melt. Then set aside.
In a separate bowl, add 1/4 cup light whipping cream
2 whole eggs
2 egg whites
Stir the eggs and whipping cream until thoroughly mixed.
Add the eggs and whipping cream to the saucepan, folding in till mixed thoroughly.
Take 1 and 1/2 cup chopped pecans, sprinkle over the pie crust in the shell.
Add the mixture from the saucepan.
Place in the oven and cook at 350 degrees for about 40-45 minutes, until the pie has jelled. The pie filling will inflate some while it cooks, so you might want to put some aluminum foil underneath to catch any overflow!
The result is a pecan pie that is lighter, more flavorful, has fewer calories, and has at least a passing resemblance to nutritional value. The challenge will be waiting until it has cooled off some before digging in. Enjoy!


