Saturday, December 14, 2013
Weekly Indicators for December 9-13 at XE.com
- by New Deal democrat
Weekly Indicators are up at XE.com. Still positive, with the same cautions I've been giving for several months.
Come January, the picture could change significantly.
Friday, December 13, 2013
Unemployment: positive and improving, but not good
- by New Deal democrat
Over at Digby's place, David Atkins wrote that Democrats shouldn't be crowing about the unemployment rate. I'm not sure if anyone has actually been doing that, but on the other hand, I don't think we should pretend that no progress has been made on the unemployment front, either.
Too often I see comparisons that boil down to looking at the basic or U-3 unemployment rate before the recession vs. some other measure, like the U-6 rate, after the recession. Or the comparisons never look at prior recessions and recoveries. That's comparing apples and oranges.
Another argument has centered on the employment to population ratio, contrasting the issue of discouraged workers vs. Boomers retiring. On that score, sometimes it appears that the observing is arguing an all-or-nothing point of view. That isn't correct, either. The issue really is, how much is due to discouraged workers vs. how much is due to retiring Boomers. My point of view is, there's no really good data, and if you simply ascribe 50% to each, you probably aren't far off. That the ratio of unemployed 25 to 54 year olds has stayed in the basement argues that there is still a lot of work to do, no matter what.
One attempt to explain the data has come from the Economic Policy Institute. They claim to have a metric for "missing workers" that takes into account Boomer retirements. One problem with their work, as I pointed out earlier this week, is that the monthly Household Survey, the data on which they rely, already specifically has a measure ofworkers who want a job now but aren't actually looking, the precise thing they claim to be estimating. I don't understand why I should give much credence to their metric, which relies upon the continuing accuracy of an estimate made in November 2007, when I have the up to the present data specifically published each month.
Beyond that, their measure shows an average of -20,000 or more "missing workers' over a 24 month + period from summer 2006 through autumn 2008. A negative number of "missing workers" is a logical impossibility and cannot be laid off on monthly variance where it occurs so consistently for so long. In fact, if the nonfarm payrolls report has been an accurate measure for the last two years, their current reading of nearly 6 million "missing workers" might not just be wrong, it might be nearly impossible! - but I haven't crunched the numbers enough to be reasonably sure.
So what is the overall story as to unemployment? The below graph shows the situation pretty well, I think The normally reported U-3 rate, currently at 7%, is in blue, and the measure including marginally attached and part time workers for economic reasons, or U-6, is in red. The green line is the number of unemployed workers plus those not in the labor force, but who say they want a job now. Finally, the broad measure of discouraged and part time workers, plus those who haven't looked, but say they want a job now, is in orange:
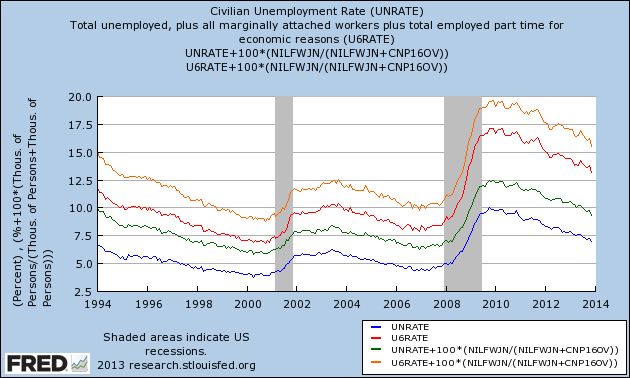
The bottom line for all of these measures is really the same. There has been substantial improvement since their worst readings at the end of 2009. The U-3 bassed measures have fallen about 3%, and the broader U-6 measures, by nearly 5%.
But this is tortuous progress over a 4 year period. During the period from early 1933 through early 1937, the rate most analogous to U-3 fell from about 25% to nearly 10%.
More pointedly, while the unemployment rate is positive, and it is improing, it can hardly be characterized as "good." Back when I rode my pet T-Rex to Bedrock Junior High in the 1960's, 6% (U-3) unemployment was considered the dividing line between a fair and a poor economy.
That strikes me as about right now as well. At the rate the unemployment situation is improving, it will take another year for the U-3 rate to cross that threshold. It will take another 2 years for all of the rates shown above to reach the levels they were at in the late 1990's and throughout most of the 2000's up until the "great recession." And there is no guarantee at all that we won't have already started our next recession by then.
Thursday, December 12, 2013
A note about today's initial jobless claims and retail sales data
- by New Deal democrat
Since I am sure there will be breathlessly wrong Doomer commentary, I just wanted to confirm something you may have already read elsewhere about this morning's initial jobless claims number: this was due to seasonality (Thanksgiving day falls in different reference weeks in different years) and payback for last week's 298,000 number. When you average this morning's 368,000 number with last week's revised 300,000 number, you get 334,000, which is right in line with the recent trend.
The 4 week moving average was 328,750, again right in line with the overall recent trend.
Retail sales, however, were a straightforward good number, and especially the upward revision of October to +0.6%. Since we actually had -0.1% deflation in October, that makes the real retail sales number +0.7%. November's +0.7% retail sales number will probably have to be adjusted by a +0.3% inflation report, which will make it a net +0.4%.
YoY real retail sales are a pretty good leading indicator for jobs. From mid-2012 through early 2013, YoY real retail sales averaged generally under +2.5%. Since June of this year, however, with one exception real retail sales YoY growth will have averaged over 3.0%. This suggests at least a slight strengthening of the monthly jobs report numbers in coming months.
(Note: corrected for original error of Oct. retail sales of 0.8%. It does not change the YoY improvement).
Wednesday, December 11, 2013
An updated look at the US long leading indicators
- by New Deal democrat
This post is up At XE.com. Why I see continued growth for at least the next 9 months.
Tuesday, December 10, 2013
Oil Rebounds From Recent Lows
After falling to the 91.77 level, oil has rebounded a bit, hitting resistance at the 98 price level. This level has proven significant for oil for the last year. It was the prime point of resistance for oil's attempted rally during the first half of 2013. It is also an important Fibonacci level, adding further strength to its technical position.
< Sigh > If only there were a way to count people who aren't looking for work, but want a job now. Oh, wait ...
- by New Deal democrat
It's tough to be a Doomer these days. Almost none of the data is cooperating. But at least one crutch they can always lean on is alternative unemployment measures that show a higher unemployment rate than the official 7%. It used to be that you could make a good case by citing the alternative U-6 rate that counts the underemployed. But even though that remains unconscionably high at 13.2%, it has been dropping in tandem with the official rate, and is down 3.9% from its peak in 2009 of 17.1%. It is now almost as low as the 11.8% rate in 1994 when the series was first published.
So the new methods work from pre-Great Recession employment to population ratios. One such method, favored by Mish and Naked Capitalism, is to assume that, except for the 2008-09 recession, the employment to population ratio would have remained constant at its level of about 10 years ago. This method boils down to, "What would the unemployment rate be in an alternative universe in which there were no Baby Boom, and Boomers weren't retiring in droves?" and has about as much credibility as that quote implies.
But there is a more sophisticated method that has been promoted by the Economic Policy Institute. They describe their method as designed to count "missing workers." They say:
In today’s labor market, the unemployment rate drastically understates the weakness of job opportunities. This is due to the existence of a large pool of “missing workers”—potential workers who, because of weak job opportunities, are neither employed nor actively seeking a job. In other words, these are people who would be either working or looking for work if job opportunities were significantly stronger. Because jobless workers are only counted as unemployed if they are actively seeking work, these “missing workers” are not reflected in the unemployment rate.(Bold is my emphasis. We'll come back to that later.)
That method extrapolates from a November 2007 study by the BLS, which projected a trend going forward at that time, and which estimated the impact of Boomer retirements on that trend. Since that established the secular baseline, so the theory goes, so any deviation from that trend must show the "real" unemployment rate due to the Great Recession. Using that methodology, the EPI estimates that there are 5,660,000 "missing workers" as of November 2013, and so the current "real" unemployment rate is 10.3%, as shown in this graph:
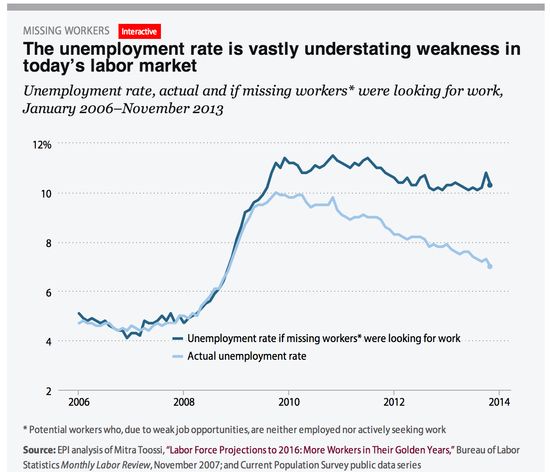
See? told ya! There's no real "recovery" after all!
In essence, what the EPI describes as "missing workers" are, as one advocate of their methodology has said, are people who "have no work and aren't looking but want a job."
Sort of like the data series from the Household Survey called, ummmmm, errrrrr, "Not in Labor Force, Want a Job Now"!
Yes, ladies and gentlemen, there is a seasonably adjusted data series, updated by the Household Survey and included in the Jobs report every single month, which measures exactly what the EPI says it is trying to estimate in that phrase I bolded from their explanation: the number of people who haven't looked for a job in the reference period, but want a job now. And here it is:
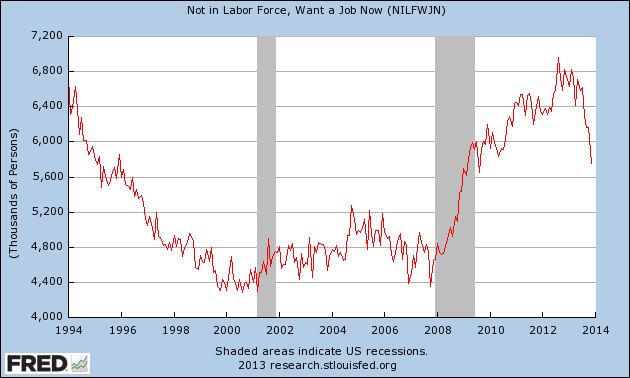
As you can see, that number increased by 50% from trough to peak. And currently the number of such people is 5,740,000, which is very close to the EPI's estimate.
But what does that mean for the unemployment rate, if this group were included? Since the unemployment rate is the number of unemployed divided by the civilian labor force of which they are a part, to include those who want a job but haven't looked, we have to add them to both numbers, I.e., the numerator and the denominator. When we do that, here's what the number looks like since the start of the recession:
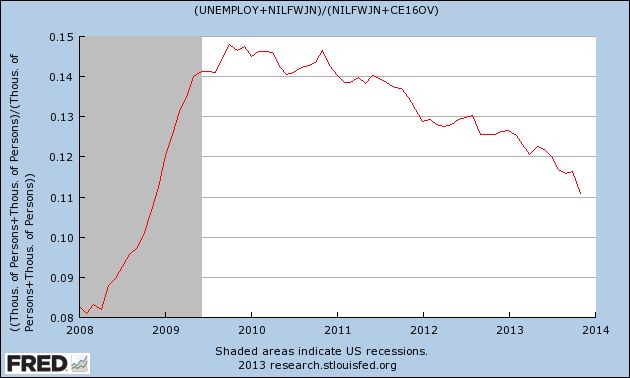
Well, lookie there, just over 10%, just like the EPI's number. See, it's really not a "recovery," right?
Wrong.
For starters, we didn't go from 0 "missing workers" in 2007 to 5.5 million now. According to the actual data, at its trough in 2007, the series measured 4,390,000 people. At its height in August 2012, it measured 6,956,000, before falling almost half the way back to its pre-recession low as of now. And at 5, 740,000 this is almost identical to the number in February 1995, not notably an awful period for the economy - and that's before adjusting for population growth since.
But the bigger problem for Doomers is that the data series "Not in Labor Force, Want a Job Now" goes back to 1994. So here's what happens to the unemployment rate when we include this group over the entire 20 year period:
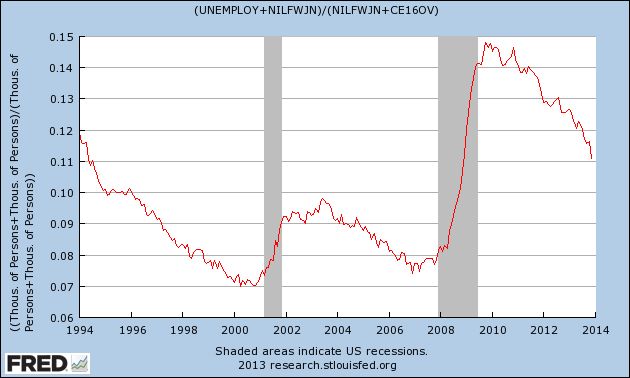
The lowest rate ever is 7%, and the unemployment rate is as low now as it was in 1994. And since the end of the Great Recession, it has dropped from just under 15% to just over 11.%.
So, while I would count the EPI as among the "good guys," I'm at a loss for why we should be counting anybody who says they don't want a job now as among the unemployed. Unless and until the EPI gives me a reason to think otherwise, between the EPI's estimate based on a study from 6 years ago, and the Household Survey's actual number, updated monthly, of people want a job now but haven't looked, as far as I am concerned the Household Survey is far more accurate.
Finally, look what happens when we extrapolate by adjusting the official rate to fit the trend including this group, and extend the series all the way back for 50 years:
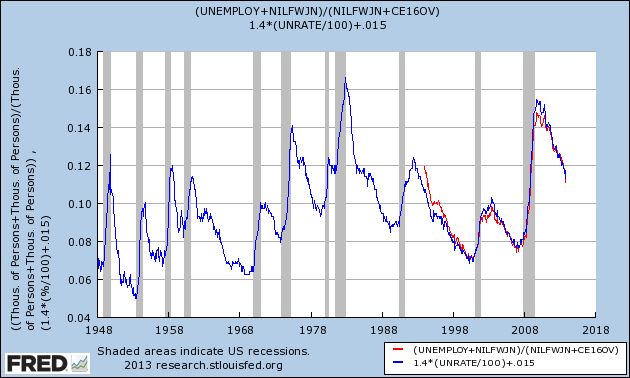
It looks like the current number is on par with the recoveries from the severe 1974 and 1981 recessions.
Oh.
Like I said, it's tough being a Doomer these days. The data just isn't cooperating.
Monday, December 9, 2013
Longer Term US Charts Still Bullish
Above are the weekly charts for the respective ETFS of the Russell 2000 (IWM), Nasdaq (QQQ) and S&P 500 (SPY). All show strong uptrends with rising momentum and EMAs and strong volume flow. All three support the idea the market will continue moving higher with shorter term periods of consolidation.
Sunday, December 8, 2013
A thought for Sunday: Why stagnant wages and trends in interest rates make me a longer-term Doomer
- by New Deal democrat
A commenter to a post I wrote this past week asked if there were anything I am "Doomerish" about. As it happens, yes there are several such things. I guess that makes me a "closet Doomer."
By nature, I am pessimistic. I am always expecting Pandora's box to be opened and for all kinds of horrors to come flying out. But I am also a math nerd, and that means I view Pandora's box like a safe with a combination. Doom can't come flying out until all of the tumblers have fallen into place. Until the proper combination has been found, and the safe unlocked, Doom is at bay. In fact, my first post ever at Daily Kos, in October 2005, was entitled "Not Doomed Yet".
Let me explain in detail the source of my longer-term pessimism, by referencing two posts I wrote in 2007 and 2008.
By 2007, all of the tumblers appeared to have triggered, and in August 2007 I wrote what I still think is one of my best posts ever, "Are Hard Times near? The Great Decline in interest rates is ending". My overall view of the economy now is really the same as it was then. The "Great Moderation" so beloved of Alan Greenspan was actually a chimera of declining interest rates. Here's what I said then:
... [T]he "Big Picture" from 1981 - present is that [t]he American consumer has had largely stagnant wages since 1974. While from 1980 through 2006, the median income of an American household has risen only from $39,700 to $48,200 in real terms, house prices for example have shot up form nearly $125,000 to $246,500. Consumers have responded generally by taking on more and more debt. Total household debt service has risen from 16% in 1980 to 19.4% in 2006.
Fortunately for consumers, there has been a generation-long decline in interest rates since they peaked at 15.21% for the 30 year US Treasury bond in October 1981. This has allowed consumers to refinance their debts at ever lower rates every few years. They have also been assisted by a bull market in stocks that took the S & P 500 from 102 in 1982 to 1553 in 2000, and the subsequent housing boom/bubble.
There are signs that this "Great Disinflation" of declining interest rates is coming to an end. Only twice in the last 27 years has the consumer been unable to refinance debt or tap into his or her stock or house ATM. ... [T]he 3rd and final time is almost certainly near.
.... [Given wage stagnation], the only way American consumers have been able to significantly improve their lifestyles is either to take on debt, using assets which have appreciated in value as collateral [stocks from 1982-2000 and housing thereafter], or to refinance their debt at lower interest rates. If consumers are unable to tap the value of assets, or to refinance, then without improvements in wages, they will pull back and cause a consumer-led recession....
.... The Longer-Term: are Hard Times coming? Interest rates are no longer declining
Beyond the possibility of a recession in the very near term, a first-order danger signal for the long term future is that long term interest rates seem unlikely to move lower than 4% anytime soon.... These problems suggest that the 27 year decline in interest rates is ending. From here we may well see fluctuating interest rates that begin to rise in sustained fashion again at some point in the next 3-8 years. A rising interest rate environment would be deadly for consumers and for other debtors like the US Treasury.
If long term interest rates do decline again, consumers may yet have one more chance to refinance their spending for the next few years. But any increase in interest rate yields for 30 year US Treasury bonds above 5.5% would likely mean that the Great Disinflation of interest rates is over, and Hard Times -- when individual and Sovereign debtors alike must "pay the piper" -- are upon usWhile the thesis obviously wasn't perfect, Hard Times did come to pass just as expected, as overextended consumers (and banks!) had to pay down debt. In January 2008, which we now know was only one month into the "Great Recession," I wrote "The Slow Motion Bust unfolds in earnest," saying:
Whoever inherits the White House on January 20, 2009 is likely to confront serious and urgent economic conditions unlike any we have seen in our lifetimes. For the mortgage crisis is only part of a bigger insolvency crisis that has already taken longer to unfold than most economic downturns in our history.Below the fold I'll describe past "panics" or economic busts from the 19th century, to show you how quickly they unfolded....Consider this, not a set of predictions for 2008, but rather a look at the Big Economic Issue that will dominate this year and the entire next Presidency.
.... By a "slow motion bust", I mean to suggest that the current situation is like the 19th-early 20th century "panics" described above, except that instead of unfolding quickly, the situation is unfolding at a snail's pace. Like an ageing behemoth of a warrior, the economy may need to sustain 1000 blows before it goes down, but that onslaught of blows is ever so gradually accumulating.As it turned out, the bankruptcy of Lehman Brothers was the blow that slay the beast, and also there was one more chance to refinance, as Ben Bernanke and the Fed engaged in Quantitative Easing, and long term interest rates sank as low as 1.52% in July 2012.
So what am I Doomerish about?
Now at the end of 2013, we still have the same long term problem that I wrote about in 2007. Over the long term, wages are still stagnant, and below their 2010 peak. Interest rates are more than 1% above where they were 17 months ago. HELOCs are a thing of the past. We have just had a new peak in stock market prices, however, and the "wealth effect" should lead to some increased spending by the top 10%-20% of households.
I have long thought that the secular Bear which began in 2000 was not going to end until about 2020, and that there would probably be 3 stair-steps down. The first 2 have already happened, but if there is a 3rd, at the end the situation will probably be worse than it was in late 2009. With nominal wages only increasing by 1.8% a year for the last 4 years, even 2% inflation causes households to lose ground. This can't go on indefinitely. Either real wages must meaningfully improve, or that 3rd recession is going to happen sometime soon (but not now, and almost certainly not in the next 9 months). It may well start from a position of incomplete recovery from the 2008-09 recession, and if so that next recession is likely to feature actual wage deflation.
With the oxygen of refinancing shut off in the era of sideways and then rising interest rates, a era which I believe began in July of 2012 and will last at least a generation, economic expansion can only take place once real wages start to rise again and/or sustained asset price inflation persists.
Doomerish enough for you?


