Friday, July 30, 2010

Weekend Weimar and Beagle


It's that time of the week. Don't think about the market or the economy until Monday. Until then ....


Weekly Indicators: Besides the GDP report edition

- by New Deal democrat

This was the week we found out that the Great Recession was even "greater" than we thought, and that we went an entire year with an improving GDP making up about 3/4 of the loss. Can we ask the NBER "Are we there yet?"

In addition to the GDP report, monthly reports focused on home sales and, as I pointed out yesterday, show sales (NOT prices) searching for and possibly finding a bottom. Durable goods unexpectedly fell in June, although why it was unexpected given the poor housing and auto numbers is beyond me. Maybe Boeing or the Pentagon didn't give out lollipops?

Turning to our weekly numbers, the Mortgage Bankers' purchase mortgage index rose ever so slightly out of the sub-sub-basement for the second week in a row. Bottoming is better than cliff-diving, and let's hope that's what we've got.

The ICSC reported same store sales for the week ending July 23 rose 3.8% vs. a year earlier, and also rose 0.6% from the week before. For the month of July, same store sales have averaged +3.8% YoY. This is a very good showing. Shoppertrak also reported that sales rose 3.9% for the week ending July 24, and that sales were also up 1.4% from the week before. Taken together, the sales reports for July suggest that retail sales might be picking up again.

Gas prices rose 3 dents to $2.75 a gallon. At a rate of 9.632 million barrels a day, last week showed the highest usage in 3 years. This, along with retail sales, has to be counted as a good sign.

The BLS reported 457,000 new jobless claims this week. This was down a little from last week. This data series continues to be particularly noisy and distorted now, with both the auto plant non-closures and filings by laid off census workers figuring into the mix.

Railfax continued to sound the alarm. Cyclical traffic is declining rapidly to last year's number, and baseline traffic is already there. Only intermodal traffic, signalling imports and exports, is showing a very slight improvement. Motor vehilce loads are cliff-diving, and waste and scrap materials aren't just declining, they are worse than a year ago. Rail traffic argues that the slowdown or double-dip isn't in the future, it is occurring right now.

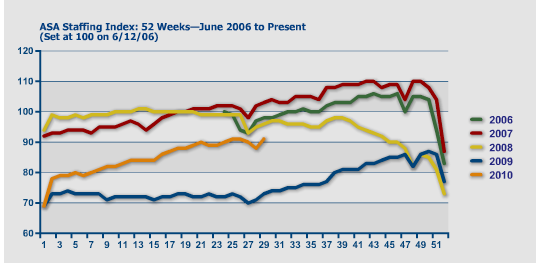
The American Staffing Association reported that for the week of July 12–18, 2010, temporary employment increased 3.04%, meaning its index rose to 91." The ASA publishes a 5 year historical graph that is particularly telling:


Temporary hiring has increased dramatically in the last year, rising almost to the level of mid-2008 before the crisis occurred. This is a far more substantial move than employment gains in general, and suggests that employers aren't ready to commit to full time employees yet, and may not be for awhile.

M1 was steady this week, which means it remains up 3% on a YoY basis for the month of July so far, is up 3% (meaning “real M1” is up about 2%). M2 is up 0.1% this week, or about 1.9% YoY for July so far (meaning “real M2” is up about 0.8%). Generally the YoY trend in M1 is declining from a very high rate, but the real YoY M2 trend has bottomed and is slowly increasing. To be "out of the woods" in terms of a double dip I would want to see continued positive real M1 and real M2 up more than 2.5%.

I'm going to start to track weekly commercial paper rates, since in deflation these spreads may be better indicators (albeit more coincident than leading) than the yield curve. Weekly BAA commercial paper rates declined slightly to 5.95%. BAA paper rates have generally been declining for the last month or so after spiking during spring. It will be interesting to see how this affects the ECRI weekly number which has gotten so much press recently.

Finally, there continues to be good news in the Daily Treasury Statement. Nineteen reporting days into July, with only two days left, $122.6 B has been collected vs.$115.4 B last year, a gain of over 7%. For the last 20 reporting days, we are also up almost 9%, $130.6 B vs. $120.1 B. (BTW, don't be taken aback if the raw July vs. July comparison doesn't look this good, as there was one more reporting day last year vs. this year). This series has been kicking butt on a YoY basis for the last eight weeks, even with about 400,000 census layoffs having taken place during that time. Something is going on here, because this kind of growth was consistent with +200,000 to +300,000 jobs added a month during the middle of the last economic expansion.


This week the more coincident indicators - rail traffic vs. employment - split strongly. For a change, though, the leading indicators favored the economic bulls.

2Q GDP Gross Private Domestic Investment


Let's continue looking at GDP by looking in more detail at the investment component.


Total gross private domestic investment has been increasing at a strong pace for the past three quarters.

Investment is non-residential structures increased a bit last quarter


And businesses moved a ton of money into equipment and software investment. This category of investment continues to increase at a strong pace.


Residential investment kicked up last quarter as well.

2QGDP Personal Consumption Expenditures


Let's take a close look at the PCE component of the GDP report.


Total PCEs are increasing at a moderate pace. While they are not setting records, they are certainly holding their own.

Services make up the largest percentage of PCE expenditures, comprising about 65% of PCEs. They have expanded for the last three quarters at an uneven pace.

Non-durable purchases also increased last quarter, but at the slowest pace in the last four quarters.


Durable Goods purchases also increased last month at a decent pace.

How Is This Recovery Stacking Up?

One of this sites trolls -- Bob Swern -- noted the last two quarters have shown a decrease in growth. So, let's see how this recovery's first four quarters stack up against the previous two recoveries first four quarters in terms of GDP growth.

Here is a chart comparing them:


The purple lines represent the first four quarters after the 1991 recession. Notice how they started out slowly for the first three quarters but jumped higher ain the fourth quarter after the recession. In comparison, notice the blue lines that represent the post 2001 quarter to quarter GDP growth which continually declined for three quarters after the recession ended. This recovery has printed strong numbers for the second and third quarters coming out of the recession and still printed a 2.4% in the fourth. By way of comparing the last three recession, here is a chart of the median rate of growth of the last three recoveries in he four quarters after the recession ended.


Note this recovery is printing a far stronger median growth rate than the other two recoveries four quarters in.

2Q GDP Up 2.4%

From the BEA:

The increase in real GDP in the second quarter primarily reflected positive contributions from nonresidential fixed investment, exports, personal consumption expenditures, private inventory investment, federal government spending, and residential fixed investment. Imports, which are a subtraction in the calculation of GDP, increased.

The deceleration in real GDP in the second quarter primarily reflected an acceleration in import and a deceleration in private inventory investment that were partly offset by an upturn in residential fixed investment, an acceleration in nonresidential fixed investment, an upturn in state and local government spending, and an acceleration in federal government spending.


Here's a chart of the last four quarters of GDP:


Notice this is the fourth quarter where the US economy has had positive quarter to quarter growth.


Above is a chart of the percent contributions to the percentage change in GDP. Notice the growth is spread out across different categories -- PCEs, investment and exports all contributed.

We'll be looking at this report in more detail throughout the day, but suffice it to say, this is a decent report.

Yesterday's Market


Prices on the long-end of the curve are still below their long-term trend line (a). Notice that preceding that move was a decrease in momentum (b), a drop in the A/D line (c) and the CMF turning negative (d).


The 7-10 year part of the curve has the same technical alignment with its indicators. Prices are handing on by a thread.

The reason a drop in the Treasury market is important is it will free up money to flow into riskier assets, hopefully providing a boost to the stock markets.


Yesterday was quite a wild ride. Prices gapped higher at the open (a), but then moved lower. They formed a bear market pennant pattern that ran into resistance at the EMAs. Prices then moved lower and formed a double bottom in the late AM (c). Prices then moved higher, rising through the EMAs before forming a bull market pennant pattern (d). Prices then rose agin, but fell into the close on rising volume (e).


Yesterday I noted that ideally, prices should test the 200 day EMA after their run-up. That is happening. Now the question is whether or not this level holds.


Oil continues to hit resistance at the $80/bbl area. Also note the EMAs are in a very tight configuration (b), signaling confusion on the part of traders.


The rally in wheat -- caused by a drought/high heat situation in Russia -- continues. The uptrend is firmly in place (a). Prices have taken the time to consolidate some gains along the way (b). Also note the EMAs are moving higher, the shorter EMAs are above the longer EMAs and prices are above all the EMAs (c).


Gold continues to move lower as inflation expectations diminish.

Thursday, July 29, 2010

Beige Book Part III -- Employment


From the Federal Reserve:

Labor market conditions improved gradually in several Districts. New York, Chicago, Minneapolis, Richmond, and Atlanta all reported that labor markets improved, albeit modestly in some cases, while Boston and Dallas reported that employment was steady. Philadelphia, Atlanta, Richmond, Chicago, and Minneapolis reported that temporary employment experienced increased demand. Contacts in the Philadelphia, Atlanta, Dallas, and San Francisco Districts said that they continued to rely on temporary staff over permanent hires. Cleveland, Richmond, and Chicago saw hiring in the manufacturing sector. Cleveland also reported some new job openings in the healthcare industry. Boston and Cleveland noted that firms in some services industries were hiring mostly for replacement. Dallas reported that firms in the energy industry experienced significant regional layoffs as a result of the deepwater drilling moratorium. San Francisco noted continued high levels of unemployment and limited hiring.


The 4-week average of unemployment claims (which does not include today's data) dropped starting mid-last year, but has moved sideways since the beginning of the year. This behavior occurred in the last two recessions.


Establishment job growth has bottomed, but is still weak.


The unemployment rate is still elevated (which also occurred after the end of the last two recessions. See the link above).

Beige Book -- Part II Consumer Spending

From the Beige Book:

Reports on retail sales during the early summer months were generally positive, although in most Districts the increases were modest. Retail sales in the New York, Philadelphia, Minneapolis, and Kansas City Districts were higher than year-earlier sales, and Dallas reported solid gains. But sales in the Boston District were mixed compared with the previous year. Recent sales increased slightly in the Cleveland, Atlanta, Chicago, and San Francisco Districts; sales in the Richmond District weakened; and sales in the Kansas City District were flat compared with the previous report. Several Districts cited apparel, food, and other necessities as recent strong sellers, while big-ticket items were weak sellers. Contacts reported satisfactory inventory levels in the New York District, mixed inventory levels in the Boston District, and low or declining inventory levels in the Richmond, Atlanta, and Chicago Districts. The outlook for sales was mixed: Retailers in the Philadelphia, Cleveland, Kansas City, and Dallas Districts reported that they expect modest positive sales growth in the upcoming months; contacts in the Cleveland, Atlanta, and Chicago Districts reported a less optimistic outlook going forward than in the previous report; and retailers in the Boston District reported a cautious outlook.

The Districts that reported on auto sales during the early summer months generally noted a decrease in recent sales. Since the previous report, auto sales in the New York, Philadelphia, Cleveland, Richmond, Chicago, and San Francisco Districts declined, while auto sales in the Kansas City District increased and were unchanged in the Dallas District. Compared with last year, auto sales in the Atlanta and St. Louis Districts were higher. New York, Philadelphia, Cleveland, Chicago, Kansas City, and Dallas all reported that inventory levels were low or declining. Auto dealers anticipate little change in sales for the rest of 2010 in the Philadelphia District and expect sales to increase slowly in the Dallas District. Contacts in the Kansas City District expect continued strong demand, while those in the Cleveland District do not anticipate strong growth in the coming months.


Let's look at the data:


Real retail and food service sales are in an uptrend, although they have moved lower for several months.


Real personal consumption expenditures are increasing and are now higher than their peak in late 2007/early 2008.


Service expenditures comprise the largest percentage of PCEs. These moved sideways during the recession, but are now moving higher at a subdued pace.


Real expenditures on non-durable goods are increasing and are just below their peaks in late 2007.


Durable goods purchases are also increasing, although they are below their peaks of late 2007.


Auto and light truck sales are moving slightly higher, but are still at incredibly low levels.

Beige Book, Part 1 Manufacturing and Services


Yesterday and tomorrow we get a great deal of information about the US economy. Yesterday the Federal Reserve published the Beige Book and tomorrow we get the first GDP estimate for the 2nd quarter. This is therefore a good a opportunity to take a look at a wide swath of macro-level data to see exactly where we are.

Here is the report's summary:

Economic activity has continued to increase, on balance, since the previous survey, although the Cleveland and Kansas City Districts reported that the level of economic activity generally held steady. Among those Districts reporting improvements in economic activity, a number of them noted that the increases were modest, and two Districts, Atlanta and Chicago, said that the pace of economic activity had slowed recently.

Manufacturing activity continued to expand in most Districts, although several Districts reported that activity had slowed or leveled off during the reporting period. Districts also noted improved conditions in the services sector. The five Districts reporting on transportation noted increased activity. Tourism activity also increased across the Districts, although the Atlanta District noted concerns about decreased leisure travel to the Gulf Coast. Retail sales reports generally indicated a continued rise in spending, and several Districts noted that necessities continued to be strong sellers, while big-ticket items moved more slowly. However, most Districts that reported on auto sales noted declines in recent weeks. Activity in residential real estate markets was sluggish in most Districts after the expiration of the April 30 deadline for the homebuyer tax credit. Commercial real estate markets, especially construction, remained weak. Banking conditions varied across the Districts, with some Districts noting soft or decreased overall loan demand; credit standards remained tight in most reporting Districts. Recent rains had mixed effects on crop conditions, while activity in the natural resources sector increased. Overall labor market conditions improved modestly across the Districts, with several reports of temporary hiring. Consumer prices of goods and services held steady in most reporting Districts. Input prices also held largely steady, with only a few reports of cost increases. Wage pressures continued to be contained on the whole.

So, the general trend is for an increased, albeit at a slower pace than before. While there is growth, it is "modest" and several districts reports a slowing trend.

Let's take the report section by section and then add some information as appropriate.

Manufacturing activity in most Districts continued to move up since the last report, although the pace of activity slowed or activity leveled off in the New York, Cleveland, Kansas City, Chicago, Atlanta, and Richmond Districts. Automobile manufacturing was a bright spot for the Cleveland, Chicago, and St. Louis Districts. Automobile parts suppliers also experienced increased demand in both the Richmond and Chicago Districts. Fuel demand at refineries in the San Francisco District improved, while gasoline demand was steady in the Dallas District. Firms in the semiconductor manufacturing industry reported relatively strong sales or demand growth in both the Boston and San Francisco Districts. Firms in aircraft and parts manufacturing saw sales pick up in both the San Francisco and Dallas Districts. Manufacturing firms in the Boston, Philadelphia, Kansas City, and Dallas Districts were optimistic that demand would continue to improve in the following months. However, Cleveland's contacts expect demand growth to taper off, Philadelphia noted that the balance of positive over negative views had narrowed, and Atlanta reported fewer firms planning expansions in production. Richmond, Chicago, and Dallas reported that firms in construction-related manufacturing experienced weak demand; construction supplies sales were flat in Kansas City, and Minneapolis reported that a firm in the sector was increasing production. Steel production declined in both the Chicago and Cleveland Districts. Some manufacturers in the Atlanta and San Francisco Districts reported high excess production capacity. Capacity utilization was below pre-recession levels in Cleveland and edged lower among steel producers in Chicago.

Manufacturing was one of the first areas of the economy to turn around. However, we are now seeing a slowdown in some areas. Let's take a look at some of the data:


While the ISM index is still increasing, it has moved lower over the last few months. However, the reading is still above 50, indicating an expansion of the manufacturing sector.


The NY Empire state index dropped last month, but it is also still in an area of expansion.


The Philadelphia Fed's manufacturing survey also dropped last month, but is also still positive.


The Richmond Fed's manufacturing index also dropped last month (it's obscured by the 3-month line). However, like the other regional indexes, it is also still positive.


The Texas index is also just above 0, but still positive.


Overall industrial production and capacity utilization are still increasing. However, the IP number last month was weak and the capacity utilization moved sideways. But -- this is one month of data, not the general trend.

So, the latest data point of a slowdown in manufacturing. The regional indicators all moved lower. But this is one month of data and the indicators are still positive.

Services

Unfortunately, there aren't as many service indicators as manufacturing. Here is a chart of the ISM non-manufacturing index:


Last month it dropped after three months are more or less the same level. It could be topping out, but we don't know if it will stay at this level or move lower.


Has Housing Bottomed?

- by New Deal democrat

No, not in prices, that is probably still several years and more than 10% away. But have new home sales and starts bottomed? It looks like we are groping for a bottom now, and it is at least possible that it may have already occurred several weeks ago.

The cliff-diving in new home purchases and mortgage applications is a critical reason for the sudden slowdown in the economic numbers since late April. The Euro crisis, the Gulf catastrophe, the price of Oil and real income stagnation also have played important roles. As Bonddad pointed out yesterday, it appears that the Euro crisis has eased, taking that off the table for now. The Oil well at the bottom of the Gulf of Mexico has been capped, and we can cross our fingers that that crisis has reached its maximum. Oil prices have eased somewhat as well, and with the decline in inflation, there may be a little breathing room on the income front for now.

Readers know that I have been tracking purchase mortgage applications weekly, looking for signs of a bottom. This week, for the first time since April 30, applications for purchase mortgages rose for the second week in a row (all graphs from Mortgage News Daily):


Saying that Purchase Apps Search for Bottom, they quote the Mortgage Bankers Association release, noting
The seasonally adjusted Purchase Index increased 2.0 percent from one week earlier and is the highest Purchase Index observed in the survey since the end of June. The unadjusted Purchase Index increased 2.4 percent compared with the previous week and was 34.3 percent lower than the same week one year ago. The four week moving average is flat for the seasonally adjusted Purchase Index.
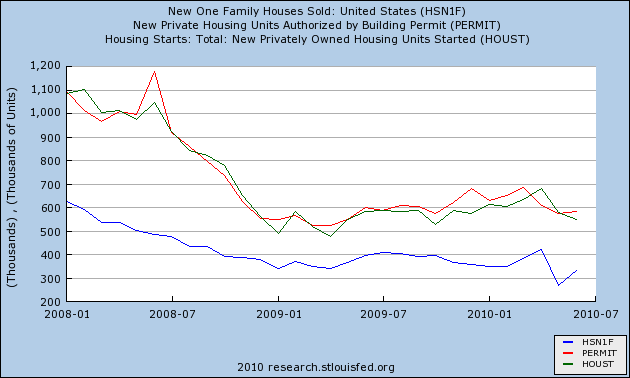
It isn't just purchase mortgage applications. The Census Bureau reported on Monday that sales of single family homes rebounded strongly in June from an abysmal May (blue), and Permits also rose slightly from their May reading as well (red). Only starts, which frequently lag behind permits by one month, continued to decline in June (green):
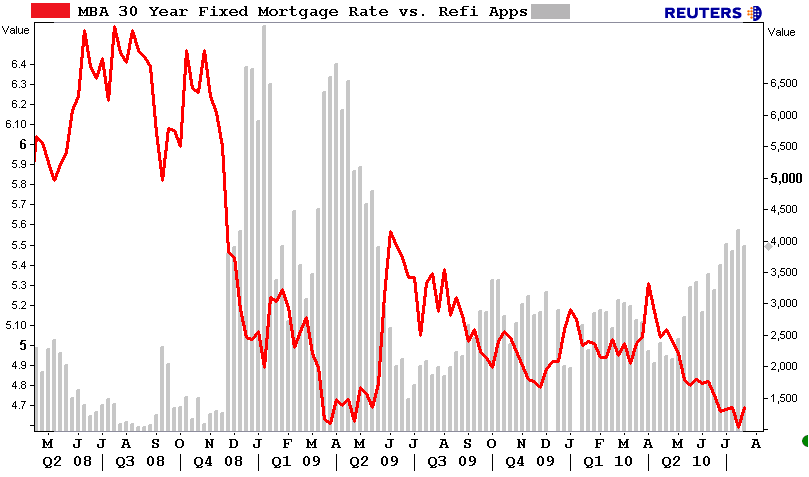

Refinancing mortgage applications also continue at an elevated rate, aided by low interest rates:


From early 2006 through the end of 2008, housing sales, permits, and starts plummeted by some 75%. By early 2009 I was writing that they probably would bottom at some point last year, because at that rate of decline, they would be a zero this spring!

A look at trends in asking prices and inventory in 50 metro areas from Housing Tracker gives us a closer look at what has happened. In many areas that were the epicenter of the bubble last decade, prices have fallen substantially since the expiration of the housing credit. For example, in Phoenix, AZ, the median asking price has declined from $169,700 in April to $152,800 in mid-July (that's over 10% in 3 months!). Here is what happened to the number of houses on the market:


An entirely different dynamic is playing out in a few other places, most notably California, where the increase in sales due to the housing credit apparently convinced people that housing prices had firmed again. Compare Phoenix, above, with San Diego, California, where asking prices from April to mid-July actually increased from $387,000 to $399,000!


The inventory of unsold houses has rapidly increased in the last 4 months to a level higher than at any point in the last two years!

It is obvious that the $8000 tax credit pulled sales forward, preventing a full bottom from taking place in 2009. In order to make up for that difference, prices need to fall $8000. Sales in those places where they have are not badly impacted. Those places where they haven't, like California, have seen another dramatic slowdown. Once those prices decline again, demand for existing housing will slowly rise, and the backlog of houses on the market will slowly be worked off (it will take several years). In any event, the post-credit-withdrawal new housing sales market appears to be in the process of bottoming.

That doesn't mean we can have a happy dance. But if this is the bottom, any double-dip in the economy caused by housing (remember: housing always leads) will be shallow. If there is an actual rebound in the next few months, there won't be a double-dip at all, just a slowdown.

And I have to note one final piece of evidence: on July 14, possibly at the very nadir of the purchase mortgage index, that perennial accidental contrarian indicator, Mish, said to Expect Second Half Housing and Durable Goods Crash, highlighting that week's report that "[t]his was the lowest Purchase Index observed in the survey since December 1996."

Perfect.


Yesterday's Market


The long-end of the Treasury curve continues to sell off.


However, the middle part is still fluctuating around the longer-term trend line.


Yesterday, notice that prices moved in a solid down, up, down pattern.


Notice two things on the daily chart. First, prices are gravitating around the 200 day EMA (a). Secondly, ideally, prices will move lower and test the 200 day EMA before moving higher (b).


The dollar continues to move lower. Notice the severity of the sell-off -- this is a very strong downward move.