This is actually NDD's work. I had problems with the editing/compilation so I just cut and pasted. BonddadThe bleeding of jobs during the Great Recession continued, albeit just barely in January, as the economy subtracted - 20,000 jobs.
:The relatively good news is that the unemployment rate declined from 10% to 9.7%.
This month also saw revisions to the period from March 2008-2009 due to more accurate employer data being available, and some revisions to the months thereafter based on that template. The BLS has been widely criticized for its "birth/death" model which was adding hundreds of thousands of hypothetical jobs despite a tsunami of real layoffs, specifically quantified the 800,000 jobs losses it believed it missed a year ago, and also incorporated those changes into the last 9 months revisions. Here is the revised graph of payrolls for the last ---- months.
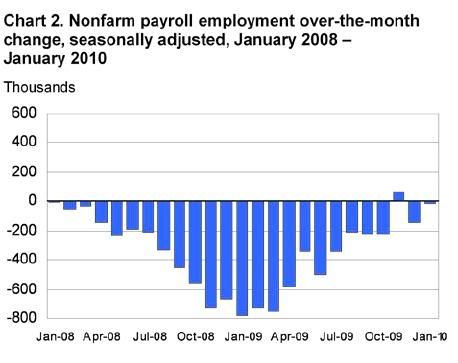
All in all, this was a vexing report, as the headline number remained negative, but virtually all of the internals improved. Details below.
As the financial blog
Action Forex pointed out yesterday, "the range of probable outcomes is much larger in this [January] release than the other eleven releases of each year" in part because of the massive layoffs - nearly 3 million - which occur even in a typical January, as shown in this graph:
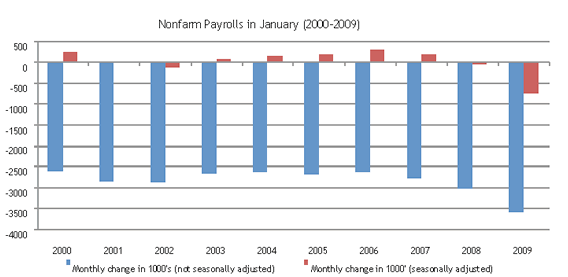
so today more resembles a best guess than the typical monthly data. As that blog said, here's what this morning's data boils down to:
- the level of employment will be shifted down by an estimated 824,000 for the period April 2008 to March 2009, but;
- revisions to months after March 2009 will also take place as the BLS tries to incorporate the new knowledge gained from the revision;
- the birth/death model will be revised, which impacts future releases;
- the Census Bureau hired (potentially large numbers of) temporary workers in January, which will inflate payrolls;
- seasonal factors will be revised, and the ramifications can be large in each direction;
- the revision only covers payrolls (from the Establishment Survey) and therefore does not affect the unemployment rate, which is derived from the Household Survey. Speaking of the unemployment rate we expect a slight increase to 10.1% from 10%.
The net result, after all of the new adjustments, was a gain/loss of - 20,000 jobs. November remained the first postive month for job growth, as it was revised up to +64,000 jobs. December, however, was revised down further to -150,000. (This is only the second negative revision in 10 months).
[Note: the graphs below do not include this morning's data, but are current through last month. I will substitute the January graphs as soon as they become available]In January, the federal government added 33,000 jobs, including 9,000 tempo-
rary positions for Census 2010. Employment in state and local governments,
excluding education, continued to trend down.
I. After gaining jobs for two of the last three months, services (where 85% of Americans work) gained another +48,000 jobs.
Temporary jobs - typically added while employers wait to see if the economic improvement is more sustainable - went up for the 6th month in a row, by + 52,000. This is another excellent internal. Since September, +247,000 new temporary jobs have been added to the economy. Job gains were also reported in professional positions, including both health and education. Retail showed a substantial gain of +42,000.
Probably the most welcome internal number was that Manufacturing finally gained +11,000 jobs. Construction, in the epicenter of the economic downturn, continued to shed jobs at (- 75,000), mirroring the ongoing collapse of commercial real estate. The BLS report continues to track reasonably close to the private ADP survey, which reported a -22,000 loss in January, and out of line with the private ISM non-manufactuing survey, but finally did validate the gains showed in the ISM manufacturing employment index.
This is generally a continuation of the trend that began three months ago, when services jobs (red in the graph below) first showed growth in the payrolls report, but goods producing jobs (manufacturing + construction) (blue in the graph below)were still negative (a pattern seen at the end of past recessions).

With this morning's revisions, +88,000 services jobs have been added in the last 3 months.
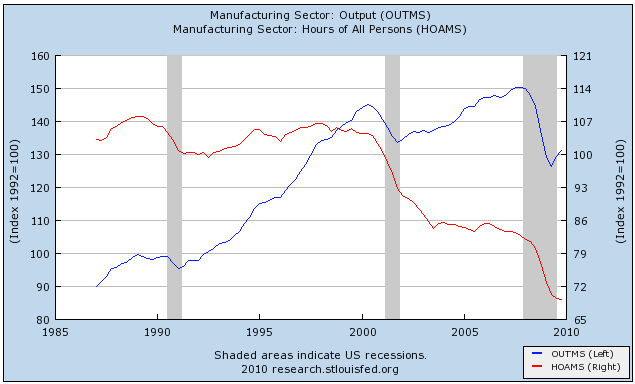
While workers have seen no real relief up until now in the jobs picture, manufacturing has indeed been having a classic, V-shaped recovery, as shown in this graph of ISM manufacturing, output, and blah blah:
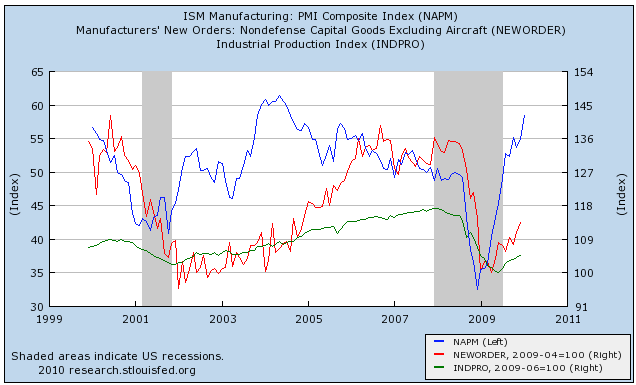
Yesterday we learned that manufacturers continue to make more and more product with fewer and fewer workers, but the decline in manufacturing hours worked slowed to a point that after the last two recessions suggested stabilization in the jobs market
As many of you already know, in fact there are two surveys -- the "establishment" survey which polls businesses, and received much criticism for its "birth/death" adjustment, which is corrected at least in part with today's revisions; and the "household" survey, conducted by the Census Bureau, which polls households, and does not have any such adjustment. The two do not measure the exact same thing (e.g., self-employment is not counted by the BLS), but track each other closely over time. Typically the household survey turns simultaneously with or one or two months ahead of the establishment survey.
The household survey (blue in the graph below vs. red for the establishment survey) turned positive two months ago, added + 541,000 jobs this month
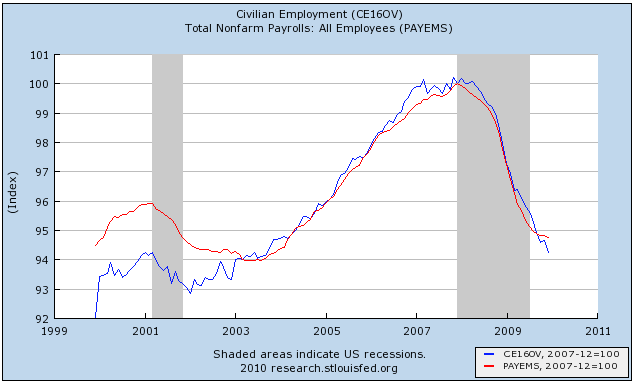
This means the household survey may have turned.
II. The revisions to past dataAs we already knew, a lot of phantom jobs that the BLS was reporting due to its "birth/death" adjustment were going to disappear. Well, even more disappeared than we thought, 1.2 million vs. 840,000. Here is a revised chart of 2009 payrolls based on these revisions:
January........| 134,333 | 133,549 | -741 | -779 | -38
February.......| 133,652 | 132,823 | -681 | -726 | -45
March..........| 133,000 | 132,070 | -652 | -753 | -101
April..........| 132,481 | 131,488 | -519 | -582 | -63
May............| 132,178 | 131,141 | -303 | -347 | -44
June...........| 131,715 | 130,637 | -463 | -504 | -41
July...........| 131,411 | 130,293 | -304 | -344 | -40
August.........| 131,257 | 130,082 | -154 | -211 | -57
September......| 131,118 | 129,857 | -139 | -225 | -86
October........| 130,991 | 129,633 | -127 | -224 | -97
November.......| 130,995 | 129,697 | 4 | 64 | 60
December (p)...| 130,910 | 129,547 | -85 | -150 | -65
So, last year was considerably worse than originally reported. On the other hand, the net gains and losses in November and December evened out and the three month average for Nov. thru Jan. is - 65,000. This still suggests that job gains are close at hand and if anything, shows how dramatically the awful data from a year ago has ebbed.
II. The second big number reported this morning is the unemployment rate, which declined from 10.0% to 9.7%.
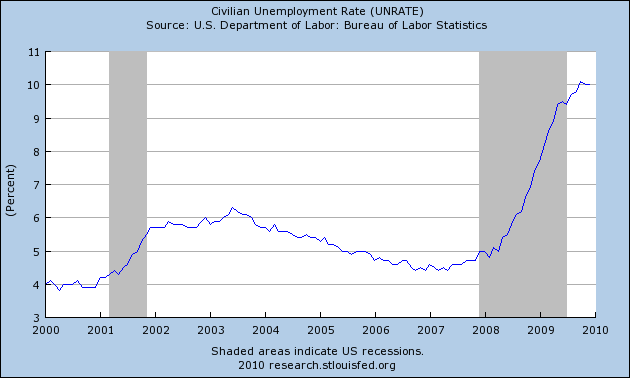
The alternative U6 number also declined significantly from 17.3% to 16.5%. This is in large part a reflection of the fact that discouraged workers continue to leave the economy. The labor participation rate rose for the first time in months, from 64.6% to 64.7%. Keep in mind that the unemployment rate is the last thing to turn positive in an economic recovery.
III. While the above are the headline numbers, there are other aspects of the report that are also very noteworthy. The aggregate number of hours worked in the economy bottomed in Ocotber, and improved +0.2% in January.
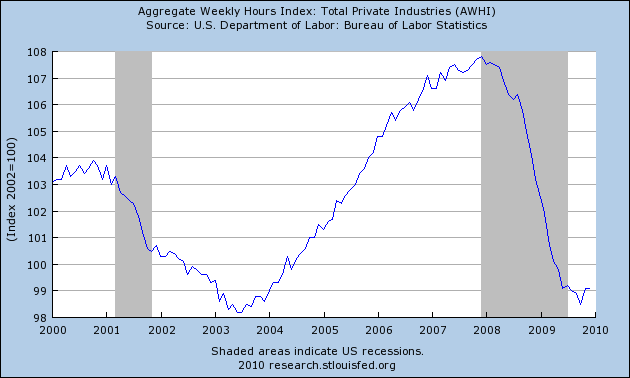
This means that in addition to hiring, hours of work are also increasing. It is also a measure relied on in part by the NBER to date the end of Recessions.
Another noteworthy item is the average number of hours worked in manufacturing. This is one of the 10 Leading Economic Indicators I refer to. It turned up back in the summer, and is an item I said to watch in terms of the possibility of a V-shaped recovery. It has risen substantially since then, ********from 40.4 hours in December to ************hours in January.:

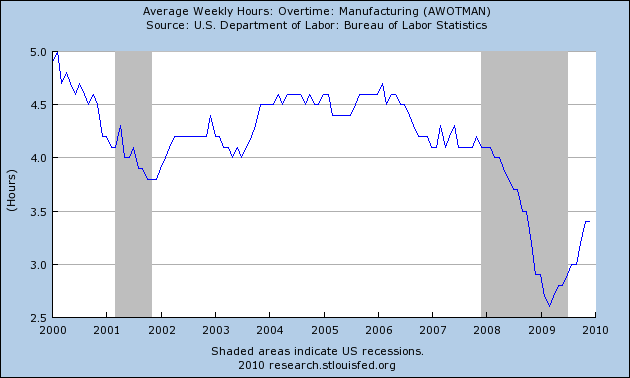
One more statistic thought to lead employment is hours worked in overtime, as typically employers will add to overtime in their workers before they hire new ones. This ******* went from 3.4 in November and December to ******hours in January:
The overall average workweek, which includes services and other jobs as well, increased from 33.2 hours to 33.3 hours.:

Hourly earnings also increased 0.3%:

While employment gains have been a long time in coming, the other 3 "coincident indicators" typically used to determine the end of recessions - industrial production (green), real retail sales (red), and real income (blue) have all turned up -- the last two a little, the first one in a more V-shaped manner:
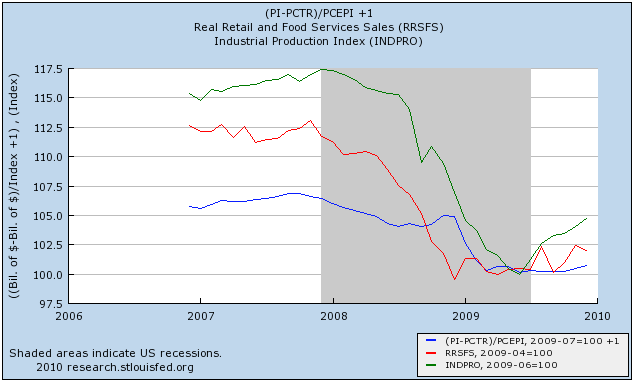
With employers still "hoarding" jobs, it is likely the NBER will continue to hold off making their call as to the end of the recession, although all of the numbers are certainly turning to the better. They will probably wait to see if the employment continues to improve.
Back in September, I said that} "Based on my analysis above, November or December are when I believe that turning point will be reached, plus or minus one month in either direction. Let me be the first to acknowledge that this is not a scientific truth or certainty, but a best estimate based on a logical review of existing data with a long history that accommodates both traditional and "jobless" recoveries. Nevertheless, at least in terms of payroll growth, the analysis in these six installments cause me to predict that this will not be a "jobless recovery" for long.
That didn't happen, although we are within a whisker of so doing.


