-
by New Deal democratThis is the Sixth of Seven articles in which I am examining when economic growth (GDP) will translate into job growth (the 7th will deal with the unemployment rate). In the first 4 articles I examined 5 potential leading indicators of job growth. In the 5th article, I showed how the leading indicators fit together temporally. What remained is the issue of whether there was enough "ooomph", enough strength, to push job growth over the top. Certainly I can say that historically when an indicator has reached level X, that has always occurred at the same time as actual job growth, but then it is no longer a leading indicator, just a contemporaneous report.
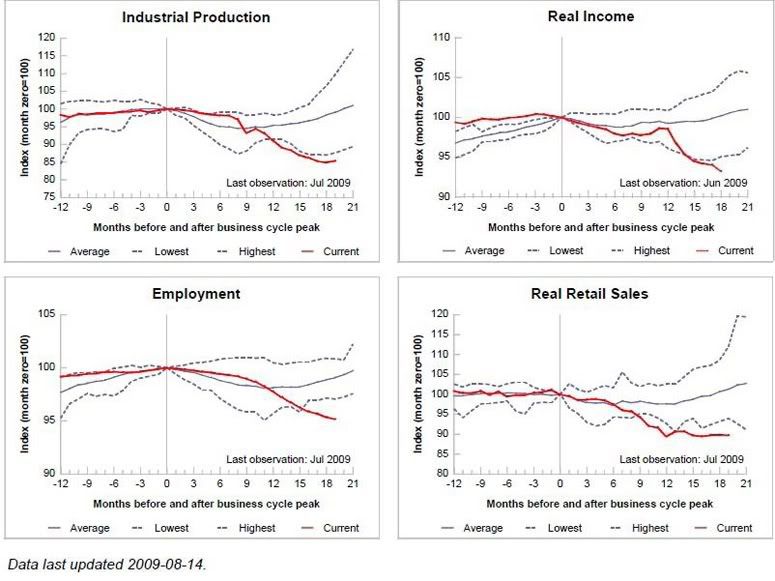
But jobs, or Employment, is one of 4 "Coincident Economic Indicators" (actually, the biggest, accounting for just over 50% of the index) kept by the Conference Board, along with Industrial Production, Real Income (a/k/a Personal income minus transfer payments), and Manufacturing and Trade Sales. Three of those four are also thought to be what the NBER tracks to determine if there is a recession or not. The difference is that the NBER includes our "holy grail", Real retail sales, as opposed to the Conference Board's Manufacturing and Trade Sales. This means, we have an excellent tool to estimate when Employment might turn positive, because it is this Index of Coincident Economic Indicators that is the exact thing that the Leading Indicators are supposed to lead!
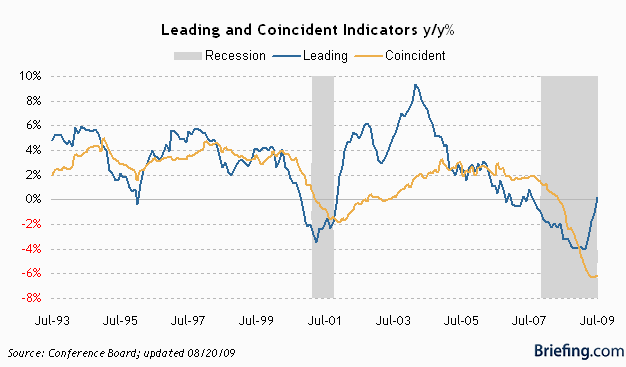
Here is where the Leading vs. Coincident Indicators stood before this week's report:
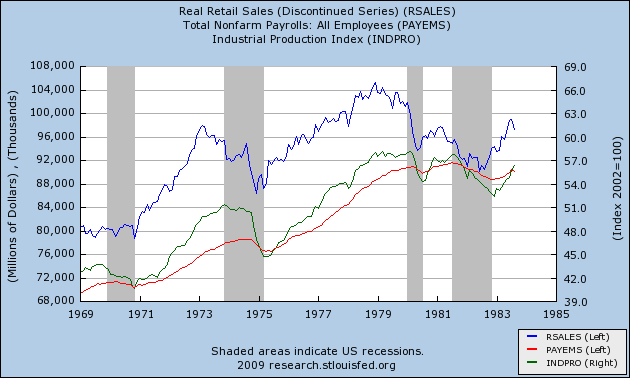
Here is the St. Louis Fred's index of each of the 4 coincident indicators as of last month:
As of this week, while the Coincident index moved sideways, the Leading index is now up ~+2.3% YoY. If it merely meanders sideways for the next 3 months, it will be up over 4% YoY (and barring a sudden stock market meltdown, it looks like it will rise again in September). In comparison, the LEI was ~+5% when jobs started to be added even during the 2002-3 "jobless recovery."
More importantly, the Leading index is designed to lead the Coincident index by about 6 months, give or take 3 months. For our purposes, simply put, the Coincident index should cross zero at some point during that time frame. That means that the average of the 4 series should be at the same reading -- 0% YoY -- at about that time.
So therefore, for purposes of this analysis, I am making the following assertions that I believe are reasonable and probable:
(1) The average of the 4 Coincident Economic Indicators, which include Employment, will cross 0% YoY at some point between October 2009 and April 2010.
(2) Manufacturing and Trade sales (used by the Conference Board as a coincident indicator) will track Real retail sales (used by the NBER to date Recessions) closely, with a several month lag.
(3) the 4 coincident indicators will improve by roughly the same percent (or at least not diverge more than in previous recoveries) in order to arrive at the average of 0.
(4) Jobs will follow a relatively stable trend of improvement - there will be no wild fluctuations.
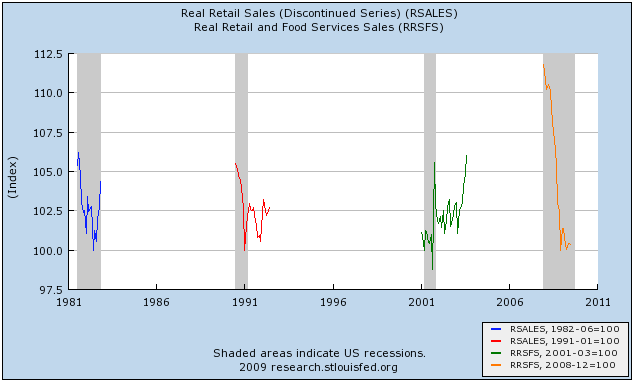
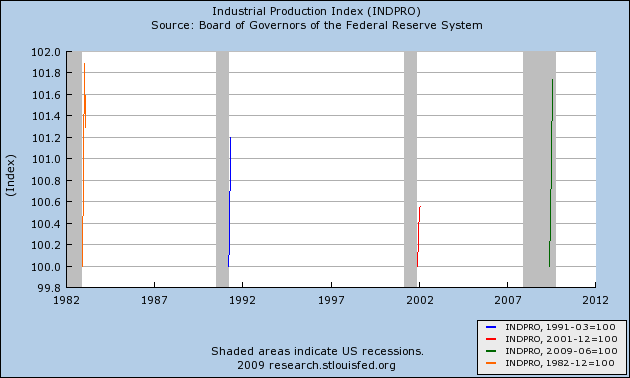
(5) Per my previous analysis, if both Industrial Production and Real retail sales advance more than 2.5% from their bottoms, Employment must be growing.
I am also varying the weighting given by the Conference Board to calculate the Coincident indicators slightly for ease of calculation.
With those parameters set, let's begin.
I. The above parameters mean, in summary, that in order for Employment not to bottom by the month Coincident Indicators average 0% YoY, both Industrial Production and Real retail sales must not have advanced 2.5% from their bottoms, BUT nevertheless, Industrial Production, Real income and Wholesale and Trade sales must be up sufficiently over zero as a group to compensate for Employment still being negative YoY.
For that set of parameters to be met, one of the two categories already advancing -- Real retail sales (wholesale and trade sales) and/or Industrial Production -- must stall (so that they are not both over 2.5% from their bottoms). But if one of them stalls, then to have a weighted average of zero at the crossover month, then the other of the two, together with the other laggard, Real Income, which only makes up about 15% of the index, must inexplicably surge by at 10%(!) (if we use the January 2010 crossover date), or 2% (if we use the easier 9 month target of April 2010) to make up for both the negative Employment number and the negative Industrial Production or Retail sales number.
The odds of all those conditions being met appear quite small. Even in the 2002 "jobless recovery," Industrial Production rose at most 1.7% and Real income 1.4% before the Coincident Indicators rose above 0% YoY. Thus, if the Leading Index simply works as designed, Employment must either be zero or higher YoY by January (give or take three months), or else Employment can still be negative YoY at that time but Real retail sales and Industrial Production must be at least 2.5% higher from their bottoms. Either way, it appears a extremely likely that by the time the Coincident indicators cross 0% YoY, Employment must have bottomed.
II. There is still one last item to consider, and that is whether there is a reasonable "glide path" or trend line that would be consistent with a bottom in employment as well as the weighted average growth of Coincident indicators being 0% YoY at the crossover month.
Since this past January, Employment is down -2.2%, Industrial Production is down -2.7% , Real income is down -2.3%, and Manufacturing and Trade sales, not shown, is down -6.3%. (940,862 Million in January, vs. 914,303 in June). To arrive at a weighted average of 0%YoY in January 2010, each of the above must improve on average 2.8%. In the case of Employment, that would mean the economy growing an average of 756,000 jobs each month for the next 5 months! That's not going to happen.
If we extend the time at which Coincident Indicators cross 0% YoY to April (9 months after when LEI's turned positive YoY), then since April 2009 Employment is down -0.9%, Industrial Production is up +0.3%, Real Income down -0.1%, and Manufacturing and Trade Sales down -1.3%. To arrive at a weighted average of 0% YoY in April 2010, each of the above must improve on average +0.6% from their present readings (actually, to comply with my +2.5% requirement, Industrial Production must still improve 0.8%, which means that Real income does not need to improve at all). In the case of Employment, that would mean adding a total of 426,000 jobs in 8 months, for an average of 53,250 new jobs a month. This can be done by a positive move of +62,500 a month, giving us the following nonfarm payrolls over the next 8 months:
Sept. 09 -145,000, Oct. 09 -91,000, Nov. 09 -28,000, Dec. 09 +34,000, Jan. 10 +97,000, Feb. 10 +159,000, Mar. 10 +200,000, Apr. 10 +200,000.
The above is just an example, adding +426,000 to total payrolls to meet the "0% YoY change in Coincident Indicators" constraint. Remember, though, that the purpose of this series is to try to estimate when the economy will begin to add jobs -- i.e., net +1 jobs. Using Leading vs. Cooincident indicators is a tool to do so. In other words, there are plenty of other "glide paths" that add jobs - although less than 426,000, if Industrial Production and Real retail sales both improve more. We just don't have the tools to estimate them well, although they must also be consistent with the analysis above.
Extending our crossover point to April gives us a "glide path" for Employment that looks perfectly reasonable and doable, given the strength of the Leading Economic Indicators. A slightly more aggressive "glide path" might possibly give us a positive number in November, if the target crossover date is March instead of April.
Let's review my analysis of when the Economy will begin to add jobs:
(1) ISM manufacturing and Industrial Production both suggest that Employment may well make a bottom as early as October.
(2) Initial Jobless claims suggest 3 months or longer, as does the slow improvement of Real retail sales. This puts us in December or January.
(3) The most likely month to give a reasonable "glide path" of actual job growth as indicated by the Leading Economic Indicators vs. Coincident Indicators is December, or possibly November if there is enough strength in the economy.
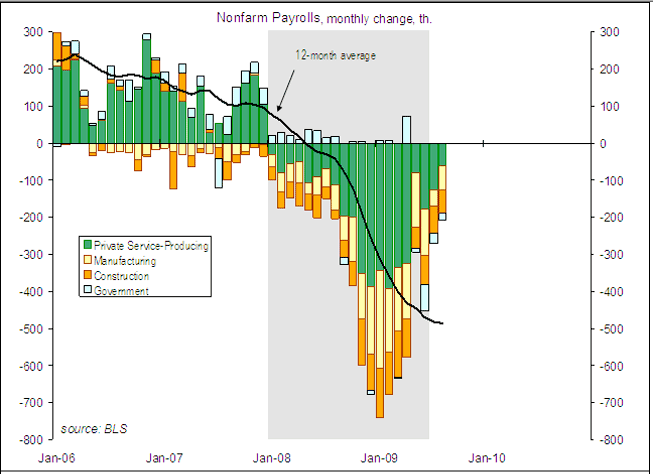
Note the trend since the December trough in payroll losses. Interestingly, this breakdown shows that it was May, not June, that was the outlier in the trend, as service businesses (green) had few layoffs that month. Nevertheless, the overall trend suggests that services could begin to add rather than lose jobs as early as this month, September! Manufacturing, in accord with the ISM index, may follow as early as next month, October. That leaves construction as the ongoing drag on job growth, and the question becomes, when will growth in services and manufacturing be enough to overcome construction losses.
Based on my analysis above, November or December are when I believe that turning point will be reached, plus or minus one month in either direction. Let me be the first to acknowledge that this is not a scientific truth or certainty, but a best estimate based on a logical review of existing data with a long history that accommodates both traditional and "jobless" recoveries. Nevertheless, at least in terms of payroll growth, the analysis in these six installments cause me to predict that this will not be a "jobless recovery" for long.
In my last installment, I will look at Real Retail sales as it relates to Unemployment.


