

The survey's broadest measure of manufacturing conditions, the diffusion index of current activity, increased from -7.5 in July to 4.2 this month. This is the highest reading of the index since November 2007 (see Chart). The percentage of firms reporting increases in activity (27 percent) was slightly higher than the percentage reporting decreases (23 percent). Other broad indicators also suggested improvement. The current new orders index edged six points higher, from -2.2 to 4.2, also its highest reading since November 2007. The current shipments index increased 10 points, to a slightly positive reading.
Labor market conditions remain weak. Firms continue to report declines in employment and work hours, but overall job losses were not as large this month. The current employment index increased from a weak reading of -25.3 to -12.9, its highest level in 11 months. Twenty-three percent of firms reported declines in employment this month, down from 30 percent in the previous month. Although the workweek index remained negative, the index increased nine points, to -6.3.

In the week ending Aug. 15, the advance figure for seasonally adjusted initial claims was 576,000, an increase of 15,000 from the previous week's revised figure of 561,000. The 4-week moving average was 570,000, an increase of 4,250 from the previous week's revised average of 565,750.


Norway's second-quarter mainland gross domestic product, which strips out oil and shipping activity, grew 0.3% on the quarter-earlier period, Statistics Norway said Thursday. The latest data mark an end to a two-quarter streak of declining GDP, with output down a revised 1.3% in the first quarter, and is much stronger than consensus from economists who expected a slight contraction in the second quarter.
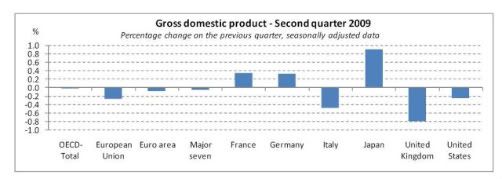
Gross domestic product (GDP) in the OECD area stabilised in the second quarter of 2009 (minus 0.002%), according to preliminary estimates, following a fall of 2.1% in the previous quarter.
For the Major Seven* countries, GDP fell marginally by 0.1% but with considerable variation in national rates, ranging from a 0.9% increase in Japan, following two quarters of significant falls (minus 3.1% and minus 3.5%), to a 0.8% decline in the United Kingdom. Positive growth was also recorded in France and Germany, both up 0.3% compared with falls of 1.3% and 3.5% respectively in the previous quarter. GDP fell by 0.3% in the United States following a 1.6% fall in the previous quarter. etc.

Hong Kong's gross domestic product in the April-June period grew 3.3% on a seasonally adjusted basis from the January-March period, when it contracted 4.3%.
The quarter-to-quarter expansion was the first since last year's second quarter.
On a year-to-year basis, the territory's second-quarter GDP contracted 3.8%, narrower than the previous quarter's 7.8% fall and better than the survey's median forecast of a 5% decline.
Israel's gross domestic product grew in the second quarter following six months of contraction, the latest sign the global economy may be emerging from its severe downturn.
The Central Bureau of Statistics Sunday said GDP grew at an annualized rate of 1% in the three months from April to June, having contracted by 3.2% in the first quarter 2009, and by 1.4% in the fourth quarter 2008.
"The aggregate data from the most recent quarters attest that the situation of the Israeli economy is better than those of the world's leading economies," Prime Minister Netanyahu said in a statement.
The return to growth was aided by a surge in government spending, but a recovery in exports and consumer spending also drove the pickup. However, some of the recovery in exports may relate to the start of full production at Intel Corp.'s (INTC) new factory, and may therefore not be sustained in coming quarters.
For the first time in considerably more than a year, the Empire State Manufacturing Survey indicates that conditions for New York manufacturers have improved. The general business conditions index increased 13 points, to 12.1, its highest level since November of 2007. Although the inventories index remained well below zero, the new orders and shipments indexes rose to their highest levels in many months. The prices paid index was positive, while the prices received index continued to be negative. Employment indexes were much improved from their recent low levels, although they remained below zero. Future indexes generally rose from last month and conveyed optimism about the six-month outlook; the capital expenditures index rose to its highest level in over a year.
Industrial production increased 0.5 percent in July. Aside from a hurricane-related rebound in October 2008, the gain in July marked the first monthly increase since December 2007. Manufacturing output advanced 1.0 percent in July; most of the increase was due to a jump in motor vehicle assemblies from an annual rate of 4.1 million units in June to 5.9 million units in July. Excluding motor vehicles and parts, manufacturing production edged up 0.2 percent. The output of utilities fell 2.4 percent, reflecting unseasonably mild temperatures in July, and the output of mines increased 0.8 percent. At 96.0 percent of its 2002 average, total industrial production was 13.1 percent below its level of a year earlier. In July, the capacity utilization rate for total industry edged up to 68.5 percent, a level 12.4 percentage points below its 1972-2008 average.
New-home construction and permits fell last month, but single-family-home starts remained strong, another sign of stabilization in the housing market.
Multifamily housing starts, a more volatile measure that includes properties such as condominiums and small apartment buildings, pulled overall housing starts down 1% in July from a month earlier to a seasonally adjusted 581,000 annual rate, the Commerce Department said Tuesday. That compares with a 6.5% increase in June.
Construction of single-family homes, though, rose 1.7%, to 490,000, in July after climbing 17.8% in June. Single-family permits, a sign of future construction, rose 5.8%. The rise in construction marked the fifth consecutive monthly gain, showing once again that the housing market is firming up, albeit at a slow pace.
While many economists agree the market already has hit bottom, housing-sector growth may not be a contributor to gross domestic product until next year because it is rebounding from such an extreme low. Singe-family starts are still 73% below their December 2005 peak.
"You don't want to lose sight of the fact that these are extremely depressed levels," said Wells Fargo Securities economist Adam G. York. "It's not necessarily time to break out the champagne and celebrate the boom of a returning housing market."

Gross domestic product in the Organization for Economic Cooperation and Development's 30 member countries stabilized between April and June with support from exporters Germany and Japan, but it remained sharply lower than in the second quarter of last year, the Paris-based group said Wednesday.
GDP across the OECD area, which includes many of the world's biggest economies, was steady in the second quarter compared with the first three months of the year, breaking one year of quarterly declines and a sharp reversal from the record 2.1% slump seen in the first quarter.
But GDP for the 30 countries was 4.6% lower than in the second quarter of last year, only marginally improved from the 4.7% year-to-year decline seen in the first quarter, it said.
The OECD report supports the view that the severe global economic downturn caused by the credit crisis is bottoming out, although the group has warned that the recovery is likely to be weak and fragile.


The global recession is now over and a recovery has begun, Olivier Blanchard, the top economist for the International Monetary Fund, said Tuesday.The global recession has not been typical, and the recovery won't be either, he said. "One should not expect very high growth rates in the recovery."
"The turnaround will not be simple," Blanchard wrote in an article released by the IMF. "The crisis has left deep scars, which will affect both supply and demand for many years to come." His article will be published by the IMF on Wednesday.
To an economist, the term "recovery" has a specific technical meaning: The economy is growing once again, but has not necessarily returned to its previous levels of output, wealth or employment. The economy is healing, but not yet healed.
Indeed, Blanchard said this recession has been so destructive that "we may not go back to the old growth path ... potential output may be lower than it was before the crisis."
Growth is coming for most countries, for at least the next few quarters, he said, but it won't be strong enough to reduce unemployment for a while.


 As with the commercial real estate loans, commercial and industrial loan standards are still tightening, but at a slower pace than the beginning of the year.


*
Home builders are gradually becoming more hopeful, even though surveys show most builders are still very discouraged. The builders' housing market index has risen in four of the past five months.
*
Housing starts have increased in four of the past five months after tumbling to a postwar record low. Building permits for single-family homes have risen at a 109% annual rate over the past three months.
*
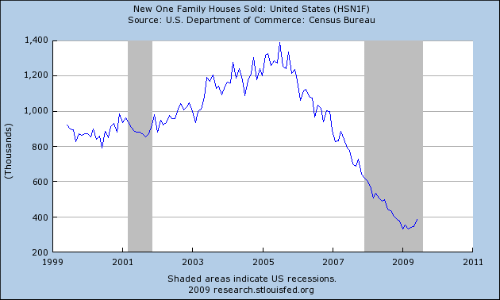
Sales of new single-family homes have risen three months in a row after falling to a record low in March.
*
Sales of existing homes have risen four of the past five months, supporting by a government subsidy for first-time buyers and by sales of foreclosed homes.


Confidence among U.S. consumers unexpectedly fell in August for a second consecutive month as concern over jobs and wages grew.The Reuters/University of Michigan preliminary index of consumer sentiment decreased to 63.2, the lowest level since March, from 66 in July. The measure reached a three-decade low of 55.3 in November.
The worst employment slump in seven decades has caused salaries to stagnate, rocking even Americans who still have jobs. The need to rebuild savings following the record drop in wealth from the plunge in stocks and home values will keep limiting spending in coming months.
“The consumer’s not off to a good start in the third quarter,” Jonathan Basile, an economist at Credit Suisse in New York, said before the report. “The concerns they’ve had because of jobs and income are still lingering and showing in their lack of spending.”
Here is the chart:
However, consider these charts from Pollster.com
The number of people who think the economy is getting better is once again increasing. And
The right track/wrong track numbers are again moving in the right direction.
These polls measure different parts of the same idea -- are thing getting better or worse and when do you think things are getting better?
In August, after more than a year of negative readings, the general business conditions index rose into positive territory and reached its highest level since November 2007—a clear indication that, on balance, business conditions had improved for New York State manufacturers. Thirty percent of respondents said that conditions had improved over the month, while 18 percent said that conditions had deteriorated. The new orders index rose 8 points to 13.4, and the shipments index rose 3 points to 14.1. Both of these indexes were at their highest levels in more than a year. The unfilled orders index rose slightly, to -9.6. The delivery time index, at -10.6, hovered near last month’s level. The inventories index rose 14 points from a very low level in July, but remained well below zero at -22.3.


