Friday, December 19, 2008

Weekend Weimer and Beagle

The markets are almost closed. This is the last weekend before Christmas -- if you haven't finished your shopping, now is the time. So until Monday, here are the kids.


Actually -- There Is A Credit Crunch

Recently the Minneapolis Federal Reserve Issued a Paper titled, "Facts and Myths About the Financial Crisis of 2008." In the introduction the paper states, "Here we examine four claims about the way the financial crisis affected the economy as a whole and argue that all four are myths." In doing so, they use aggregate data. In response, the Boston Federal Reserve wrote a paper titled, "Looking Behind the Aggregates: A Reply to Facts and Myths About the Financial Crisis of 2008." In this paper the authors argue that when an analysis is made of the underlying data for the aggregate data used in the first paper, "Out findings show that most of the commonly argued facts are indeed supported by aggregated data." So - who is right?

Information contained within the Minneapolis Fed's report casts doubts on the claims they make. First, they rely on the fact that there has been no decrease in lending. They look at total bank credit outstanding, total loans and leases, total commercial and industrial loans, and total consumer loans and conclude "we see no evidence of any decline during the financial crisis." Before we take their conclusions as golden, let's consider the economic landscape of the last year. According to the NBER the US was in a recession which started in December 2007 - a year ago. In other words, it should not be surprising there was not an increase in lending. In fact, a careful reading of each Beige Book from the last year along with a reading of the Federal Reserve's survey of senior loan officers indicates a drop in loan demand along with a tightening of lending standards throughout the year.

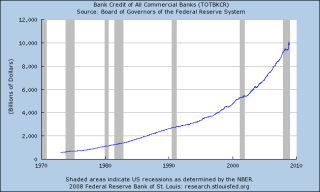
More importantly, let's look at total US credit outstanding going back to the early 1970s.
Photobucket

What does this chart tell us? There are two important facts.

1.) The latest recession is the only recession where total credit outstanding has leveled off for an extended period. (The first recession in the 1980s saw a contraction but only after total credit increased). While it didn't decrease it also didn't increase. Compare this to the previous 6 recessions when lending increased at least slightly throughout the recession. In other words, the leveling off of credit creation is a story in and of itself.

2.) In order for the US economy to grow it must have a continual supply of new credit. A leveling off is just as hazardous as a decline.

And that is what happened during most of 2008. The graphs contained within the Minneapolis Federal Reserve report show a clear leveling off of total outstanding credit for most of 2008. Again - this is the only recession in the last 40 years where this has happened.

Secondly, the Minneapolis Fed relies on the spread of various bonds to the Treasury curve. This will take several steps to explain.

Step 1: A bond's price and yield are inversely related. As bond prices go up, the bond's yield goes down. As a bond's price goes down, its yield goes up.

Step 2: The yield on various bonds and assets are compared to the Treasury curve to measure "risk". People assume that US Treasury Bonds are the safest investments in the world. Therefore, comparing the interest rate on various assets to the comparable Treasury (the Treasury with the same maturity) will tell us how risky that asset is.

Step 3: Inflation eats away at fixed income investments. As a result, when investors think inflation will decrease they are more likely to buy Treasury bonds because there is less chance the income received will fall because of higher inflation.

Here's an example. Suppose a 10 year Treasury bond was yielding 5% and a 10 year corporate bond was yielding 7%. The "spread" would be 2% or 200 basis points. This is the difference between the yield on the Treasury bond and the corporate bond. Suppose another corporate bond was yielding 8%. This spread would by 3% or 300 basis points. These facts tell us the market things the second corporate bond is riskier because it yields more than the comparable Treasury and a corporate bond with the same maturity.

Let's take all of this and apply it to the Minneapolis Fed's report. They notice that

While the rationale [for using spread analysis] may be compelling in normal times, we think that a focus on spreads can lead to misleading inferences during financial crises. Financial crises are often accompanied by a flight to quality during which the real return to Treasury securities falls dramatically, that is, the nominal return falls dramatically for reasons other than changes in expected inflation.


Over the last few months we've seen a huge rally in Treasuries. In fact, some people have argued the Treasury market is in a bubble. As a result, the yield on Treasuries is really low. But this is not caused by inflation expectations; that is, people are not buying Treasuries because they think inflation is low. They are buying Treasuries because they are concerned about investment safety.

What the Minneapolis Fed report fails to take into account is inflation in one reason for invetors to purchase Treasury bonds. Another is safety. Because US Treasury bonds are considered the safest in the world people are buying them at a high rate meaning Treasuries are yielding an incredibly low rate right now. Some T-Bills have recently been issued at 0% interest! That in and of itself tells us the level of concern is abnormally high and a credit crunch is indeed going on - people don't' want any return; they simply want their money bank!

In short, inflation expectations are one reason why people buy Treasury bonds. But another very important reason is safety. And investors are clearly concerned mostly with safety right now if they don't even want a return on their investment.

The Bank of Boston adds other extremely credible explanations for the lack of decline in lending. They note that in a credit crunch companies rely more on their existing lines of credit as other sources of funds (the stock market, commercial paper and new lines of credit) dry up. In addition, banks are unable to securitize loans in the current environment and are therefore forced to keep more loans on their books, thereby increasing lending. The paper also shows that lower grade corporate issuers (single A) have seriously cut back on their commercial paper issuance, indicating that only the very best credit quality issuers are able to obtain short-term funding in the commercial paper market.

From a personal level -- and purely anecdotal -- I work with several business brokers in the Houston area. Over the last 6 months when we have seen is a tightening of credit which has caused an increasing number of deals to fall through.

The point of all this is simple: the facts within the Minneapolis Fed's paper directly contradict the Fed's conclusions. In addition, the Boston Fed's paper adds more credible evidence that a credit crunch is indeed ongoing. I would add that a thorough review of the anecdotal evidence in the Federal Reserve's Beige Book and Senior Loan Survey shows lending standards have been tightening for a year and loan demand has been dropping.

But more to the point: why is this debate occurring? What are we talking about whether or nor there is a credit crunch? There are two reasons.

First, the Treasury has mishandled the TARP from the very beginning. First Paulson wanted unfettered power to do whatever he wanted to with the funds without and Congressional or judicial review. Then he came up with the $700 billion number out of thin air. Next he wanted to buy troubled assets only to change his mind to injecting money directly into the banks. And then the GAO released a report stating there was no oversight of any of this. Simply put, the program's creation, implementation and supervision are all a disaster.

Secondly, there is a very strong anti-Wall Street mood right now. Some of this is deserved. We got into this mess because Wall Street wanted deregulation only to act poorly when there were no rules. However, not everyone who works on Wall Street is a relative of Satan. And simply because you are involved with investment banking or investments in general does not mean you are evil. I know several brokers who have offered their clients excellent advice over the last year - advice which has lead to lower commissions for them. And they are not alone. The point is painting any group of people with a broad brush is a bad idea.

Forex Friday's


Click for a larger image

Notice the following on the weekly chart

-- Prices have moved through the 10 and 20 week SMAs

-- The 10 week SMA has turned lower

-- The RSI was overbought but is now in neutral territory

-- The MACD is overbought


Click for a larger image

Notice the following on the daily chart:

-- Prices have broken through two levels of technical support this week

-- The 10 and 20 day SMA are both moving lower

-- The 10 day SMA has crossed below the 50 day SMA and the 20 day SMA is about to

-- The RSI is now oversold as is the MACD

Thursday, December 18, 2008

Today's Market

Photobucket

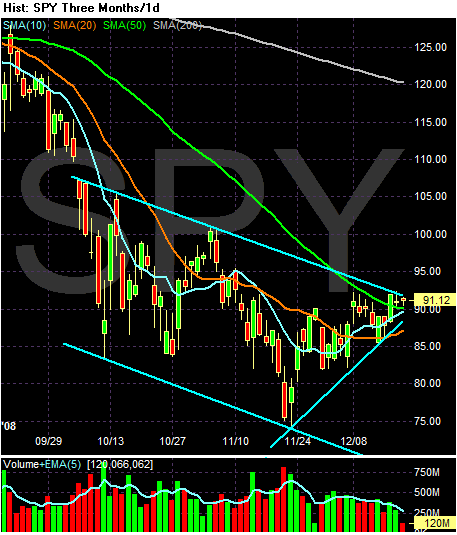
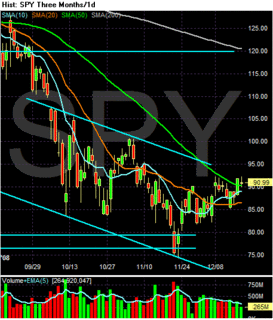
On the SPYs note the following:

-- Prices are right at the top of a downward sloping channel

-- Prices have been increasing since the end of November

-- The 10 day SMA is rising, it has crossed the 20 day SMA and it is about to cross over the 50 day SMA

-- Prices are above the 10, 20 and 50 day SMA

-- The 20 day SMA is now increasing

Let's add a few more charts

Photobucket

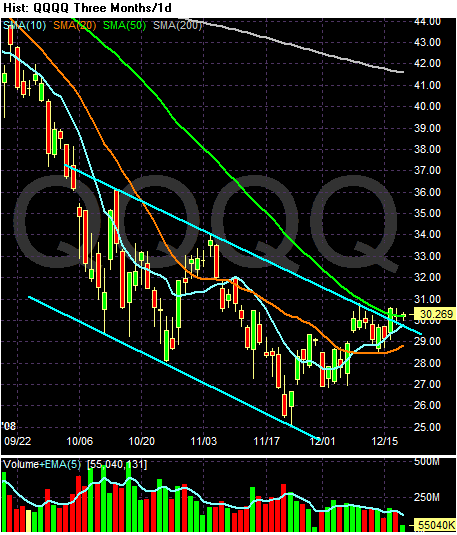
Notice the following on the QQQQs

-- Prices are above the downward sloping channel

-- Prices are right at the 50 day SMA

-- The 10 day SMA crossed the 20 day SMA

-- The 20 day SMA is heading higher

-- Prices have been rallying since the end of November

Photobucket

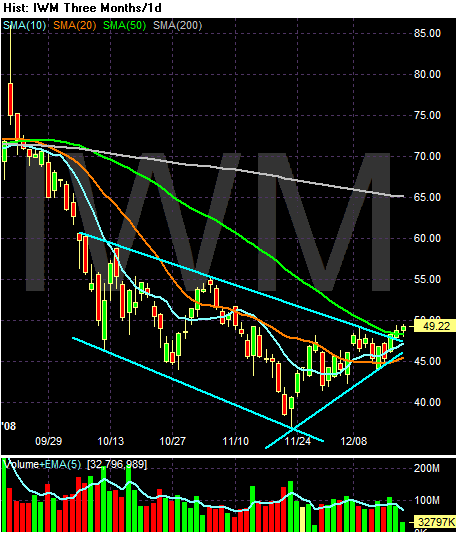
Notice the following on the IWMs

-- Prices have been increasing since late November

-- Prices are above the downward sloping channel

-- Prices are over the 50 day SMA

-- The 10 day SMA is increasing, it has crossed over the 20 day SMA and it is about to cross over the 50 day SMA

Bottom line: the markets are lining up for a rally.

Manufacturing Tanking Hard

We've had all the monthly manufacturing data released. The news is terrible.

Let's start with the ISM manufacturing survey. Here is the relevant graph:


Click for a larger image

Notice the index as dropped off a cliff over the last two months. Consider the following from the report:

PERFORMANCE BY INDUSTRY

The two industries reporting growth in November — listed in order — are: Apparel, Leather & Allied Products; and Paper Products. The industries reporting contraction in November are: Nonmetallic Mineral Products; Fabricated Metal Products; Textile Mills; Printing & Related Support Activities; Machinery; Electrical Equipment, Appliances & Components; Primary Metals; Transportation Equipment; Furniture & Related Products; Plastics & Rubber Products; Computer & Electronic Products; Chemical Products; Petroleum & Coal Products; Miscellaneous Manufacturing; Food, Beverage & Tobacco Products; and Wood Products.

WHAT RESPONDENTS ARE SAYING ...

* "The only positive thing of late is that the U.S. dollar has strengthened significantly against other currencies. We import the majority of our materials so this will have the effect of lowering our COGS." (Transportation Equipment)
* "Steel industry is our main customer, and they have had a real slowdown." (Computer & Electronic Products)
* "Criteria for projects is significantly higher with very short ROI periods." (Food, Beverage & Tobacco Products)
* "We have revised downward our top-line sales estimates for CY2009 by 8 percent due to the continued softness we see in the housing sector." (Machinery)
* "Suppliers are trying to hold onto pricing, but petrochemical and commodity prices are dropping like a rock." (Plastics & Rubber Products)


And consider the historic nature of the problem:

The contraction underway in the manufacturing sector is of historic proportions, the results of November's ISM manufacturing report that shows a headline index of 36.2, down nearly 3 points in the month. The reading is the lowest since 1980 recession. Key components in the survey show greater weakness than the headline index including a 31.5 level for the production index that matches the record low in May 1980. New orders at 27.9 is at its lowest since the early 80s while, in perhaps the most stunning reading of all, prices paid is at 25.5, down 11.5 points in the month for the lowest reading since early data in 1949 -- a critical indication that demand is falling and falling very sharply.


Notice that only two industries expanded whereas 16 contracted. Sales reports are being downgraded and the criteria for projects is increasing. Simply put -- things are bad. Also note we are at lows not seen since the 1980s. That is not a comparison anyone wants to make.

Overall industrial production is also down. From the Federal Reserve:

Industrial production decreased 0.6 percent in November with declines widespread across industries. The drop in output in September was revised down, and the rebound in October was revised up, in large part because both the decrease due to the September hurricanes and the subsequent partial recovery in October were larger than previously reported.

Manufacturing production dropped 1.4 percent in November despite the resumption of activity in the commercial aircraft industry after the resolution of a strike early in the month. The output of mines advanced 2.5 percent, primarily as a result of a further post-hurricane recovery in crude oil and natural gas operations in the Gulf of Mexico. Taken together, the rebounds after the strike and the hurricanes added almost 1 percentage point to the change in industrial production. The output of utilities rose 1.6 percent.

At 106.1 percent of its 2002 average, total industrial production in November was 5.5 percent below its level of a year earlier. The capacity utilization rate for total industry fell to 75.4 percent, a level 5.6 percentage points below its average level from 1972 to 2007.


Here are the relevant graphs:


Click for larger images

The year over year number is a big concern. Also note that capacity utilization is leveling at a lower level than the level we've had for the last few years. The bottom line is we're slowing down.

The New York area's manufacturing index is also in very bad shape:

The Empire State Manufacturing Survey indicates that conditions for New York manufacturers deteriorated significantly in December. The general business conditions index, at -25.8, held near the record low set in November. The new orders and shipments indexes also remained near their recent record lows, and the unfilled orders index dropped to a new low. The indexes for prices paid and prices received fell below zero, and employment indexes remained deep in negative territory. Future indexes remained subdued, with the capital spending and technology spending indexes remaining well below zero.


The graph shows the severity of the slowdown:


Click for a larger image

Again -- this is a significant decline which happened quickly. In indicates the slowdown is extreme, sharp and very sudden.

Finally there is the Philadelphia survey:

Conditions in the region's manufacturing sector continued to deteriorate this month, according to firms polled for the December Business Outlook Survey. All of the survey's broad indicators remained negative this month and at relatively low levels. Firms reported declines in input prices and the prices for their own manufactured goods this month. Consistent with the weakness in current activity, most of the survey's indicators of future activity slid further into negative territory, suggesting that the region's manufacturing executives expect continued declines over the next six months.


Here is the relevant graph:


There is no good news in any of these releases. Simply put, manufacturing is in terrible shape.

Wherein I Pay Up On A Bet

I am a total economics geek. I make bets on what the inflation rate will be at year end.

I bet New Deal Democrat over at the Economic Populist that the US inflation rate for the US would be higher in 2008 than 2007. While there is still one month left I feel confident in saying that December will not see a massive jump in inflation. As a result, I have donated $50 to Baghdad Pups.

BTW -- this is an entirely worthy charity run by the SPCA to help service men and women bring home animals they have befriended in Iraq. Being a big dog lover this is right up my alley.

Thursday Oil Market Round-Up


Click for a larger image

Notice the following on the weekly chart:

-- Prices are near their lowest level in three years

-- All the SMAs are moving lower

-- Prices are below all the SMAs

-- The shorter SMAs are below the longer SMAs

BUT

-- The RSI is oversold and

-- The MACD is oversold


Click for a larger image

Notice the following on the daily chart:

-- All the SMAs are moving lower

-- The shorter SMAs are below the longer SMAs

-- Prices have been bouncing from the 20 day SMA for the last three months

BUT

-- The MACD has been increasing for the last few months.

Bottom line: The market is technically oversold right now. But there are no fundamental events strong enough to move the market higher. Consider the following:

Since September, members of the Organization of the Petroleum Exporting Countries have pledged cuts totaling 4.2 million barrels a day, or nearly 12 percent of their capacity, a record in such a short time.


The bottom line is a lot of capacity is going off line (at least theoretically). If a 10% cut in production isn't strong enough to move prices higher, then it's going to take a lot more. My guess is from here oil will try and form a bottom to rally from.

Wednesday, December 17, 2008

Today's Market

Photobucket

Let's look at the daily chart to see what the technicals tell us:

-- The longer term trends are still bearish: the 50 and 200 day SMAs are both heading lower

-- Prices are still in a downward sloping channel

BUT

-- Prices are above the 10, 20 and 50 day SMA

-- The 10 day SMA is moving higher

-- The 10 day SMA is above the 20 day SMA

This is a chart in transition; it is a mix of bullish and bearish indicators.

A Little Humor Break

This has been mentioned several times in "quotes of the year" retrospectives:

10. (tie) "Anyone who says we're in a recession, or heading into one — especially the worst one since the Great Depression — is making up his own private definition of "`recession.'" — commentator Donald Luskin, the day before Lehman Brothers filed for bankruptcy, The Washington Post, Sept. 14.


Personally, I've been laughing about this ever since someone pointed it out sometime over the last few weeks. This guy is a moron of the highest order; why anyone would listen to him -- let alone spew his stupidity -- is beyond me.

Comparisons To Other Recessions

I've been meaning to link to this for some time but it has slipped my mind. Macroblog ran a set of employment data comparing the current recession to other recessions. Here is their conclusion:

One way to look at this is to examine the trajectory of employment relative to December 2007 levels (when this recession began) and compare it with the average trajectory of relative employment in other recessions:

.....

A more apt comparison might therefore be the “bad” recessions of recent memory, the 1973–75 and 1981–82 episodes, which both lasted sixteen months.

Here, for your viewing displeasure, are those comparisons:

.....

The trajectories suggested by the relatively long-lived, more severe recessions of 1973-75 and 1981-82 are almost certainly more sensible comparisons at this point. And, as bad as it is right now, we are still a fair distance from the pace of relative employment losses in those episodes.


This is an interesting observation and it helps to put the current situation in historical perspective. Let me add my own theory.

I think that what is happening in the 4Q of 2008 and the 1Q of 2009 will be the "tear the band-aid off quickly to get it over with" wave of layoffs. Here is a graph of job creation for the last 10 years:


Click for a larger image

The best read of job creation for the latest expansion is 8.2 million jobs (from 129,822,000 in August 2003 to 138,078,000 in December 2007). This figure alone is very important. It tells us that job creation was low. Why? My personal thesis is that companies have become incredibly streamlined over the last 30 years; in general they now only hire when it is absolutely essential. As a result total job creation is decreasing for expansions. This is the natural result of the productivity increase we have seen over the same time.

So far this year we've lost 1.9 million jobs or 23% if all jobs created during the latest expansion. The worst rate of job losses for a recession over the last 60 years is about 50% in a recession that occurred in the 1950s. So, we're about halfway there. For the US to get to the 50% mark we need to lost about another 2.1 million jobs. Assuming a 250,000 - 500,000 rate per month, that means we have about another 3-6 months of ugly job losses to go.

After that my hope is we see a big fiscal package approved to start pumping money into the economy. This will make the 4th quarter a fair but not great half year.

I could be wrong in all of this. The economy likes to make an ass out of economists -- and actually does so with alarming frequency.

On the Madoff Situation

I haven't written anything about the Madoff scheme yet. There have been so many economic events to keep up with that it can be a bit like trying to plug holes in a dike. However, here are some points.

1.) This is crap. According to the SEC:

The Commission has learned that credible and specific allegations regarding Mr. Madoff’s financial wrongdoing, going back to at least 1999, were repeatedly brought to the attention of SEC staff, but were never recommended to the Commission for action. I am gravely concerned by the apparent multiple failures over at least a decade to thoroughly investigate these allegations or at any point to seek formal authority to pursue them. Moreover, a consequence of the failure to seek a formal order of investigation from the Commission is that subpoena power was not used to obtain information, but rather the staff relied upon information voluntarily produced by Mr. Madoff and his firm.


Yet they did nothing. As per the usual course over the last 10+ years, regulations were not enforced. In fact, it's as though there were no regulations in effect. Meaning -- what is the actual purpose of the SEC when a $50 billion dollar scheme can go unnoticed for this long? Does everyone just go to the office and play cards all day long?

2.) There is no way this is a solo job. Again from the SEC

SEC investigators are currently working with the trustee and other law enforcement agencies to review vast amounts of records and information involving Mr. Madoff and his firm. Those records are increasingly exposing the complicated steps that Mr. Madoff took to deceive investors, the public and regulators. Although the information I can share regarding an ongoing investigation is limited, progress to date indicates that Mr. Madoff kept several sets of books and false documents, and provided false information involving his advisory activities to investors and to regulators.


The steps Madoff employed were "complicated". There were "several sets of books and false documents." Bottom line -- my guess is his whole firm is involved. Again -- where in the hell were the regulators?

Yesterday on CNBC there was an interview with a defrauded couple. They received monthly statements that showed transactions in individual stocks. They weren't the only people who received this information -- my guess is everybody did. That means the degree of sophistication involved is huge. Again Ii return to my thesis -- everybody at his firm is suspect.

This is a disaster. It indicates how far we have come from the idea of having a regulatory authority overseeing the market to insure the market is honest, fair and provides level playing field. We need to get back to that place. Now.

Wednesday Commodity Round-Up

Click for larger image

Notice the following on the weekly chart:

-- Prices are at or near their lowest point in over three years

-- Prices have taken a nosedive over the last 5 months

-- The shorter SMAs are below the longer SMAs

-- All the SMAs are moving lower

-- Prices are below all the SMAs

BUT

-- The MACD is oversold

-- The RSI is oversold big time


Click for a larger image

Notice the following on the daily chart:

-- Prices have continually moved lower over the last 5 months

-- All the SMAs are moving lower

-- The shorter SMAs are below the longer SMAs

-- Prices have continually used the 20 day SMA as upside resistance over the last 4 months and are doing so now.

BUT

-- The MACD has been rising for the last month and a half and

Bottom line: this is an index that wants to rally. The weekly RSI and MACD and the daily MACD are all signaling an oversold condition. But, right now there is no fundamental catalyst. The OPEC announcement might help, but we will have to wait and see.

Tuesday, December 16, 2008

Today's Market

WOW -- important technical news today

Photobucket

Note the SPYs are now trading above the 50 day SMA. That's very important news -- it indicates the rally is gaining strength.

The Fed's New Strategy: The Kitchen Sink Interest Rate Policy

The Fed announced their policy of establishing "a target range for the federal funds rate of 0 to 1/4 percent."

This brings two points to mind:

1.) The Fed has no interest rate moves left. This is it.

2.) The Fed is terrified about the economy. And they have good reason:

Since the Committee's last meeting, labor market conditions have deteriorated, and the available data indicate that consumer spending, business investment, and industrial production have declined. Financial markets remain quite strained and credit conditions tight. Overall, the outlook for economic activity has weakened further.


Let's look at the charts:

Photobucket

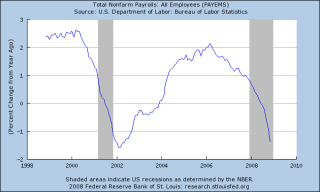
Employment has taken a nosedive. As a result:

Photobucket

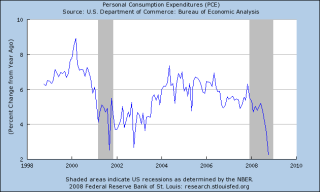
People have cut way back on their spending. As a result:

Photobucket

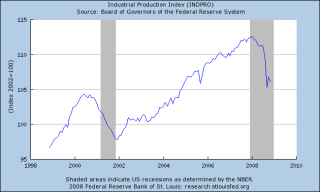
Industrial production is dropping and so is:

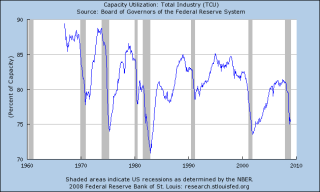
Photobucket

Capacity Utilization -- the amount we are using of our manufacturing capacity.

More to the point, the Fed will step up their other activities:

The focus of the Committee's policy going forward will be to support the functioning of financial markets and stimulate the economy through open market operations and other measures that sustain the size of the Federal Reserve's balance sheet at a high level. As previously announced, over the next few quarters the Federal Reserve will purchase large quantities of agency debt and mortgage-backed securities to provide support to the mortgage and housing markets, and it stands ready to expand its purchases of agency debt and mortgage-backed securities as conditions warrant. The Committee is also evaluating the potential benefits of purchasing longer-term Treasury securities. Early next year, the Federal Reserve will also implement the Term Asset-Backed Securities Loan Facility to facilitate the extension of credit to households and small businesses. The Federal Reserve will continue to consider ways of using its balance sheet to further support credit markets and economic activity.


To the point: the Fed is scared right now. I mean really scared. And they will do anything even remotely possible right now.

Federal Reserve Lido


Click for a larger image

How low can they go?

So Much for Inflation

From the BLS:

The Producer Price Index for Finished Goods fell 2.2 percent in November, seasonally adjusted, the Bureau of Labor Statistics of the U.S. Department of Labor reported today. This decline followed decreases of 2.8 percent in October and 0.4 percent in September. At the earlier stages of processing, prices received by manufacturers of intermediate goods dropped 4.3 percent in November after falling 3.9 percent in the prior month, and the crude goods index declined 12.5 percent subsequent to an 18.6-percent decrease in October.


Here's the relevant YOY PPI chart:


Click for a larger image

Also from the BLS:

The Consumer Price Index for All Urban Consumers (CPI-U) decreased 1.9 percent in November, before seasonal adjustment, the Bureau of Labor Statistics of the U.S. Department of Labor reported today. The November level of 212.425 (1982-84=100) was 1.1 percent higher than in November 2007.


Here's the relevant year over year chart:


Click for a larger image

When looking at these charts it's important to remember the impact of the CRB index which has been crashing hard:


Click for a larger image

This in turn is caused (at least partially) by the rallying dollar:


Click for larger image

Notice how the dollar's rally and the CRB's drop occurred at about the same time.

The bottom line is inflation is no longer an issue. It also means a period of deflation is possible. What fun.

Treasury Tuesdays

Are we in a Treasury market bubble? Some people think so:

In the wake of popped stock, housing and commodity bubbles, some see a fourth bubble building -- in Treasury bonds. Unlike those bubbles, this one doesn't have to end disastrously.

Treasury yields, which move inversely to prices, are at historic lows. Friday, the yield on the 10-year note fell to 2.47%, the lowest in Federal Reserve records going back to 1962 and well below the average of the past decade of about 4.7%.

Treasurys have been rare good investments in this awful year, returning 10% through November, according to Merrill Lynch chief North American economist David Rosenberg, a longtime bond bull. But even he recently told clients that Treasurys were "clearly heading into a bubble phase" and suggested there might be greener pastures in other fixed-income investments, such as debt backed by government-sponsored entities.

Meanwhile, the U.S. government may post a trillion-dollar budget deficit in the fiscal year ending in September and has pounding fiscal headaches looming far beyond that. Some key buyers of its debt, foreign central banks, are launching their own expensive stimulus packages and would seemingly have better uses for their cash.

And while the U.S. government's access to cheap money helps its efforts to stimulate the economy, it also may crowd out other borrowers. Municipalities and companies with good credit histories are paying exorbitant rates to borrow, arguably extending the pain of the credit crunch.

"We have a remarkable situation in which a 30-year loan to the U.S. government with a taxable instrument pays you 3% and a loan to the state of Ohio pays you 5% tax-free," said David Kotok, president of money-management firm Cumberland Advisors in Vineland, N.J.


A few weeks ago I noted that yields would probably provide some upside resistance for bonds. Remember prices and yields move inversely; as bonds prices rise yields fall. At some point, investors just aren't being compensated for the time risk they are taking (as in lending money for a long period of time).

Unfortunately, this did not take into effect the credit crunch. Right now people are not thinking about return on capital; they are thinking about return of capital. As a result government bonds look pretty good. But take a look at the charts:

Photobucket

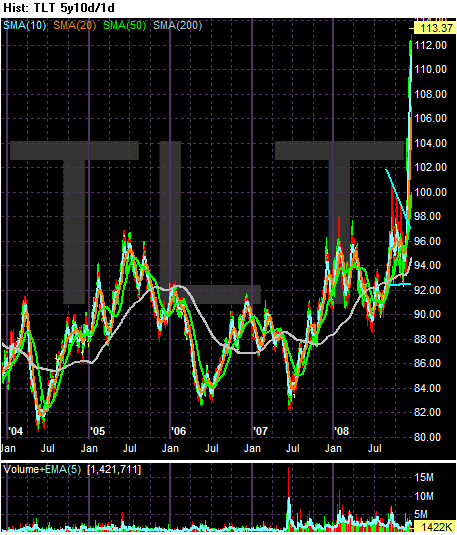
Above is a 5-year chart of the TLTs -- the ETF that tracks the long end of the Treasury curve. Prices remained in an 82 - 96 range for three and a half years from 2005 until the 4Q of 2008. Before that they were trading cheaper. Now take a look -- prices are spiking into record high territory.

Here is a chart of the 30-year yield. Remember the 30 year bond was retired for several years at the beginning of this decade:


Click for a larger image
Yields are now the lowest they have been in over 30 years.

Photobucket

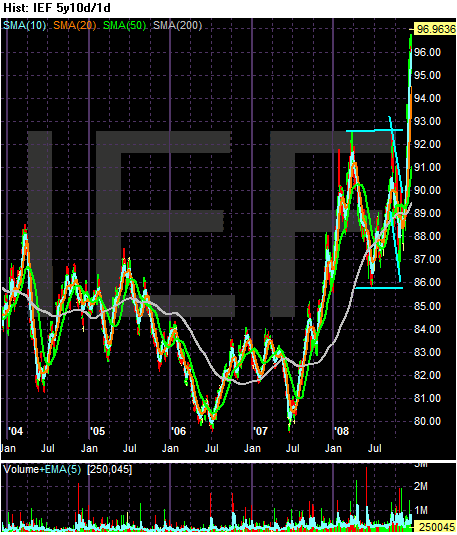
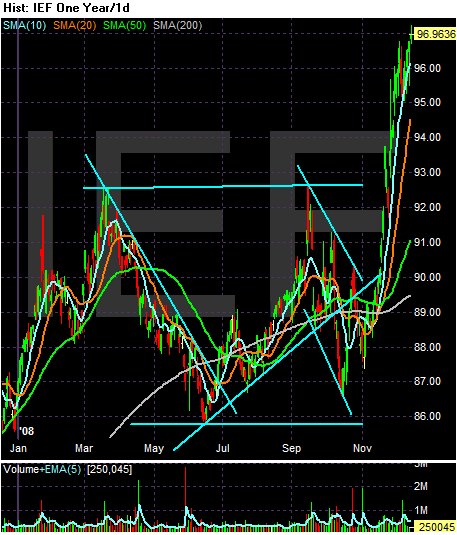
Above is a 5-year chart of the IEFS -- the ETF that tracks the 7-10 year Treasury market. Notice that prices are at record highs. Earlier this year I commented that Treasuries (specifically the IEFs) may be forming a double top, which is better illustrated by the following 1-year chart:

Photobucket

The first top occurred right after the first of March and the second top occurred right at the beginning of September. But notice that prices have moved right through the 92.5 area to make a new top. Here's a chart of the 10-year CMT Treasury's yield -- which moves inversely to price:


Click for a larger image

Again, notice that yields are at multi-decade lows.

Photobucket

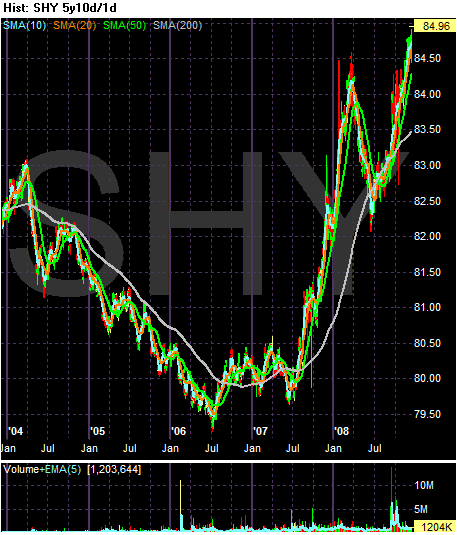
Above is a chart of the SHYs -- the short end of the Treasury curve. Again, notice the price spikes that have occurred in the latest rally.

All of the charts above are "bubble" charts -- prices have spiked to incredibly high levels largely based on panic and concern. Also consider the fiscal backdrop this is occurring in. There are talks of the new administration implementing a $1 trillion spending program over 2 years. That means record deficits. As a result the Treasury will need to borrow big. Increased supply = lower price = higher yield. At least that's what traditional market thinking would lead to.

Monday, December 15, 2008

Today's Market

Photobucket

Most of my thoughts on today's market were written in this morning's post. The central issue is technically the market wants to rebound -- the MACD and OBV are increasing and the market has shrugged off some very bad news. But so long as prices remain in a downward sloping channel I will be concerned.

Some Very Interesting Observations

The following is from a Barron's interview with Stephanie Pomboy:

What else do you see happening in the near term?

With the government guaranteeing all manner of private-credit claims, many investors may decide to get long "socialism," for lack of a better term. Or, as some euphemistically put it, this is partnering with the government. So in the short run, we could see a rally in risky assets and a selloff in Treasuries. But the economic deleveraging has barely begun, and that's my longer-term thesis. It all revolves around the idea that U.S. consumers are actually going to do the unthinkable -- they are going to save -- and that we will be more like Japan than anyone believes is possible.

Hence, consumption declines.

Right. Wages have been silently crowded out by benefits as a share of total compensation, as companies look to offset rising health-care costs. The result is that the share of income that consumers can actually spend is at its lowest in the post-war period. It had not been a problem, because consumers would just borrow to fill that gap. But now, they don't have appreciating assets against which to borrow. So while we could get a rally in risk assets -- including high-yield debt -- it's likely to be a short-term rally within a context of a secular bear market.


I have not seen this idea/concept phrased as well. Wages -- the actual dollars that people spend -- have been crowded out by benefits -- as in medical insurance. In other words, the raise that people thought they were getting in their overall compensation in fact went to something they could only spend on one thing -- namely health care. As a result, people have to borrow to buy other stuff. Hence we have seen the following events.

Consumer debt has been increasing:


Click for a larger image

Savings has been decreasing:


Click for a larger image

Retail Sales Drop


Click for a larger image

Above is the chart from the Census Bureau's release. But, it's not as bad as thought:

With gasoline prices plunging and auto sales on life support, U.S. retail sales dropped 1.8% in November for their fifth straight decline, the Commerce Department reported Friday.

Retail sales -- which account for about a third of final demand -- were down 7.4% compared with a year earlier. In the past three months, sales have fallen 4.7% compared with the previous three months.

.....

But the extent of the decline was exaggerated by a historic drop in retail gasoline prices in November. Excluding the record 14.7% fall in sales at gas stations, retail sales fell just 0.2%.


This drop should not be surprising. The US is in a recession, consumer confidence is low and households are taking major hits to both their stock and real estate portfolios. To that end, notice this huge drop in household wealth from the just released Flow of Funds Report

There is also the possibility things aren't that bad when you take out autos and gas station sales:

However, excluding those two sectors and the weak building-materials industry, retail sales would have increased 0.5% for the month. With the economy losing half a million jobs in November, said J.P. Morgan Chase & Co. economist Michael Feroli, "the most plausible explanation for the increase...is that gasoline prices dropped a record 30% in the month, freeing up purchasing power for those lucky enough to keep their jobs."


The short version here is Christmas probably won't be as bad as people think. But that does not mean consumers are going to go all out either. In addition, my guess is that after the first of the year we're going to see big pull backs as people hunker down for the next few months to see what the new administration does and whether or not it helps.

Market Monday's

I'm back. Let's start the week off with a broad look at the markets.

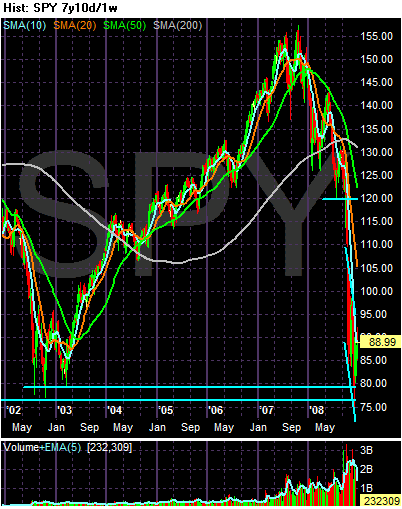
Photobucket

Let's start with a long-view. Above is a 7-year chart of the SPYs in weekly increments. Notice that all gains from the 2003-2007 rally are now gone. The market is trading at levels from the 2002-2003 consolidation.

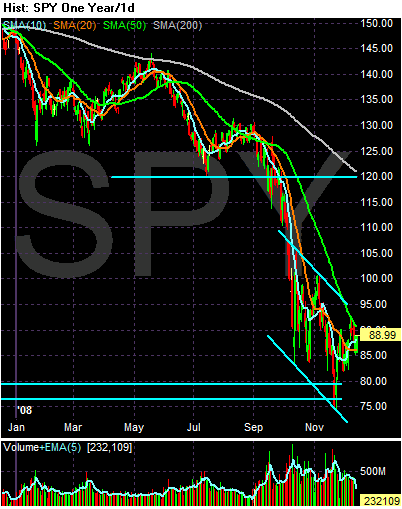
Photobucket

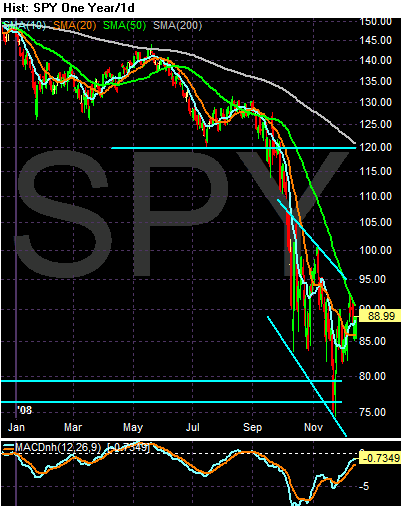
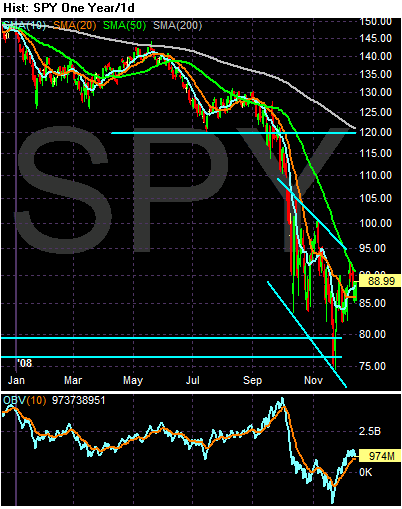
Above is a yearly chart in daily increments. Please note the following:

-- Once prices fell through the 120 level, they dropped hard and fast. They went to 90 (a 25% drop) within a month, and hit the 75 level (a 37.5% drop) wthin two months. Obviously 120 was an incredibly important level for traders

-- There was also a big volume spike on the sell-off indicating a lot of people were simply getting out.

-- The market is 25.84% below the 200 day SMA. In other words, we're clearly in a bear market

Photobucket

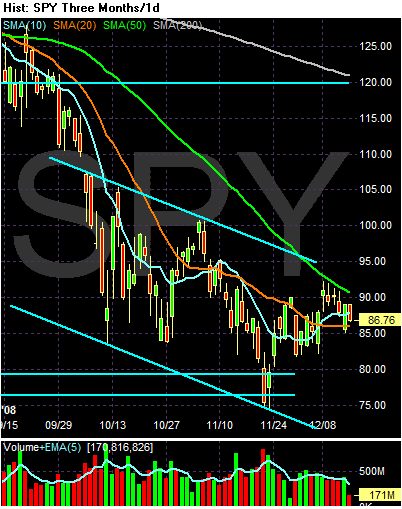
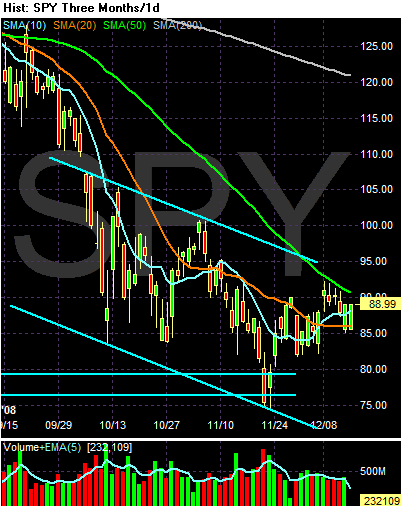
On the 3-month daily chart notice the following:

-- The 50 and 200 day SMA (longer term trends) are both moving lower

-- The 10 day SMA is rising and it has crossed the 20 day SMA

-- The 20 day SMA is neutral (moving sideways)

-- Prices rose to the 50 day SMA but couldn't get over the line. They retreated to the 20 day SMA and bounced higher

-- Prices are still in a downward sloping channel

-- Remember the bearishness of the news over the last few weeks. We've learned the nation as lost over 1 million jobs in the last three months. Retail sales were weak. The auto industry is in deep trouble. If it falls the unemployment situation would worsen fast. And yet, the market has not cratered as bad as possible.

Let's add a few more charts.

Photobucket

The MACD has been rising for the last two months indicating momentum is changing

Photobucket

As has the On Balance Volume. This tells us that money is flowing into the market

Let's add a few more charts to complete the picture

Photobucket

The NY Advance/Decline line is rising

Photobucket

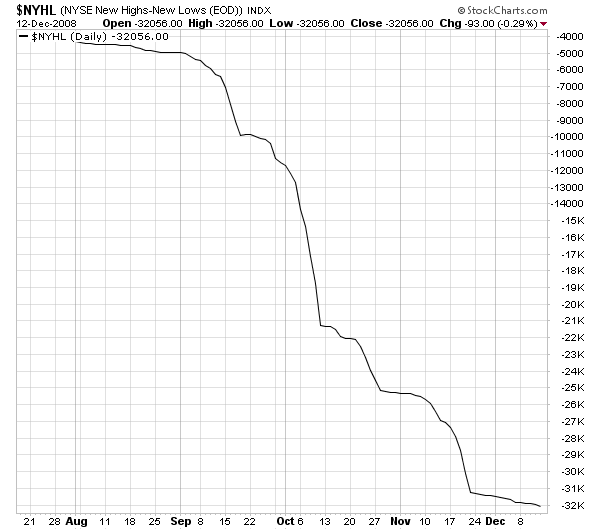
And the downward slope of the NY new high/new low line is lessening

Photobucket

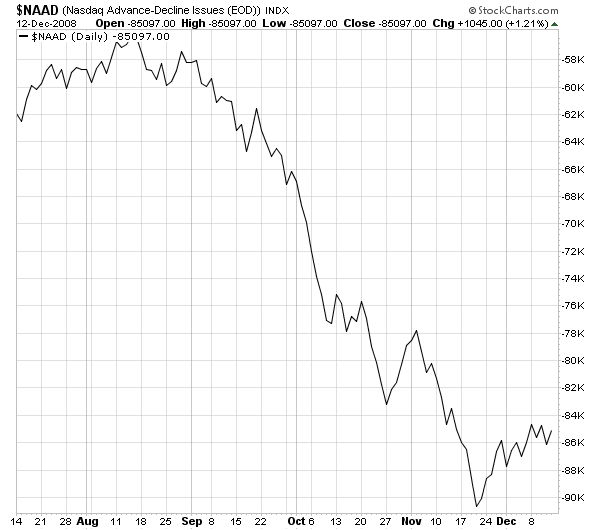
The NASDAQ advance/decline line is also rising and

Photobucket

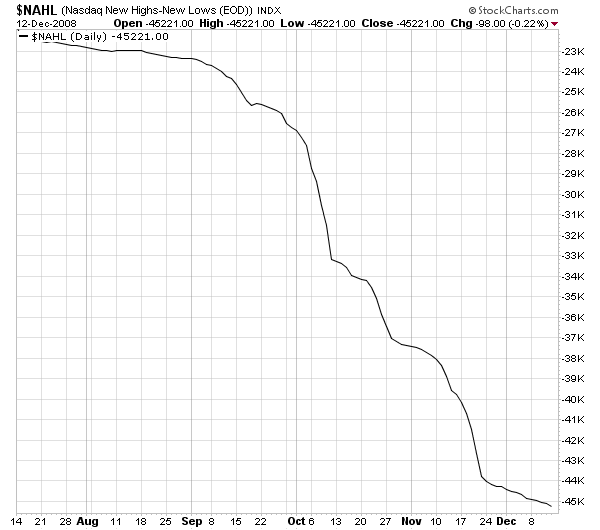
The NASDAQ new high/new low line is declining at a slower rate

So -- what does all of this tell us?

The markets have reacted surprisingly well to incredibly bearish economic news. This tells us traders are priced in a fairly downbeat scenario. At the same time, the market internals are improving. This tells us the market wants to pull out of its downward slump.

My personal big concern is the downward sloping trend channel. Until prices move out of that I'm concerned.