Friday, August 1, 2008

Weekend Weimar and Beagle

It's the end of the week. Go and think about anything except the markets. I'll be back on Monday. Until then....


Somehow this is comfortable


The girls totally crashed.

Employment Report Stinks

From the BLS:

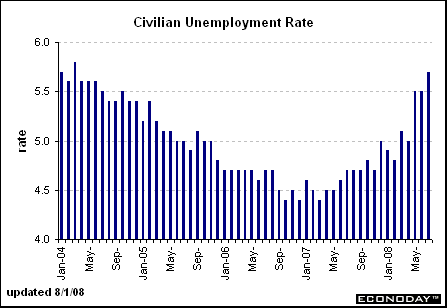
Both the number of unemployed persons (8.8 million) and the unemployment rate (5.7 percent) rose in July. Over the past 12 months, the number of unemployed persons has increased by 1.6 million, and the unemployment rate has risen by 1.0 percentage point.


Great news, huh? It gets better...

In July, the number of persons who worked part time for economic reasons rose by 308,000 to 5.7 million and has risen by 1.4 million over the past 12 months. This category includes persons who indicated that they would like to work full time but were working part time because their hours had been cut back or they were unable to find full-time jobs.
So, instead of getting fired, we'll just get people to work less. That means lower overtime payments and it also might mean a cut in benefits. however, because the overall employment situation is weak, these people have a harder to getting a second job. That means they have to make do with less pay.

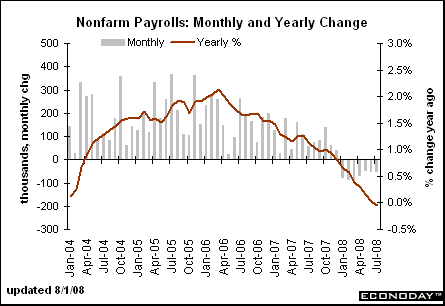
There are no bright spots in the jobs created areas of the report. There are only three sectors of the job market that created jobs: government employees, healthcare/education and leisure and hospitality (which added a whopping 1,000 jobs). In other words, unless you work for the government or take care of sick people you're out of luck.

And the year over year number continued to drop:


And the unemployment rate continues to increase:

The Detroit Death March

From Bloomberg:

General Motors Corp., the largest U.S. automaker, reported a second-quarter loss of $15.5 billion because of strains from truck leases, costs from labor disputes and plunging U.S. sales.

......

The mounting losses are siphoning resources Chief Executive Officer Rick Wagoner, 55, needs to develop fuel-saving cars to replace the pickup trucks and sport-utility vehicles being abandoned by U.S. buyers. Wagoner, now in his 9th year as CEO, won't project when GM will restore profit as he cuts costs by an additional $9 billion annually and carries out a plan to boost cash by as much as $17 billion.

``The trends that are out of their control, those are the things that have the potential to overwhelm them,'' Robert Schulz, a debt analyst at Standard & Poor's, said yesterday. He was referring to record gasoline prices that have transformed consumer behavior while a weakened U.S. economy drains auto sales to 15-year lows. ``We don't see the macro environment anywhere near on the mend,'' Schulz said.

.....

S&P yesterday cut GM's credit rating one level to B-, or six steps below investment grade, because falling U.S. sales are causing the automaker to use more cash than anticipated. With the U.S. auto slump expected to carry into next year, GM faces a risk of further cuts, Schulz said. GM had the highest rating, AAA, from 1953 until 1981.
Declining sales, increasing impairment costs and a drop in its credit rating. What great news. It couldn't get much better.

The real question is cash flow. This is the second time I've seen a news story that said the real concern was GM is burning cash faster than anticipated. As a result, their ability to fund the turnaround is inhibited. For the quarter ended March 31, they burned through $3.2 billion in cash. They also had $28.9 billion in cash and short term investments. At that pace and all other things being equal, they've got 9 quarters of cash on hand. If we add in $9.6 billion in receivables, then we increase their available cash to 12 quarters or three years. In addition, with the drop in their credit rating borrowing for that will be more expensive. And who will want to lend money to a company that has negative book value and stagnant sales?

Forex Fridays -- the Dollar


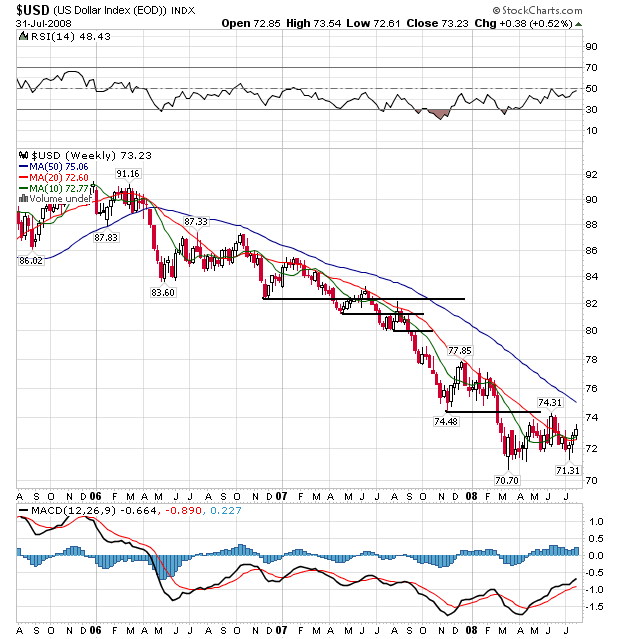
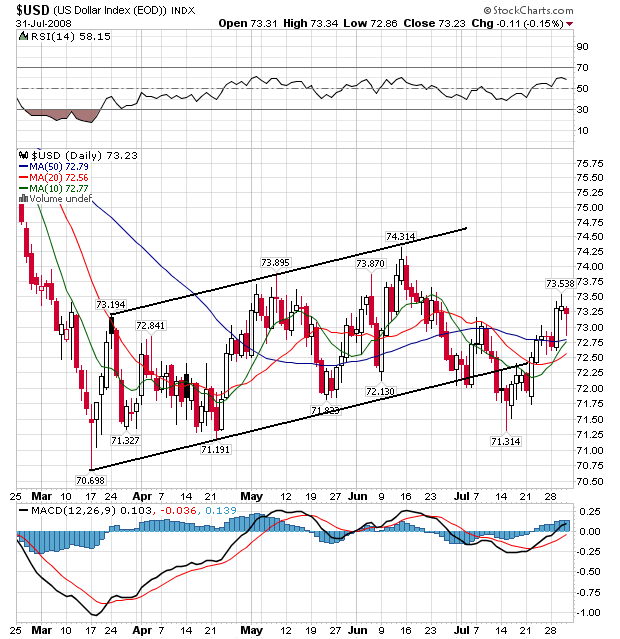
Is the bottoming continuing? On the weekly chart, notice the dollar has been in a decline for the last two years. Prices have continually moved lower, breaking through technical support and then consolidating those losses before moving lower still.

However, over the last 4-5 months, the dollar has moved sideways. While it hasn't rallied, it also hasn't moved lower -- and there has been plenty of reason for it to do so. I've seen several analysts on TV suggesting the long-term bear market is over and that it is time to buy dollars.


On the daily chart, notice there is a slight upward tilt to the last few months of price action. While this isn't a strong rally, it's also not a bear market situation either. However, also note that prices and SMAs are in an extremely jumbled position. They are close together, and have been that way for the last three months. In order for this to turn into a bullish chart the SMA picture has to become clearer.

Thursday, July 31, 2008

Today's Markets


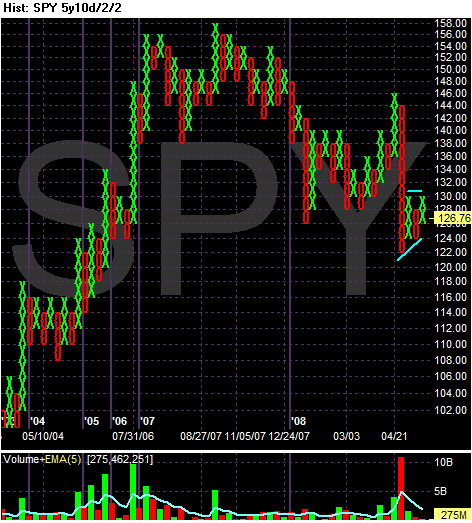
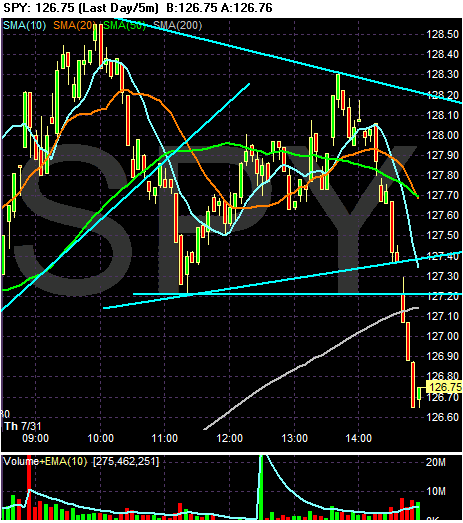
There was a lot of back and forth in the market today until about 2:30. The markets opened with a move higher, but then fell back starting about 10:00. Prices moved back to the opening level and them moved higher. However, about 1:30 prices retreated again. Note they didn't get quite up to the 10:00 AM level. Then they retreated again. I've drawn what could be the bottom line of a triangle formation -- it sure looks like it wants to be a triangle, doesn't it? Prices gapped lower with about 20-25 minutes left in the day and prices closed near lows for the day.


On the 4 day chart (the chart of the week's action so far), notice that prices have been rising since the opening on Tuesday. But today they broke trend and are now consolidating in a sideways move.


On the PAF chart, notice the triangle that is forming after the long downward move. Basically, the market is waiting for the next news item to move it one direction or the other.

GDP Disappoints

From CNBC:

The Commerce Department reported Thursday that gross domestic product, or GDP, increased at an annual rate of 1.9 percent in the April-to-June period. That marked an improvement over the feeble 0.9 percent growth logged in the first quarter of this year and an outright contraction in the economy during the final quarter of last year.


Remember this number is heavily influenced by the rebate checks that went out in the second quarter. Here's how the BEA noted the big changes:

The acceleration in real GDP growth in the second quarter primarily reflected a larger decrease in imports, an acceleration in exports, a smaller decrease in residential fixed investment, and an acceleration in PCE that were partly offset by a larger decrease in inventory investment.


So, we're importing less (which probably means the price of oil really started to hit) and exporting more (thanks to the cheap dollar). Exports have been and will continue to be one of the bright spots of the economy as we go forward. They are the one saving grace from the dollar's long drop.

I'm particularly interested in personal consumption expenditures because these would be the biggest beneficiary of the stimulus checks that went out. These increased 1% in 4Q07 and .9% in 1Q08. They increased 1.5% in 2Q08. In other words, we saw a bump up from the checks.

PCEs contributed 1.08 to the 1.9% increase. However, this number was .67 in the 4Q07 and .61 in 1Q08. So using the highest of the preceding two quarters numbers as a proxy for the non-stimulus contribution rate we would we a 1.49% rate of growth for the overall economy, all other things being equal in the current report.

Also note the BEA made downward revisions to the 2005, 2006 and 2007's total GDP. That tells me there may be further downward revisions coming, does a very important revision within the numbers:

Annual benchmark revisions showed consumer spending slowed more than previously estimated and the housing slump worsened. The economy shrank 0.2 percent in the fourth quarter last year, compared with a previously reported 0.6 percent gain.


In other words, the beginning of the recession was probably sometime within that time.

The Detroit Death March

I have a pet theory that before all of this is over we're going to see the following: at least one Detroit bankruptcy, at least one airline bankruptcy and several large banks go into bankruptcy. My feelings about this are based on the complete stupidity of Detroit executives. Oil started to move up in mid-2004 after establishing a long, multi-year base.


This alone should have raised some eyebrows and sounded the alarms. But this wasn't all. At the same time, the US was invading Iraq adding to middle eastern turmoil, China and India were growing at strong clips (Russia wasn't that far behind) and there was talk everywhere of the global commodities boom. By this time Toyota had introduced the Prius which has now sold over 1 million cars indicating there is a strong demand for energy efficient vehicles. Yet Detroit continued giving us the Hummer and various other forms of inefficient vehicles. Bottom line, Detroit is full of idiots who deserve to fail. And fail one of them will.
Consider this news about Chrysler over the last few days:

From Reuters:

Fitch Ratings downgraded Chrysler LLC's debt further into the junk category and warned that the struggling U.S. automaker could face difficulties in financing unless U.S. auto sales recovered in 2009.

Chrysler, which lost $1.6 billion in 2007, could struggle to finance operations in the second half of 2009 if industry volumes remained at this year's depressed levels or dropped further, according to a Fitch report released on Tuesday.

Fitch, which cut Chrysler's ratings from B- to CCC, just two notches above default, said the decision last week by Chrysler's finance arm Chrysler Financial to stop financing vehicle leases for U.S. consumers would depress already sluggish sales.

It rated Chrysler's outlook as negative, indicating a further rating cut is likely in the next six months.


Considering how easy it is to buy good credit ratings from the ratings agencies (CDO, anyone?), the fact that Fitch has downgraded debt to these levels should tell you how bad things have gotten.

From the WSJ:

Chrysler LLC is scrambling to slash costs and line up partnerships with foreign auto makers to shore up its finances amid a painful downturn in sales and a deteriorating outlook for the company, people familiar with the matter said.


In other words, Chrysler's debt is near worthless and they're scrambling to cut costs. But they're not alone.

Consider GM. They've lost money three years in a row. More importantly, their book value (total assets - total liabilities) has been negative for the last two years. Their sales record is inconsistent (at best), and their cash flow is weak. In short, this is a terribly run company. And the stock chart shows it:


That's a chart that inspires confidence, isn't it?

Ford isn't much better. Their book value has been moving around 0 for the last three years. Their sales record is inconsistent. About the only good thing about this company is they have had a positive cash flow for the last three years. But their chart is terrible as well:


So -- why is all of this important? Because as these companies continue to flounder, I'm expecting either GM or Ford or both to hit Congress up for money. Ford has 229,000 full-time employees and GM has 266,000 full time employees. I don't have a break down of their geographic location. Let's assume at least half of them are somewhere in the US. That means 247,500 are US based. There will also be a great call for the need to help an American icon out. Plus -- Congress did it before with Chrysler and it worked out just fine. Finally, the Federal Reserve back-stopped the Bear Stearns deal, so why not the car industry?

Thursday Oil Market Round-Up


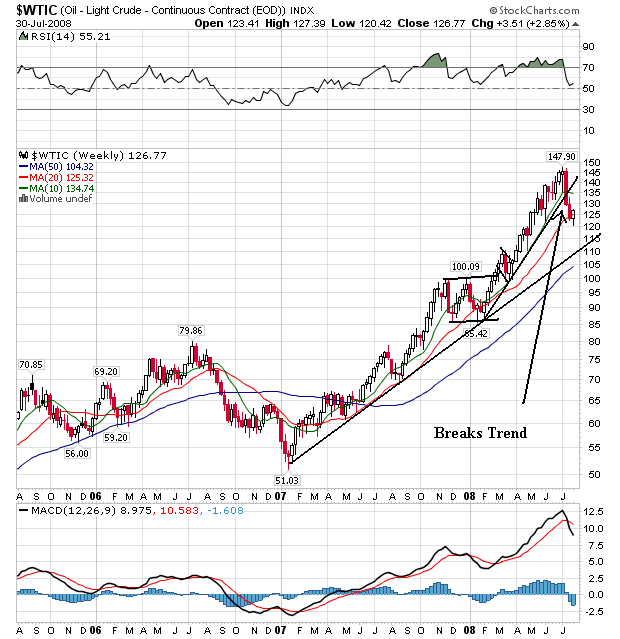
On the weekly chart, we can clearly see the bull market run that started in early 2007. Prices continued to move higher, breaking through resistance levels and then consolidating gains. There are two legs to this rally. The first occurred throughout 2007. This one ended with a sideways rectangle consolidation pattern that lasted about three months. The second move came during 2008. But that move is over. Notice that prices have broken through the trend line that supported the 2008 rally. Prices now stand at the 20 week SMA.


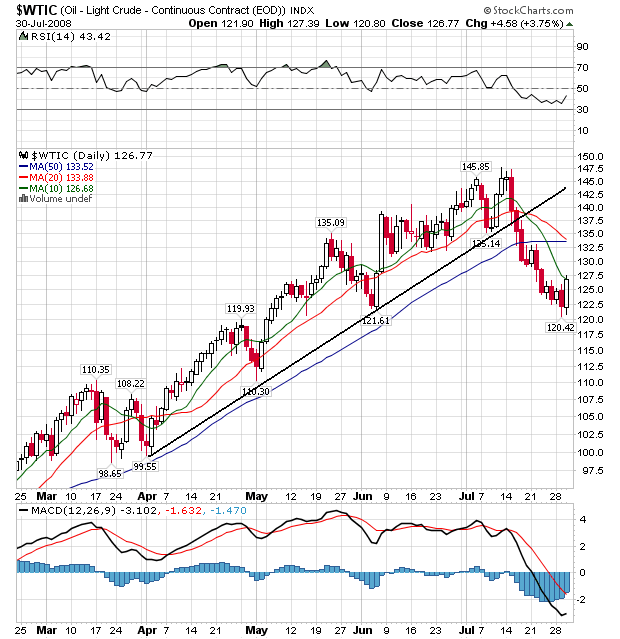
On the daily chart, notice the following:

-- Prices have broken the support line

-- The 10 and 20 day SMA are moving lower

-- The 10 day SMA has moved through the 50 day SMA, and the 20 day SMA is about to

-- The 50 day SMA is leveling off

-- Prices are below all the SMAs

This chart is now short-term bearish and longer term neutral.

Wednesday, July 30, 2008

Today's Markets


The markets opened higher, then moved sideways to the 10 minute SMA. They rallied agian, but then started a very slow and gradual descent that led to the formation of a double bottom. The first bottom occurred around noon and the second one occurred around 1. Then prices spiked higher on a strong volume surge, moving through all the SMAs. Prices then traded sideways until a bit after 2 when they again spiked higher on a volume surge.


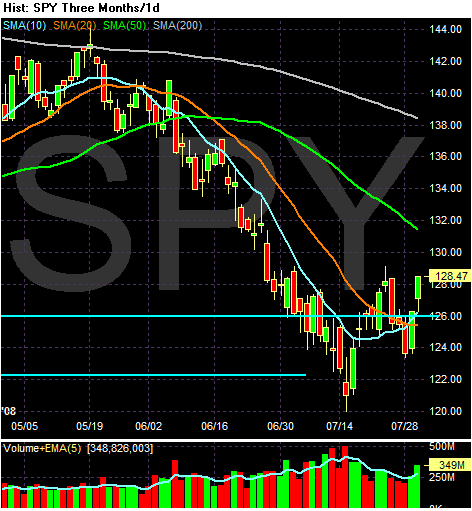
On the daily chart, notice the following:

-- The 10 day SMA has moved through the 20 day SMA

-- The 10 day SMA is moving higher

-- Prices are above the 10 day SMA

This means the short term trend is positive

However

-- Prices are below the 200 day SMA

-- the 20, 50 and 200 day SMA are all moving lower

-- With the exception of the 10 day SMA, all the SMAs are moving lower.

The long-term trend is negative.

The Credit Crisis is Far From Over

From Bloomberg:

The Federal Reserve extended its emergency lending programs to Wall Street firms through January after policy makers judged that markets are still ``fragile.''

The Fed also plans to give securities dealers options for tapping one of the loan programs to ensure financing through the ends of quarters, when funding needs can jump. Commercial lenders will be able to borrow from the central bank for a longer period, and the Fed boosted its swap line with the European Central Bank.

Today's action reflects continued financial turmoil, with premiums banks charge each other for three-month funds over the Fed's expected benchmark rate little changed since May. It's the latest step in officials' efforts to combat the yearlong credit crisis, after the Fed's March rescue of Bear Stearns Cos. and the Treasury's backstop for Fannie Mae and Freddie Mac this month.

``The U.S. is pulling out all the stops here to make sure we don't have a terrible downturn or a collapse in the financial system,'' said Allen Sinai, chief global economist at Decision Economics in Boston. ``There isn't anything else the Federal Reserve can do but to keep pumping liquidity into the system.''

The Primary Dealer Credit Facility for direct loans to securities firms and the Term Securities Lending Facility for loans of Treasuries, both begun in March, will now extend through Jan. 30. They would then be canceled if the Fed judges that markets ``are no longer unusual and exigent,'' the Fed said in a statement today in Washington.
And yet, we still have people calling for a bottom in financial shares. Folks -- this ain't over by a long shot.

Think About This....

I've seen this blurb on Bllomberg several times.

We've seen about $450 billion of writedowns in the financial sector.

About 85%-90% have come from the US and Europe.

Either:

1.) Asian banks were really smart and avoided this altogether, or

2.) We've got some problems to look forward to.

Wednesday Commodities Round-Up; Agricultural


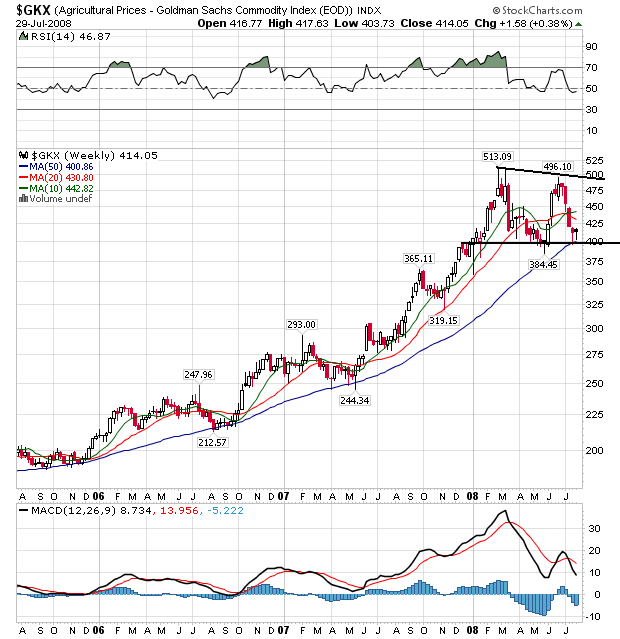
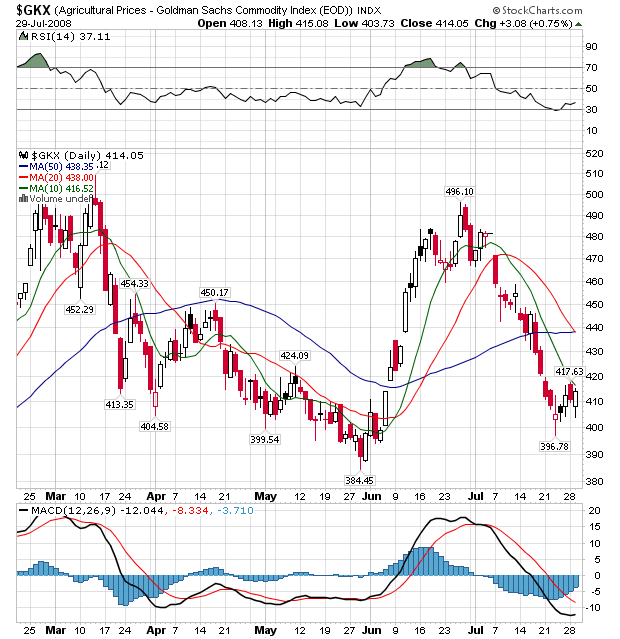
The last few times I have posted this chart, I have speculated it was forming a double top. While this is still looking like a strong possibility, there is also the possibility that prices are consolidating in a rectangular/triangle top. We won't know until we see prices break up or down. However, the good news from an inflation perspective is that prices have at least stopped their upward move and are consolidating.


On the daily chart notice the following:

-- Prices are below all the moving averages

-- The 10 day SMA has crossed below the 50 day SMA

-- The 20 day SMA is about to cross over the 50 day SMA

-- The 10 and 20 day SMA are both heading lower.

The SMA picture is bearish, but for this chart to turn completely bearish, we need to see a strong break below the low point between the double tops -- roughly 400 or so.

Wednesday Commodities Round-Up; CRB


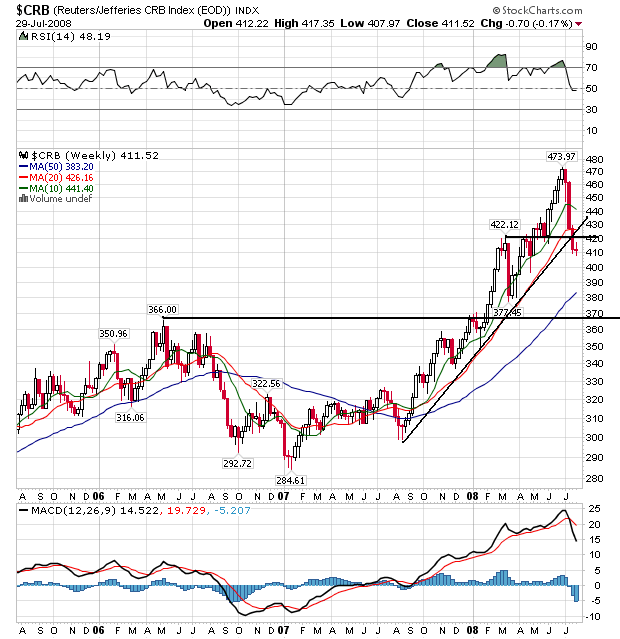
On the weekly chart, notice the CRB has been in a rally since the end of last summer. Prices have continually moved higher, broken through key resistance areas and then consolidated gains after moving higher. However, prices dropped hard starting in July of this year. This is thanks to a variety of commodities dropping.


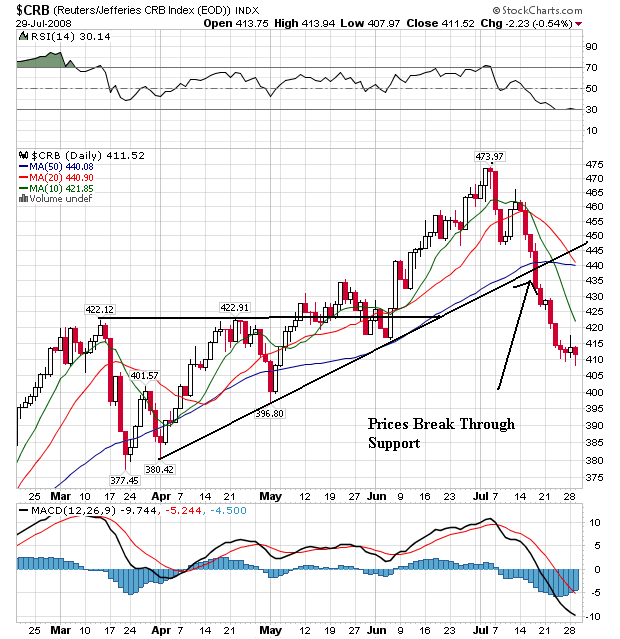
On the daily chart, notice the following:

-- Prices have dropped through the support line that started at the beginning of April

-- Prices are below all the SMAs

-- The 10 day SMA has moved below the 50 day SMA

-- The 20 day SMA is about to move below the 50 day SMA

-- The 50 day SMA is turning negative

-- Over the last 5 days, prices have leveled off

This chart is turning (or is) bearish now.

Tuesday, July 29, 2008

Today's Markets


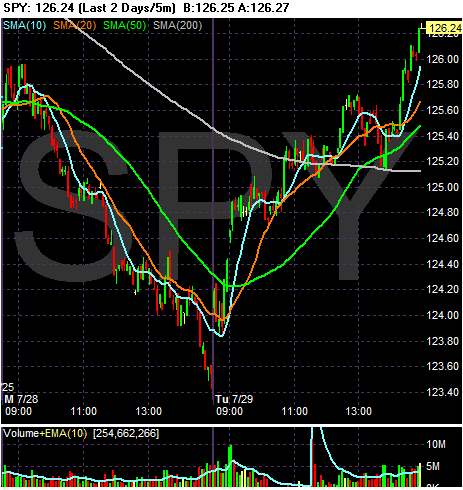
The markets gapped up at the opening and then dropped a touch until they hit the 10 minute SMA. Then they shot higher from 124 to 128.80. Prices traded sideways until they hit the 50 minute moving average a little before 11 AM and then shot higher again. Prices consolidated until noon when prices once again hit the 50 day SMA and shot higher. From 1 to about 2 prices moved lower until they hit the 200 day SMA and then prices moved higher again, closing near the high of the day on strong volume.

This was an incredibly strong day, completely wiping out the losses from yesterday. And just think -- all this happened on the day Merrill Lynch announced a fire sale of assets....

Treasury Tuesdays

Sorry for taking so long to get to this. There were some other stories that I thought were a bit more important.


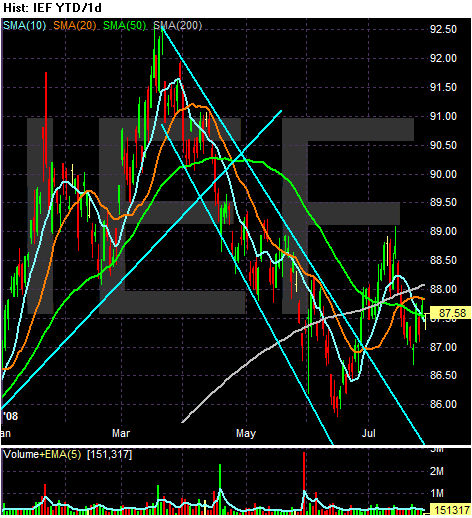
On the 6 month chart, we see the ned of the year long rally that ended at the end of March. Money flowed into treasuries because they are attractive during economically difficult times. However, when the Fed back-stopped the Bear Stearns deal, it signaled the Fed would take a far more aggressive role in preventing a financial meltdown. So money flowed back into the stock market and out of treasuries. Hence the price drop from the end of March to mid-June.


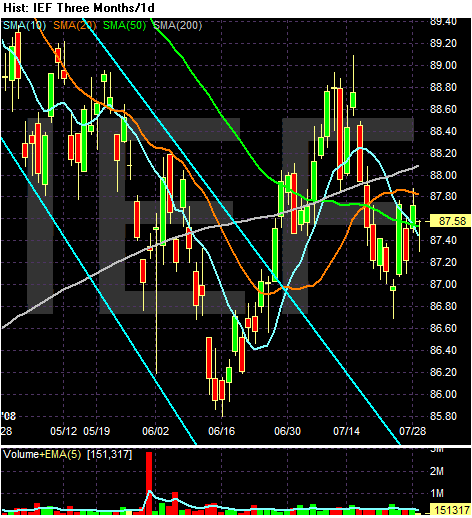
The three month charts shows the latest action, which has come conflicting signals.

-- Prices rallied from mid-June to mid-July, but they have backed off since then.

-- Prices are below the 200 day SMA, but not by much

-- Prices and the other SMAs are bunched together big time, indicating a complete lack of direction from the bulls and the bears.

The Housing Crisis is Far From Over

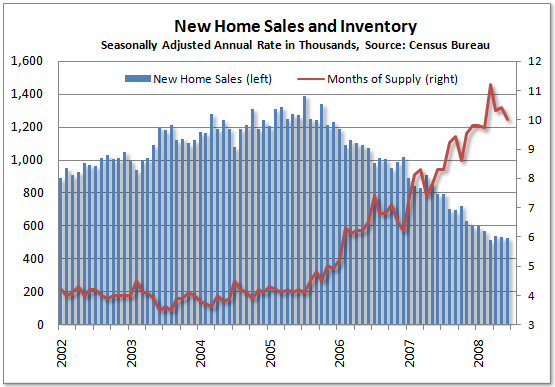
The Mess That Greenspan Made had some interesting charts up last week that got me thinking. First, here are the charts:


On both of these charts, note that the pace of sales as stabilized. In the case of new homes for a few months and in the case of existing homes for about 10 months. So, do these charts mean the housing market is starting to stabilize? Not yet:

This graph is from Calculated Risk:


So long as prices are in free fall (or cliff diving) we're nowhere near out of the woods.

The Credit Crisis is Far From Over

From Bloomberg:

Merrill Lynch & Co., the third- biggest U.S. securities firm, will sell $8.5 billion of stock and liquidate $30.6 billion of bonds at a fifth of their face value to shore up credit ratings imperiled by mortgage losses.


Note the phrase: Merrill is selling their bonds for a fifth (that's 20%) of their face value. Can you say fire sale? Or -- and here's the really scary part -- is that what things bonds are actually worth on the open market? Is this the best deal that Merrill can get for them?

Those figures alone should tell you there are some serious problems out there -- as ini systemic issues that will not be easily resolved.

Let's add one more Tums inducing statement. There was a blurb on Bloomberg a few days back that showed where these writedowns were coming from. About 90% are from the US and Europe, with about 10% (roughly) coming from Asia. Think about that for a minute.

Finally, go to the Big Picture right now and read this story and this story. Barry lays it out as only he can.

Treasury Tuesdays

I'll hit the charts later today. For now, consider the following:

From the WSJ:

Projections suggest the federal budget deficit could exceed $500 billion next year, complicating the debate between Barack Obama and John McCain over how to strengthen the economy while not worsening the nation's finances.

Deficit projections are ballooning because of lower tax receipts and government spending on economic-stimulus programs. The gap increasingly is threatening to play havoc with the two presidential candidates' domestic-policy plans, particularly Sen. McCain's big tax cuts and Sen. Obama's promised health-care expansion, and could force major changes in the winner's agenda.

On Monday, Sen. McCain, the Republican candidate, sought to turn the new deficit numbers to his short-term political advantage, without conceding much to those longer-term realities. Democratic rival Sen. Obama sought to keep the focus on the current shaky economy, economic inequalities and worries over job and retirement security.

The sparring came as the White House budget office boosted its estimate of the federal deficit for fiscal 2009 to $482 billion. With the full costs of the wars in Iraq and Afghanistan added in, the deficit for 2009 likely would exceed $500 billion, analysts said. The deficit projection for 2008 fell somewhat from the last official estimate in February, to $389 billion from $410 billion. Fiscal 2008 ends Sept. 30.
Expect to hear more of these stories come out as the economy worsens.

I wrote an article a few weeks back called My Conversation With the Next President. In the article I highlighted the basic problem the next president faces. Here is the short version. The Bush administration has mis-managed the federal budget situation to an alarming degree. Although they inherited a budget surplus, they have continually spent more then they have taken in. As a result, the US is issuing debt like its going out of style. Total debt outstanding has increased from $5.8 trillion in 2001 to the current total of $9.5 trillion.

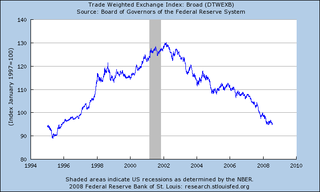
As a result of this problem, the currency markets have sent the dollar lower for six years straight.


If you were wondering why commodities in general and oil specifically have bee rallying for some time, you can thank the cheap dollar as a primary cause. While a stronger dollar alone would not solve the problem of expensive oil, it would definitely help. Consider the dollar chart above. Note it has gone from peak to trough from 130 to its current level of $72.75 -- or a drop of 44%. Also note that most world commodities (like oil) are priced in dollars. As the dollar has dropped in price, so have these commodities. One of the primary reason traders are bidding them up is as an inflation hedge. While that appears to have waned for now, the damage has already been done in the form of higher prices being passed on to the consumer.

And that's not all. The US has been issuing a ton of debt every year during the good economic years. This means that going into the bad years we have a ton of more debt on our books and a culture of not making the tough political decisions (like, for example, raising taxes on the upper-income levels to help pay for a war). As a result, the US is entering a period of economic hardship with both hands tied behind its back.

Theoretically, a government should help to mitigate the effects of a recession with increased spending on programs like unemployment insurance extensions, job retraining, tax credits to start new economic sectors and the like. This goes a whole lot better if the government managed the budget well during the times of growth. However, the US has not done that. Instead, we have loaded up the federal government with a large amount of debt which has helped to devalue our currency which is increasing inflation. Issuing more debt will add further downward pressure on the dollar adding to the current inflationary pressures. In short, doing what the government should do during this time is exactly what the government has been doing for some time and it has led to problems.

It's not a pretty picture, is it?


Monday, July 28, 2008

Today's Markets


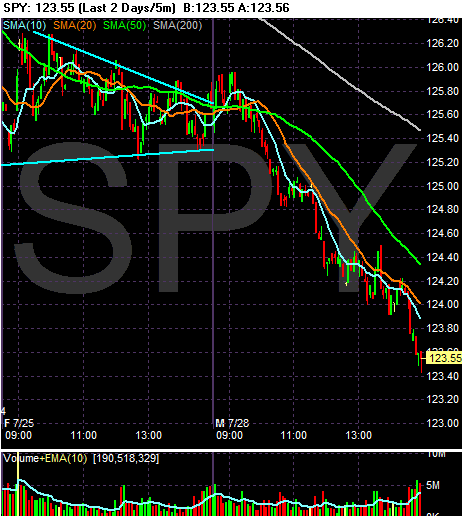
The markets opened with a quick upswing but couldn't maintain momentum. Prices started to drift lower after 9 AM, slowing falling below all the SMAs. Around 10 AM prices took their first big downward tumble, moving from 125.40 to 125. Then prices moved sideways until they hit the 20 minute SMA a bit after 11 AM, again moving lower. They hit 124.40 about noon and moved sideways with a slight downward bias until about 25 minutes before closing. Then they dropped hard in increasing volume until the close.

Notice the market continued to move lower, breaking through key support levels until they hit the low point near the close. Today was entirely bearish, plain and simple.

It's looking as though the bloom may be off last week's rally.

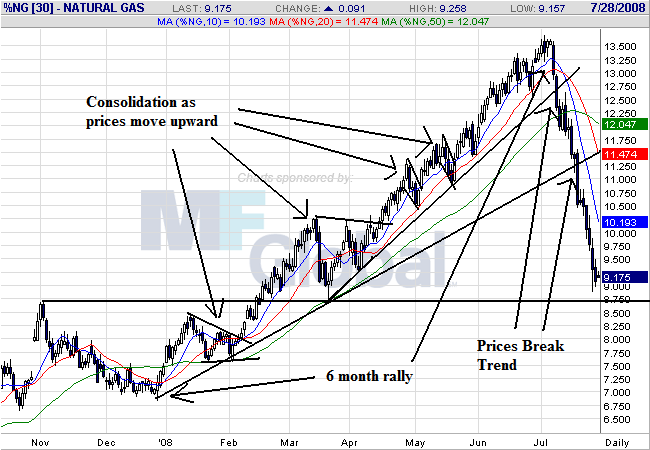
Natural Gas Dropping


IBD highlighted the above chart on their front page today. It's very interesting. Notice the following:

-- Prices were in a confirmed and strong uptrend from the beginning of 2008 to early July. Prices kept moving higher, breaking through resistance and consolidating gains. For two periods of time, the SMAs were aligned in the most bullish way imaginable: shorter SMAs above longer SMAs, prices above all the SMAs and prices using the 20 day SMAs as technical support.

-- Prices dropped hard after the first week of July. By mid-July prices were below the 50 day SMA (and all other short-term SMAs). Prices have dropped about 30% since early July. This is in line with the drop we've seen in the oil market.

From an inflationary perspective, this is incredibly good news. Energy inflation has been a driving force of rising prices over the last year or so, so any relief is welcome.

Earnings Lackluster

From IBD:

Halfway through earnings season, banks are still a drag, tech firms are doing OK while the overall outlook remains cloudy.

With 249 of the S&P 500 companies reporting results, second-quarter profits are on track to decline 17.9% vs. a year earlier, according to Thomson Reuters.

"I'd rate (earnings so far) as pretty bad," said Sam Stovall, chief investment strategist at S&P Equity Research. S&P forecast a 10% drop at the start of the quarter but now sees about a 20% shortfall, he said.

Financial firms' profits are forecast to dive 85%. The consumer discretionary sector, including automakers and home builders, also is a big loser.

But excluding banks, S&P 500 earnings should rise a respectable 7.7%, Thomson Reuters said.


IBD makes a solid point -- that earnings are bad and then (again) tries to spin furiously. They mention that without financial firms things would be better.

1.) We already knew that. Thanks.

2.) Let's just not report any bad news -- or take out those parts of the statistical analysis that in some way skew numbers negatively. Then everything will be OK! This is garbage, plain and simple. If you don't like a number, too bad. In order to properly analyze the numbers we must look at all the numbers dispassionately and (hopefully) without bias. This is right out of the Business and Media Institutes's method of reporting business news -- ignore bad news; only report good news.

3.) If we were talking about a really tiny sector to the economy then ignoring the earnings reports would be prudent. But this is not a small sector to the economy. In fact, it's one of the most important areas of the economy because it provides the lubrication (in the form of money and credit) for the rest of the economy. Therefore their earnings are incredibly important and must be taken very seriously.

Market Monday's

Let's take a look at the charts to see where we are.


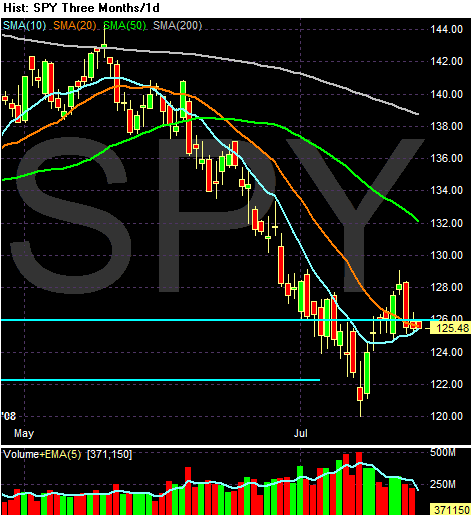
For all the craziness from last week, we would up pretty much where we started. The markets were in a downward sloping channel on Monday and rebounded on Tuesday with a strong rally at the end of the day. The rally continued on Wednesday as the market consolidated in a triangle pattern, but prices fell hard on Thursday. Finally on Friday we see a triangle consolidation at the bottom. Sure seems like an awful lot of energy to get nowhere, doesn't it?


On the daily chart, notice the following

-- Prices have clearly bounced off the bottom. The question now is do they have the momentum to continued upward?

-- The 10 day SMA is about to cross over the 20 day SMA

-- The 20, 50, and 200 day SMA are still heading lower

-- Prices are using the 10 day SMA as technical support.

I would say the short-term trend is bullish so long as prices stay above the 10 day SMA. If prices fall below that level then we move into neutral/bearish territory.