Friday, December 21, 2007

Weekend Weimar and Beagle

The markets are closed and I have a lot of work to do this weekend. So --

don't think about the markets for today and tomorrow. I'll write an analysis of last week's markets on Sunday afternoon or early Sunday evening.

Until then, here are the kids, Kate and Sarge on the Weimar couch. Sometimes they even let me on the couch.


And here is the future Mr$. Bonddad's Beagle Scooby with some of here favorite toy's (and mine too).

A Closer Look At the Financial Sector

We've seen some interesting developments in the financial sector over the last few weeks. The primary development has been cash injections from foreign investors. This isn't the first time we've seen this happen. Citigroup was a beneficiary of this trend a bit ago. However, these cash injections haven't done a great deal for the financial sector.


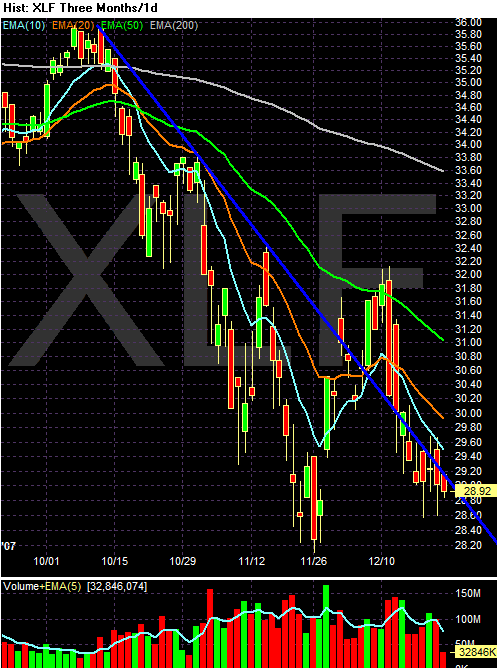
The XLF ETF is still clearly in a downtrend. Note that

-- prices are 16.5% below the 200 day SMA.

-- prices are below all the moving averages

-- all the movings averages are heading lower

-- prices are still centering around the long-term downtrend.


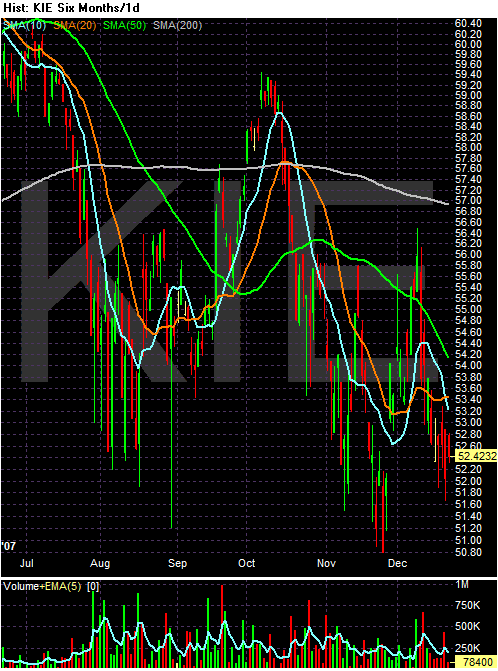
The insurance sector isn't in the best shape either. Notice

-- prices are 7.8% below the 200 day SMA

-- the shorter SMAs are below the longer SMAs

-- all the SMA are headed lower


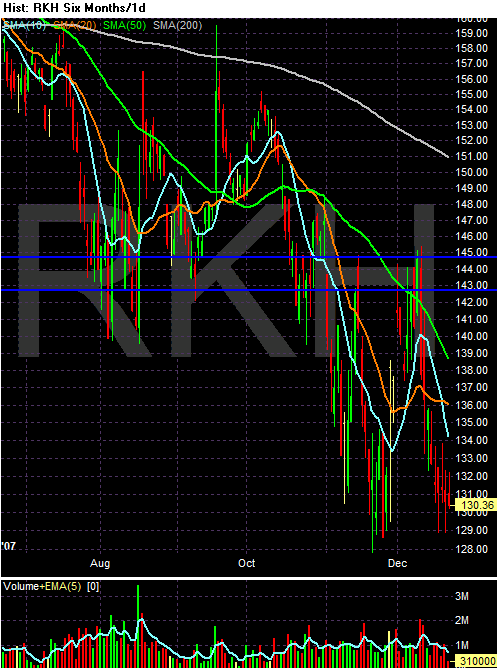
Regional banks are in the same boat

-- prices are 13.66% below the 200 day SMA

-- prices are below the moving averages

-- all the moving averages are moving lower


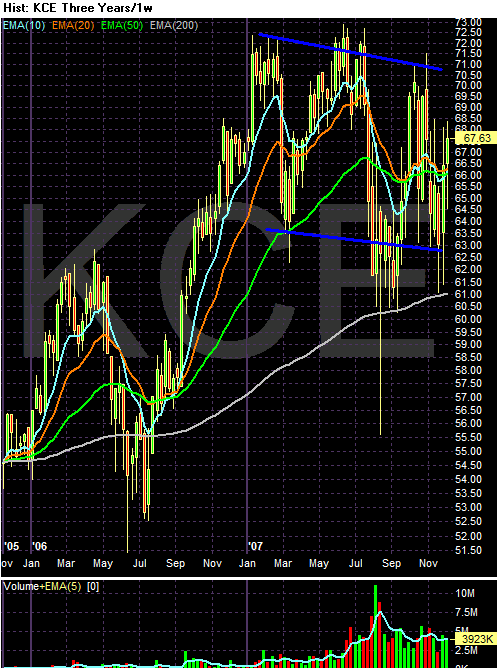
The capital markets long-term chart shows the industry in a downward slanting consolidation pattern


The six month chart shows

-- prices are hovering around the 200 day SMA

-- the shorter SMAs are below the longer SMAs, but

-- the SMAs are bunched up, meaning this segment of the market is looking for direction.

The only chart that looks good is the capital markets sector -- and that's an extremely relative term. That sector looks good because all the other sectors look pretty terrible. In short, this sector is still in terrible shape.

Short Term Treasuries Still Rallying

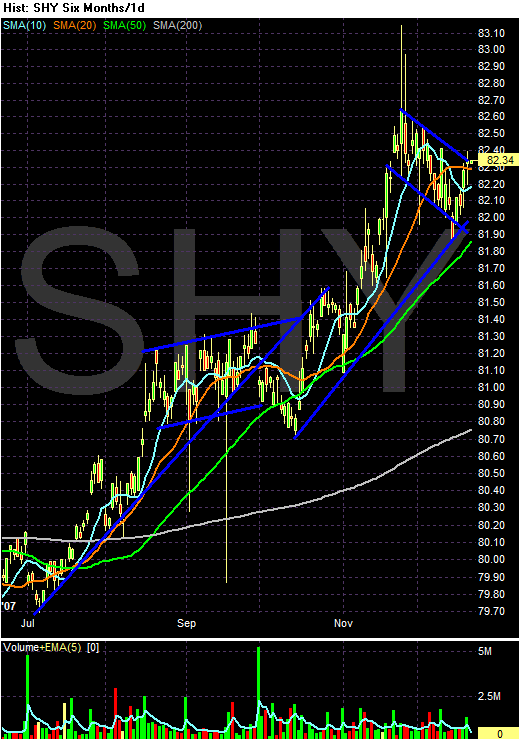
Bonds are considered a safe haven investment -- which means when times get crazy, people flock to bonds. Here is a six month chart of the short-term Treasury market (1-3 years) which clearly illustrates this point.


Over the last six months, this part of the Treasury curve has been in a clear bull market. The index rose from July through August, then consolidated for September. It sold off briefly at the beginning of September, but has rallied since.


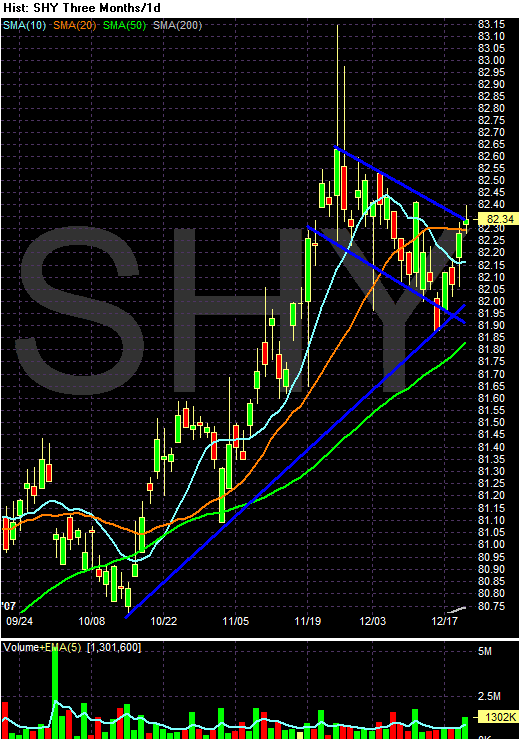
On the three month chart notice the index is clearly in a bull market pennant/flag pattern and is on the verge of breaking out of this for another upward run

Unlike stocks which theoretically have unlimited upside potential, bonds are constrained by interest rates. There is also the issue of inflation, which lowers the value of fixed income payments. With inflation increasing it seems bond prices would be selling off right now. But the trouble in the mortgage and commercial paper market is providing bullish "safe haven" stimulus. And the bad news in the mortgage market is continuing. This week alone, we've had bad news from Morgan Stanley, Bear Stearns and now news today that Merrill Lynch may have further writedowns in their mortgage portfolio. And while the latest liquidity injection by the ECD and the Fed help, they haven't solved the problem:

The latest massive maneuvers by the Federal Reserve and European Central Bank have had the desired calming effect on money markets. But as those central banks acknowledge, the moves haven't eliminated the threat from a cascade of bad news from financial firms, worries about more bad news to come and the likely impact of falling U.S. housing prices.

The most visible indicator of persistent bank reluctance to lend to each other -- plus the reluctance of money-market mutual funds to lend to banks for more than a few days -- has been that banks are paying unusually high rates for short-term loans, compared with the target the Fed and ECB set for overnight loans.

The central banks have "alleviated a lot of the train-wreck fears about year-end," says Lou Crandall, chief economist at Wrightson ICAP, a New York bond-research firm. While the central banks' actions are temporary -- extending only through January -- "it buys us more time, which is the only thing that's going to resolve this."


So far, safe haven investment status has trumped inflation. There is also a thought moving around the markets that inflation is being stoked by supply problems in the commodities markets, thereby limiting the inflation is increasing argument which should be bearish for bonds.

So, we basically have a sentiment tug-of-war going on in the bond market. The bulls are relying on safe haven status while the bears are pointing in increasing inflation pressures. Who will win? Who the hell knows at this point.

Thursday, December 20, 2007

Today's Markets

Finally! The charts are starting to make sense.


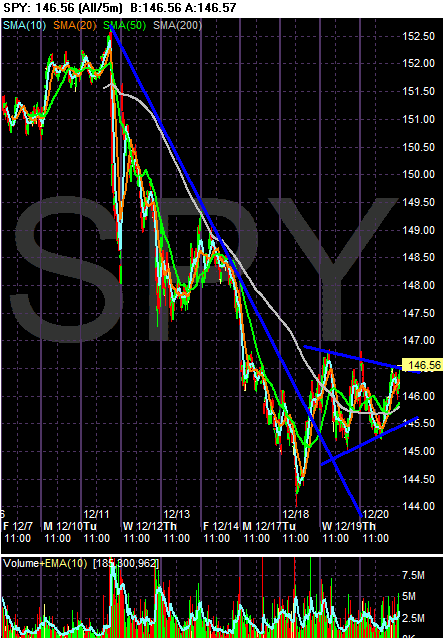
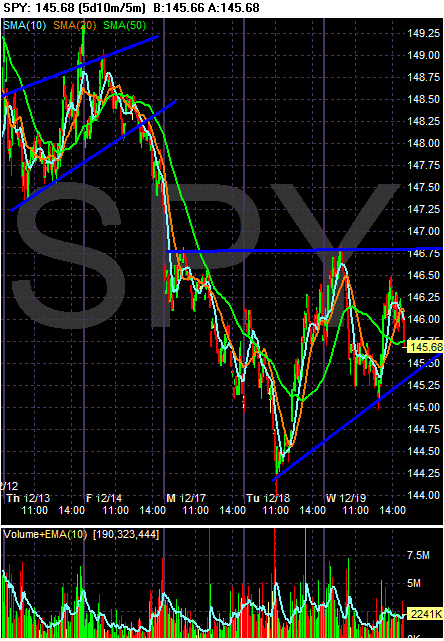
On the 10 day, 5 minute SPY chart, note the market has been selling off for the five days after the Fed's policy action (or inaction as the market saw it). However, the market bottomed two days ago and has since been forming a triangle consolidation pattern.


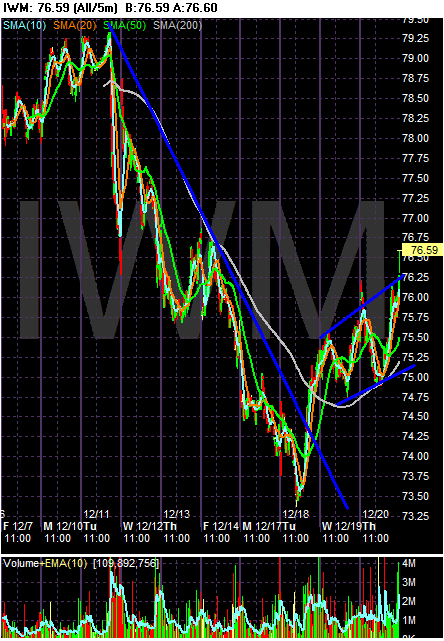
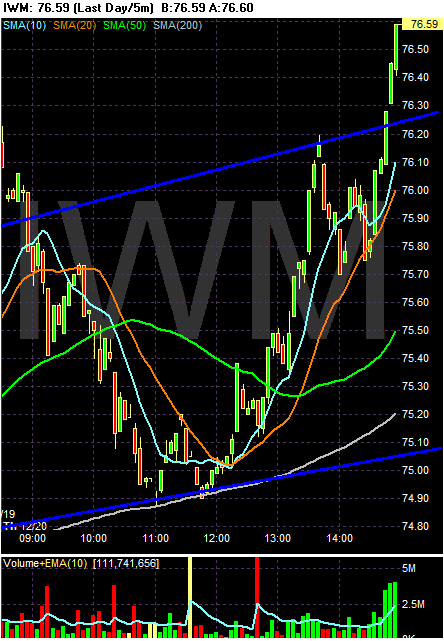
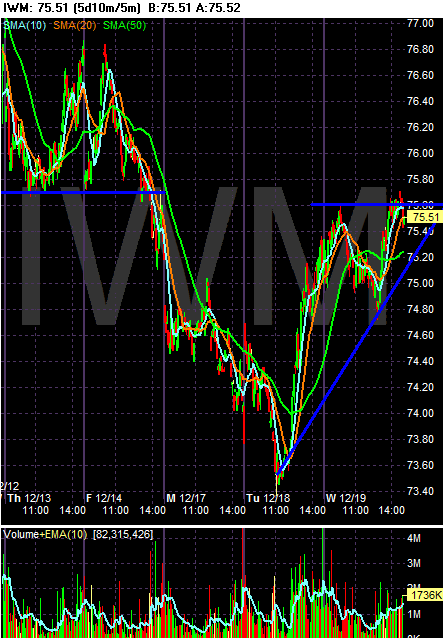
On the IWMs, notice the same situation, except the market formed an upward sloping broadening pattern. However,


Notice the IWMs broke out of the range right at the end of trading on heavy volume. That's a bullish sign.


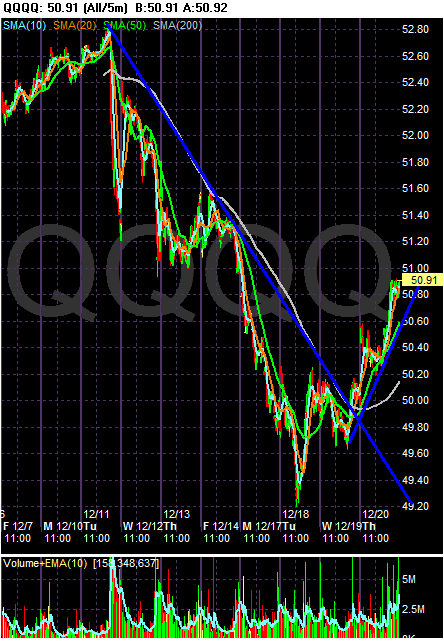
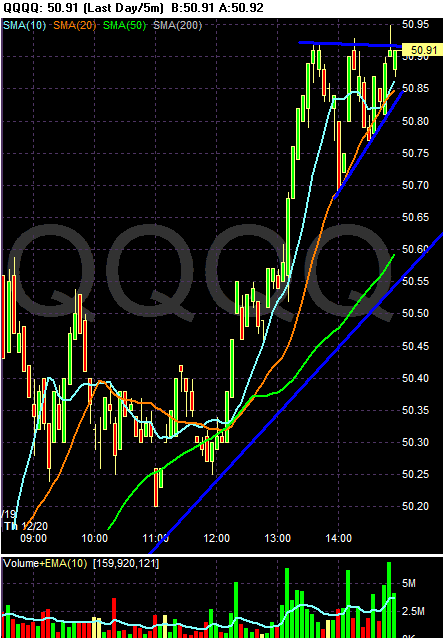
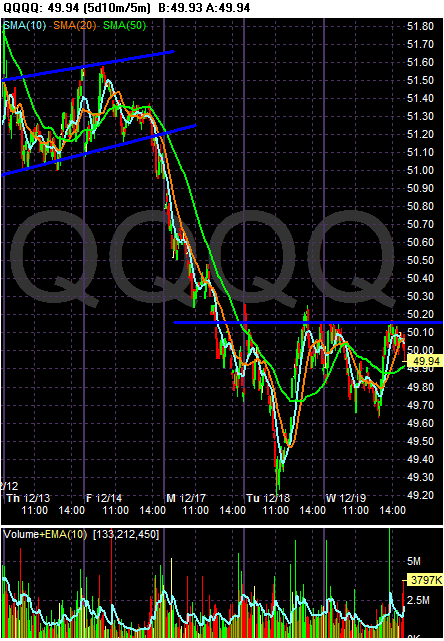
With the QQQQs, notice we have the same sell-off, but a much stronger upward move after the market bottomed.


Also notice that prices are formed a triangle consolidation pattern with some heavy buying in the last two hours of trading.

Why Transports Matter, pt II

From Marketwatch.com:

FedEx Corp.'s second-quarter earnings fell 6% because of a weaker U.S. economy and higher fuel prices, the shipping-services giant said Thursday.

The Memphis, Tenn.-based company considered an economic bellwether, also gave a third-quarter earnings forecast below the Wall Street consensus. For the quarter, Fedex anticipates earnings in the range of $1.15 to $1.30 a share, while analysts, on average, are looking for earnings of $1.37 a share, as provided by a poll from Thomson Financial.

For the three months ended Nov. 30, FedEx said it earned $479 million, or $1.54 a share, down from $511 million, or $1.64 a share, in the year-ago second quarter. Analysts' average projection as derived by Thomson Financial stood at $1.50 a share.

"As we noted last month, higher fuel prices and continued weak growth in the U.S. economy have hindered profitability," said Chief Financial Officer Alan Graf in a statement. "While we have indexed fuel surcharges in place, they cannot keep pace in the short term with rapidly rising fuel prices."

"We continue to benefit from solid international growth, which helps mitigate softness in U.S. industrial production," said Chief Executive Frederick Smith. "While we see challenging near-term economic trends, we remain confident about long-term prospects in all our business segments."


Notice two key points:

1.) Weak US growth. If the US economy were humming along, we'd be shipping more stuff to each other.

2.) Higher fuel prices. These are really starting to hit companies -- see the post two posts below for the negative impact of fuel costs on the rail industry.

3.) There was no mention of a Christmas bump. I've heard a ton of stuff about yesterday being the biggest shipping day of the year. But that is not translating into better earnings for Fed Ex. And considering the negative nature of this news, you'd think the CEO would be thrilled to report something positive

Christmas Shopping Is Still Slowing

From Bloomberg:

Sales at U.S. retailers declined for the third straight week as storeowners grappled with winter storms and rising gasoline prices that discouraged shoppers during what may be the worst holiday season in five years.

Sales in the seven days through Dec. 15 fell 0.4 percent from a year earlier, following declines of 2.7 percent and 4.4 percent the previous two weeks, Chicago-based ShopperTrak RCT Corp. said yesterday.

This year's holiday shopping season may grow at the slowest pace since 2002, according to the National Retail Federation. U.S. shoppers finished just 20 percent of their holiday gift buying last weekend, according to a joint survey conducted by the International Council of Shopping Centers and UBS Securities LLC. Consumers may be holding out for lower prices in coming days, analysts said.


Expect some serious promotions and price cutting this weekend.

Why Transports Matter

From IBD:

The railroad operator slashed its Q4 earnings outlook by 20 cents to $1.70 - $1.80 a share, below $1.98 forecasts. Union Pacific (UNP) blamed higher diesel costs. Q4 fuel costs will average $2.60 a gallon — 34% above last year — topping $2.70 this month. Union Pacific also cited weak Dec. traffic due to winter storms. Its shares fell 4%.


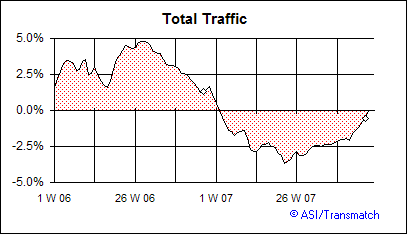
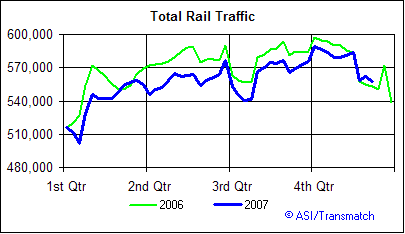
Here are some industry charts from Transmatch:


The 13-week rolling average of total traffic is increasing, and has been for awhile. That's a positive development.


But this year's total rail traffic numbers have in general been below last years numbers.

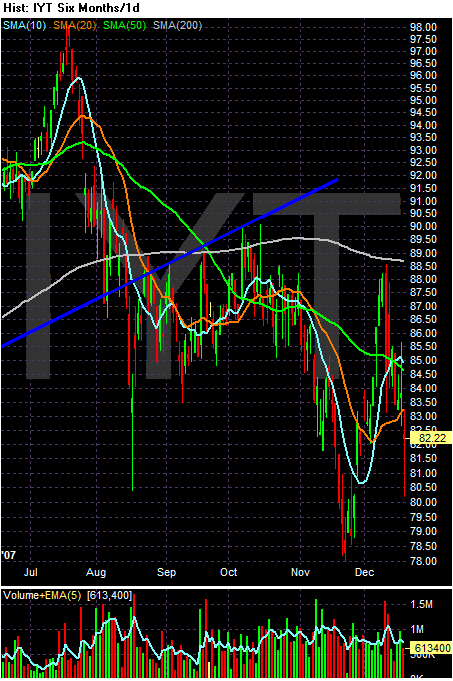
Here's the chart of the transports:


Notice the following.

-- The index is about 8% below the 200 day SMA.

-- Since August, the index has tried to rally above the 200 day SMA twice and been unsuccessful.

-- The 200 day SMA is now heading lower.

-- the 50 day SMA is heading lower.

-- prices are below all the SMAs.

On the good side -- or at least the neutral side we have the following:

-- the shorter SMAs are bunched up, indicating a lot of confusion about where the market wants to go. This is the same situation we're seeing with the big averages.

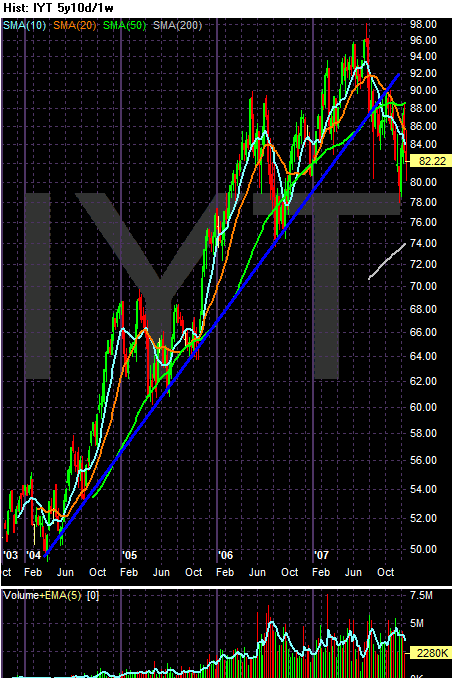
However --


On the five year chart, notice the index has clearly broken a 3 1/2 year uptrend and is now heading lower. However, the move lower is measured, meaning there doesn't appear to be any panic selling. That's about the only good thing about this chart.

About The Fed Auctions

From IBD:

The Fed said banks submitted 93 bids totaling $61.553 billion for the $20 billion in loans auctioned off Monday. That put the bid-to-cover ratio at a little more than 3-to-1.

.....

Jay Bryson, global economist with Wachovia, said the strong auction demand was positive.

"It shows that there's not a stigma attached to this as there was at the discount window and that banks are willing to come to the Fed directly," Bryson said.

The interest rate on the 28-day loans — set by the bidding process — was 4.65%. That's higher than the fed funds target rate of 4.25% for overnight bank loans. But it's below the 4.75% discount rate.

.....

Scott Brown, chief economist with Raymond James, said that at this early stage the results of the Fed's first auction are still somewhat hard to interpret.

The heavy demand for the auction loans "suggests either that there's a huge need for (the auction) or that it's working," Brown said. "You need to see the results in the credit markets in the next few days — the Libor (market) in particular is the one to watch."


Mr. Brown has the right take; it's still way too early to tell whether this will work or not.

Let me add a few points.

1.) I've said it before, and I'll say it again; this isn't about liquidity -- it's about confidence. When lenders are concerned that borrowers will take a financial hit over the period of a short-term loan, then lenders are going to be reluctant to lend. In addition, lenders have every reason to be concerned about their own balance sheets right now. Just yesterday, Morgan Stanley announced a writedown of $9.4 billion and S$P downgraded insurer ACA to junk status. In other words -- there are still a ton of problems out there in the financial market.

2.) The Fed is in a serious policy bind. Let's assume this plan works -- then great, the Fed is the champion. But if the plan doesn't work, what can the Fed do then? The latest CPI and PPI reports seriously hem the Fed in from a policy perspective. My opinion is the Fed opted for this plan because of the high inflation levels reported last month.

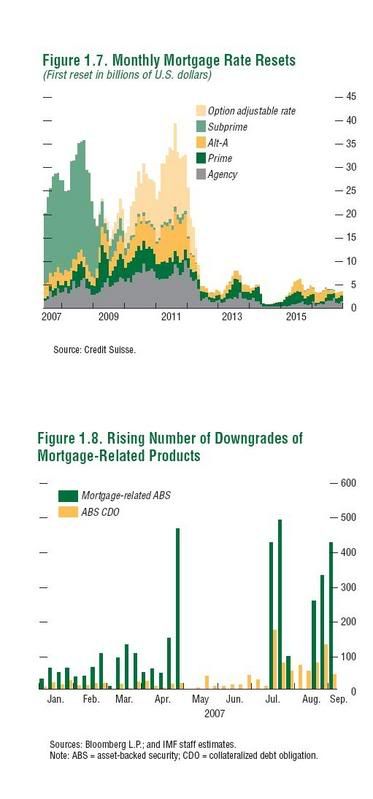
3.) This reset chart


shows one clear point: this problem is just getting started. Estimates for the total amount of losses range between $300 billion and $500 billion. So far, we've seen about $80 billion in writedowns. That means we've got a ways to go before we're out of the woods.

Fed Governor Lacker Gets It

From the WSJ:

Federal Reserve Bank of Richmond President Jeffrey Lacker warned Wednesday that the inflation picture has "deteriorated" since August amid high energy prices and said the Fed needs to keep overall prices down.

In a prepared speech given to the Charlotte Chamber of Commerce's Annual Economic Outlook Conference, the Fed official said that a key inflation gauge, the PCE, rose significantly in September and October (November's figure will be released Friday). And, he said, given higher consumer price inflation numbers for last month, "the [PCE] numbers for November will be even worse."

"Because the job of a central banker is to protect the purchasing power of currency, it is overall inflation that we need to keep down, not just core inflation," said Mr. Lacker. "I am uncomfortable with the inflation picture."


My hero.

Wednesday, December 19, 2007

Today's Markets

I'm going to do things a bit backwards today and start with the Russell 2000's daily chart.


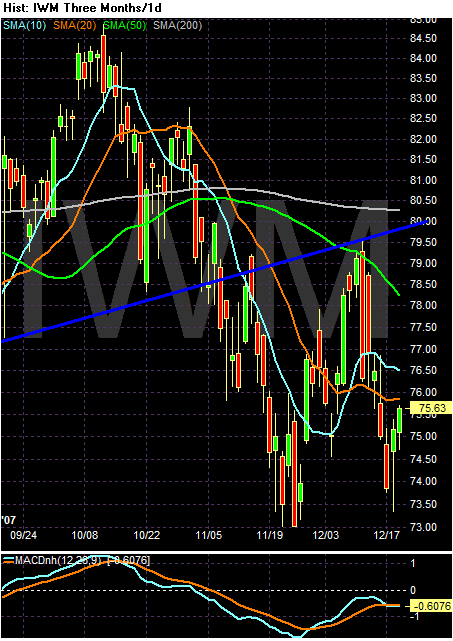
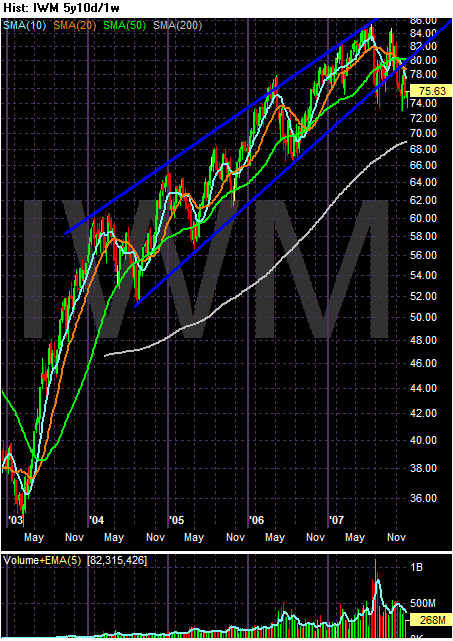
Remember, that diagonal blue line is the lower trend line of a 4 year upward sloping trend. Notice the IWMs could be forming a double bottom right now, with the first bottom occurring at the end of November and the second occurring over the last few days. In order for this pattern to be confirmed the index would have to rise about the high set in early December. But it is something to keep an eye on.


On the five day chart, notice the strong upward move of the Russell 2000. Today the index sold-off, but ended near session highs.

The developments in the IWMs are interesting because this index is by far in the most bearish situation of all the indexes.


Notice the index is below the long-term trend line and has rallied into the trend line but been rebuffed on its advance.


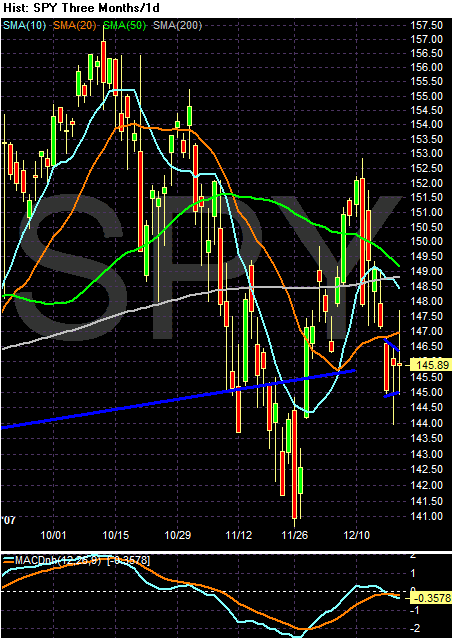
On the SPYs daily chart, notice the chart is in a small consolidation pattern. But also notice the moving averages are bunched up and sending a myriad of conflicting signals. The 50 and 10 are moving lower which the 20 and 200 are moving up.


But on the five day chart, notice it's just a big damn mess.


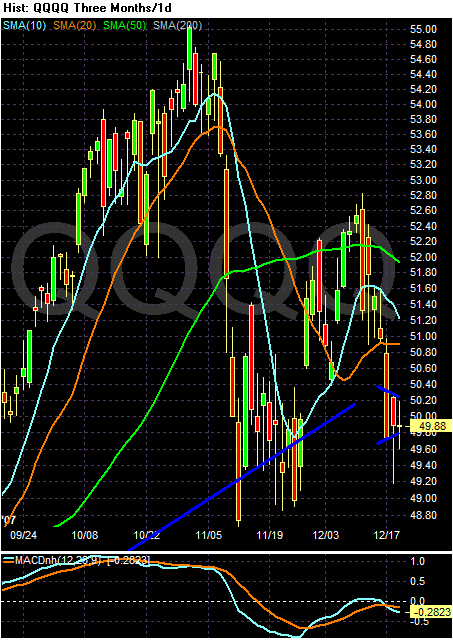
On the daily QQQQ, also notice the same technical problems as the SPYs -- moving averages sending a variety of conflicting signals. While prices are above the 200 day SMA, the 50 and 10 are moving lower and the 20 day is stagnant.


And like the SPYs, the 5 day chart is nothing more than a big mess.

Short version: the markets are searching for a direction, but not finding it. And there are a lot of reasons to think this will go on until the end of the year. The credit markets are still trying to unclog, the economy is on questionable footing and consumers are waiting for the last big sales promotion for Christmas.

Will $100/Oil Be the Norm?

From CBS:

"We think $100 per barrel oil is on the horizon in 2008, perhaps in the Spring," said Brian Hicks, co-manager of the Global Resources Fund. "Our forecast sees an average oil price around $80-$85, up from about an average of $70 in 2007."

He's far from alone. About 54% of a Barclays survey of 150 commodity investors expect the average price of oil over the next five years to top $100 a barrel, with 27% responding that it would be $80-$100 a barrel and 16% expected $60-$80 a barrel.

This view is largely backed up by the Energy Information Administration, the official statistics center of the U.S., which just upped its oil price outlook to an average of $84.93 in 2008, from its earlier view of $80 a month earlier.

"Expectations that tight market conditions will persist into 2008 are keeping oil prices high," the EIA said in its latest short-term outlook. "Despite the OPEC decision ... to hold production quotas steady and downward revisions to projected consumption growth in 2008, the oil balance outlook remains characterized by rising consumption, modest growth in non-OPEC supply, fairly low surplus capacity, and continuing risks of supply disruptions in a number of major producing nations."


There is a theory out there called "peak oil" which states the world is already at its maximum capacity and from here on out it's downhill. I can't speak for or against the veracity of this argument because I'm not a geologist. However, if you want more information on it, check out the Oil Drum.

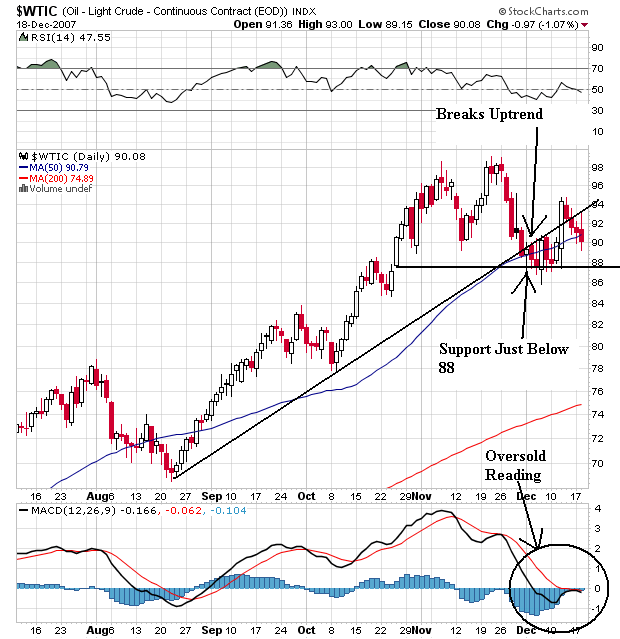
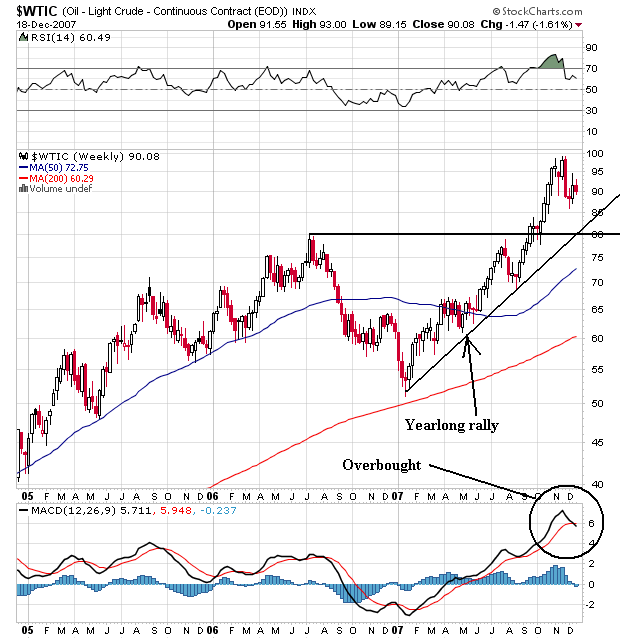
What I do know is the price chart says. Here is the daily chart.


Earlier this month, oil broke an uptrend that started in late August. But oil has also found support just below $88/bbl. The chart is consolidating right now, but the oversold reading on the MACD implies a stronger possibility of increasing prices ahead.


On the weekly chart, oil is in the middle of a strong, year-long rally. It has a clear pattern of higher highs and higher lows. It also broke through previous resistance established in mid-2006. The only thing holding this chart back is the overbought readings on the MACD.

Let me add a word of caution about technical indicators like RSI/MACD and the like. As a chart reader, I am really more a fan of a "pure" chart -- a chart with prices and moving averages. Technical readings on indicators like the MACD can stay at overbought/oversold levels for some time. This means they can give the wrong signal. In my opinion, the best way to read a chart is to simply look at the overall price trend with the help of simple moving averages and then be well aware of the fundamental picture behind the chart. For example, if a chart is "overbought" technically, there is probably a strong fundamental reason for it. The same is true for a stock that is "oversold". That's not to say you shouldn't be aware of the underlying technical indicators of the chart, just that the fundamental picture is also very important.

Foreclosures Down Month to Month, Up Year Over Year

From the WSJ:

Foreclosure filings for November surged 68% from a year ago but dropped 10% from October, another sign that foreclosure activity overall may have peaked for the year, a foreclosure-listing service said.

RealtyTrac Inc. Chief Executive James J. Saccacio said that November's 10% drop from October was the first double-digit monthly decrease observed since April 2006.

The sequential decline "could indicate that foreclosure activity has topped out for the year, but the true test of whether this ceiling will hold will come at the beginning of next year -- when we anticipate that a seasonal surge in foreclosure filings and another possible wave of resetting mortgages could place further pressure on the housing market," Mr. Saccacio said.


No -- foreclosures aren't going to decrease. Why can I say that with near certainty? Because we have a slew of resets next year.


There is no way we're going to see a decrease in foreclosures anytime soon.

But Bonddad! The Bush plan is in effect! That will save us!

No it won't. The most liberal estimate I have seen about the number of homeowners it would help is about 400,000. However, the most conservative estimate I have seen about foreclosures next year is 1.2 million. So, assuming the best outcome of the Bush plan and the best outcome on the foreclosure front, we're still looking at 800,000 foreclosures next year.

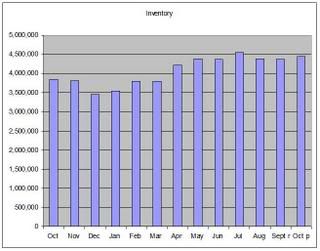
Now, let's add that information to the existing home inventory figures.


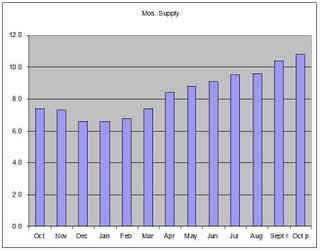
And the months of supply:


Short version: assuming the best of all the estimates, we're still looking at a world of hurt.

Tuesday, December 18, 2007

Today's Markets

Wow - what a roller coaster ride today.


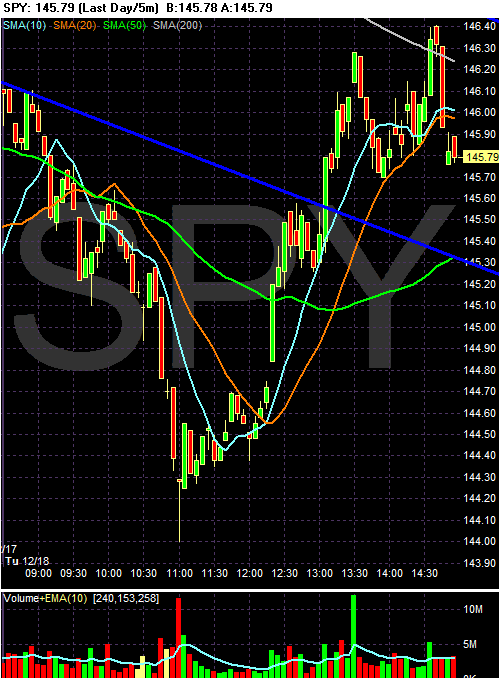
The SPYs opened lower then gapped down hard on heavy volume. But they consolidated there and moved higher over the rest of the session. The only negative on this chart is the possible double top. But there is a ton of news between today's close and tomorrow's opening.


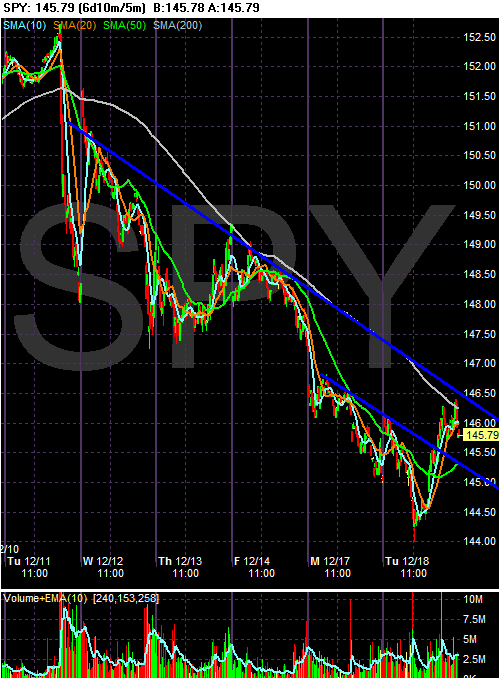
On the six day chart, notice we're still below a long-term (5 day) trend line. However, if the index can break through this line and hold above it tomorrow, it could indicate a trend reversal from the post-Fed sell-off.


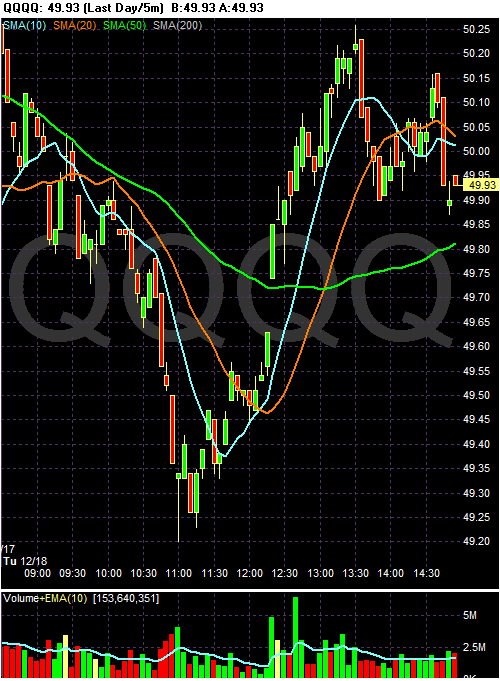
The QQQQs followed the same path as the SPYs, with the exception of a strong gap upwards when the index started to rally.


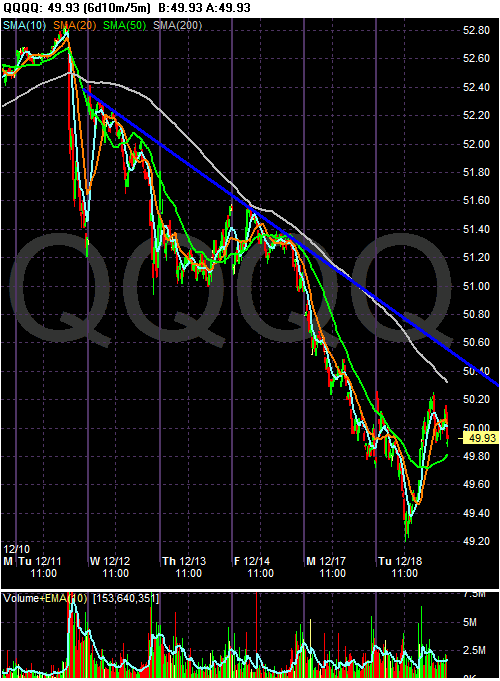
On the six day chart, notice the QQQQQs are a bit further below the 5-day downward sloping trend line.


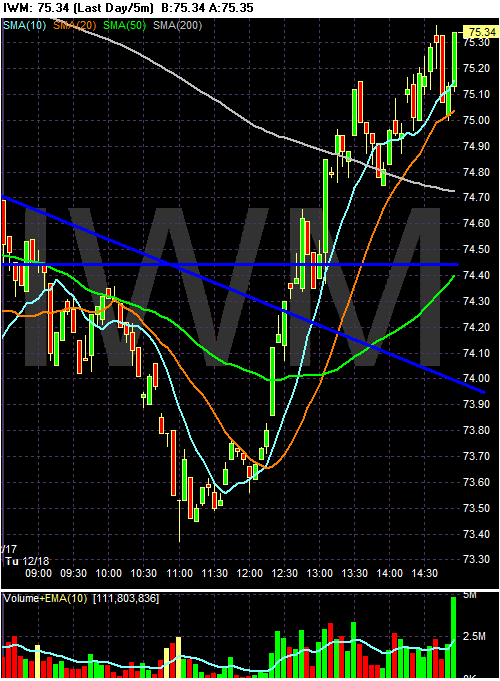
This is the strongest chart of the day. Notice the IWMs had heavier volume on their rally and closed with a solid volume spike and strong bar. These are positive developments.


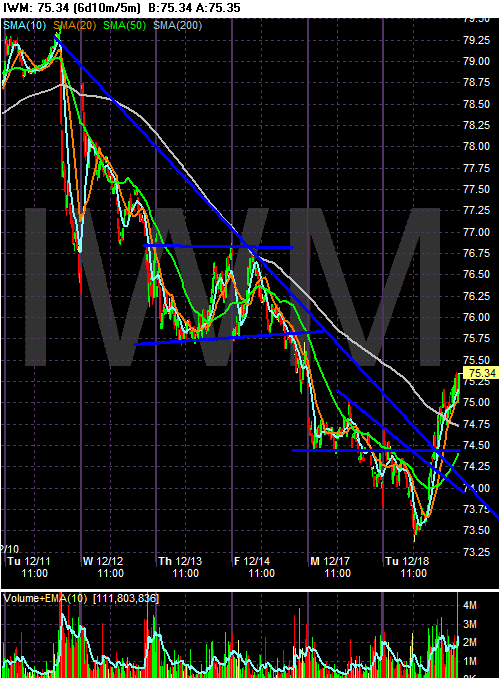
On the 6 day chart, notice the IWMs have already broken through the downward sloping, post-Fed trendline. This is another good development.

Now, the big question for tomorrow is this: will the markets follow the Russell 2000s lead and break through their trend lines?

Exports Help to Alleviate Slowing Economy

From the Christian Science Monitor:

But after years when American consumers have pulled the global economy forward, today the roles are largely reversed. A growing global economy is providing the best source of momentum America has right now, as the nation's consumers struggle to cope with high oil prices and a downturn in the housing market.

How big is the momentum? Enough to offset much of housing's negative impact. Over the year that ended on Sept. 30, a rise in US exports has equaled the decline in residential construction that represents the biggest portion of housing's current drag on growth.

"One of the reasons that the US economy has avoided a recession so far, despite a ... prolonged downturn in the housing industry, is because of the stimulus that the US has received from the global boom," says Ed Yardeni, an economist at Yardeni Research Inc. in Great Neck, N.Y. "It's been a big benefit, and I think it will continue be so."

Global growth benefits the US through several channels:

•The most obvious is that exports have been rising, now running at an annualized pace of $1.7 trillion, up from $1.5 trillion a year ago.

•America's largest companies also gain profits from sales of goods and services by their foreign-based operations. The employees are overseas, but the resulting profits provide a cushion for these companies during a US slowdown. Just ask General Motors Corp.

•The US enjoys access to foreign sources of capital that are more abundant than ever. This includes a continuing flow of investment funds – despite the drawbacks of a weaker dollar and the mortgage woes of US banks. It also means direct investment by foreign firms in US operations.


This is the chief benefit of the falling dollar -- increased exports. However, I would add the following cautionary notes.

1.) Overall profit growth for S&P 500 companies was negative last quarter, indicating that growth in foreign sales was not enough to mitigate the impact of a slumping US economy.

2.) The dollar's position has been increasing the calls from around the world for moving away from the dollar. While a cheap dollar is good, a dollar that people are dumping as a reserve currency is bad.

3.) Exports accounted for about 13% of total US GDP (approximately). In other words, there are still other areas of the economy (like consumer spending) that are larger and far more important for their overall impact.

Still, it's good to see exports increasing. And it's really nice to report something positive.

Retailers Having a Tough Holiday Season

From the Street.com

This past weekend brought a big surge of traffic, but not enough to make up for the lack of sales throughout the holiday season, industry observers say. As a result, retailers will have to cut their prices deeper -- driving down profit margins -- and keep their doors open longer to gain some ground in the home stretch.

.....

Britt Beemer, chairman of America's Research Group, expects holiday sales to increase only 1.8% this year, his lowest forecast in over 10 years.

Even with deeper discounts this week, Beemer is skeptical that retailers can make up for the traffic they lost all season.

.....

Although Black Friday, or the day after Thanksgiving, generated a 4.8% increase in traffic, industry watchers say things have tapered off considerably since. The first two weeks of December saw a lull, and only now are the crowds starting to come back.

.....

And the peak of the season is still to come. This Saturday is expected to be the busiest shopping day of the year for retailers, eclipsing Black Friday.

Chen expects those retailers who have been promoting all along will continue promoting, including in the women's apparel sector, which saw soft sales even before the holiday season began.

.....

Even online sales seem to be losing some traction. According to research firm, comScore, online retail spending has grown more than $22 billion between Nov. 1 and Dec. 14, which marks an 18% climb. While that still represents a record level, it is less than the 26% increase during the same period last year.

.....

"The current economic realities appear to be having a negative impact on the growth in consumer spending," said comScore Chairman Gian Fulgoni in a statement. "From the subprime housing meltdown to a decline in home values to higher gas prices and an uncertain stock market, many consumers across all income segments are either feeling the pinch this holiday season or are lacking the confidence to spend at the rate they had in the past."


Remember that big discounts = lower profit margins.

I should also make the following cautionary remarks.

1.) Americans love to shop and will do anything to continue shopping. That means that while there is still time before Christmas it's possible consumers could pick-up the pace.

2.) I would extend the "Christmas shopping season" to sometime in January because of gift cards and the heavy, post-Christmas promotions we have seen of the last 5+ years. It's standard to see all sorts of new year's bargains.

3.) All that being said, there are plenty of reasons for consumers to pull in their spending wings right now. The housing market is a mess, the economy has plenty of bumps in it, energy and food prices are high (and food prices are probably increasing) and in general people are very concerned about their economic environment. This is not a situation that encourages free-spending ways.

Is is a long-term chart of retail sales from econoday.
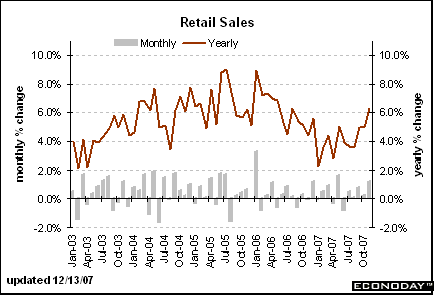


Although there was a decline in the year-over-year number from January 2006 to mid-2007, the number has been increasing of late. Some of that is probably due to lower year on year comparisons and price inflation. However, there have been some nice increases on a monthly basis as well, as indicated by the gray lines representing monthly changes.

Let's go to the charts to see what traders think about the retail sector:
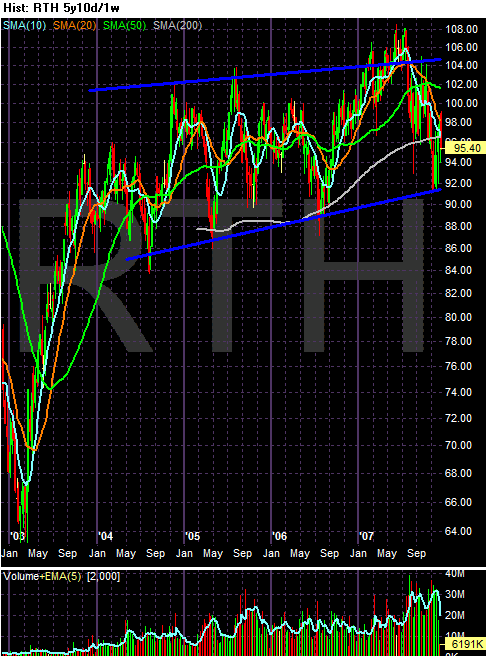


On the 5-year, weekly chart we see a pretty tight trading range of 10-15 points. In other words, despite the pretty strong retail sales numbers from above, traders have been lukewarm about the retail sector for the duration of this bull market. That's pretty interesting because the fundamentals would indicate this is a good area of the market.
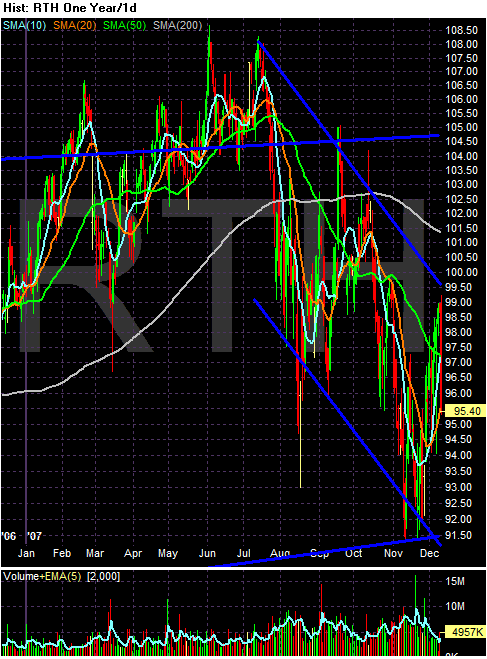


On the daily chart, notice that starting in July, the market went into a classic bear market chart of lower lows and lower highs. While the beginning of this sell-off in retail coincided with the market's first big subprime hit when Bear Stearns announced massive losses, the index has failed to rally with the market.
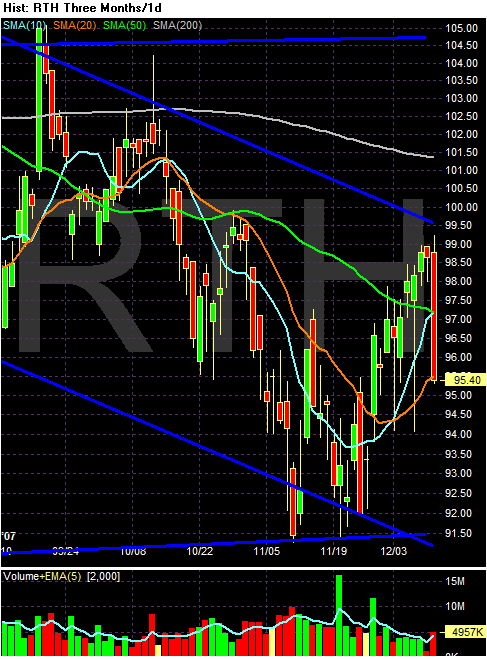


The 3-month chart shows the moving average picture. Notice that:

1.) We're below the 200 day SMA.

2.) The 200 and 50 day SMA (longer-term trends) are down.

3.) The shorter term trends are rising.

4.) The SMAs are bunched up, with conflicting short and long-term signals.

Short version: according to traders, retail isn't looking that hot right now. While the shorted SMAs indicate we could be getting a short-term upswing, the long term trend is down.

Agricultural Prices Increasing

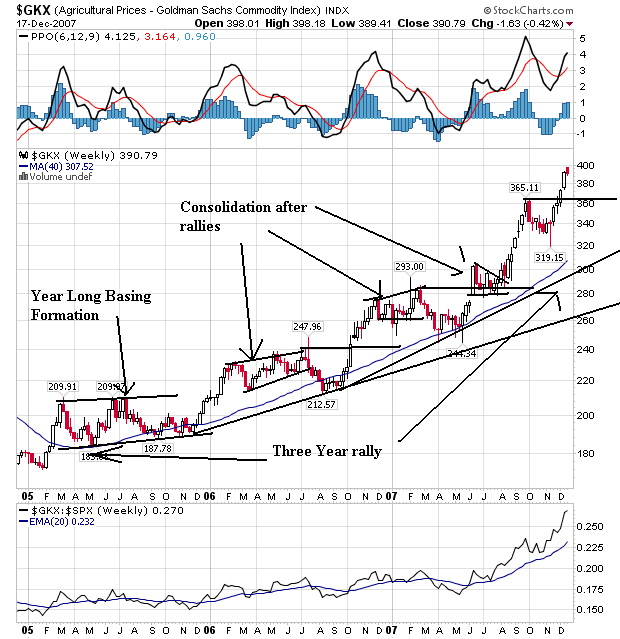
I've talked about agricultural prices a lot, largely in the context of inflation. The chart below explains why these prices are really important right now.


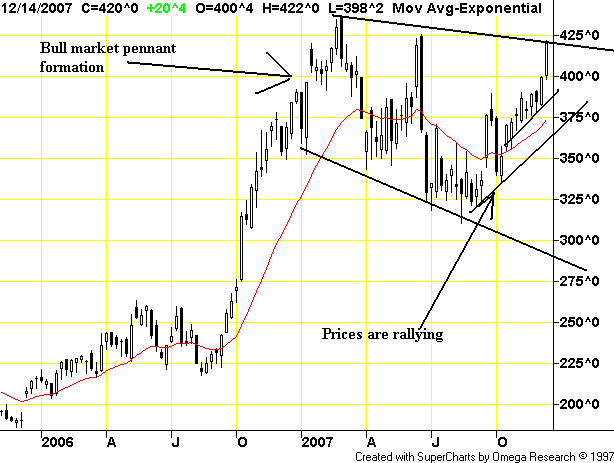
For the last three years, agricultural prices have been increasing. The chart above shows an incredibly strong chart that is a great example of a bullish chart. Prices formed a strong base in 2005. They rallied from the base and then consolidated in a bullish pennant formation in 2006. After selling off a bit, prices again rallied into 2007 where they again consolidated in two patterns -- a broadening pattern and then a triangle pattern. Prices have risen twice since then. In short, this chart says prices are increasing and will be for the foreseeable future.

From Bloomberg:

Wheat futures gained in Chicago as rising food costs signaled increased demand for the grain at a time of shrinking global stockpiles. Corn and soybeans declined as recent advances may have been overdone.

U.S. consumer prices rose the most in two years last month, while inflation surged 6.9 percent in China and 3.1 percent in Europe. Inflation is accelerating as oil and other energy prices reached records in November, spurring investors to buy commodities as a store of value.

``The global backdrop of inflationary pressure is supportive for agricultural products as we head into 2008,'' Nie Ben, manager at Liaoning Cifco Futures Co., said by phone from Dalian in northeastern China today.

.....

Corn reached a nine-month high yesterday at $4.4325 a bushel, while soybeans extended a rally to the highest since 1973 on speculation that U.S. demand for fuel made from grain and oilseeds will surge. The Senate passed a bill Dec. 13 that may boost use of alternative fuels such as ethanol and biodiesel.


Let's look at some of the individual charts:


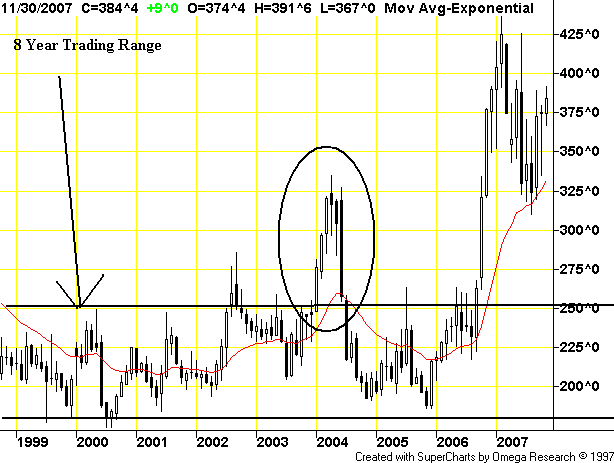
Except for a price spike in early 2004, corn traded in a 20% range for 8 years. An old trading saying is the longer the base, the stronger the rally. If that holds, we're in for one hell of a bull run.


On corn's weekly chart, note it has been in a bull market pennant pattern for most of this year. This is a classic consolidation pattern. Also note that prices are making a move to break out of this pattern and move higher.


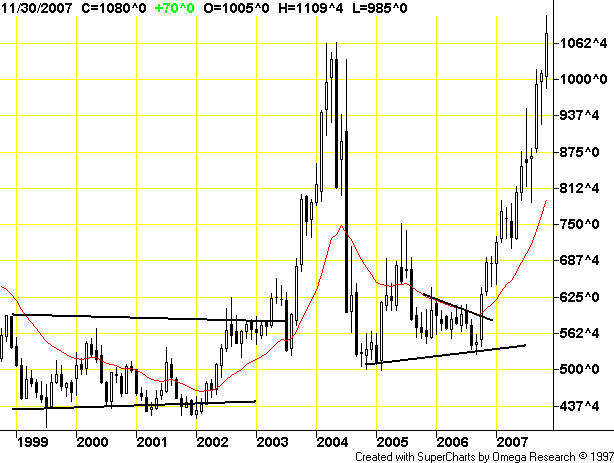
The monthly soy chart shows prices have been here before.


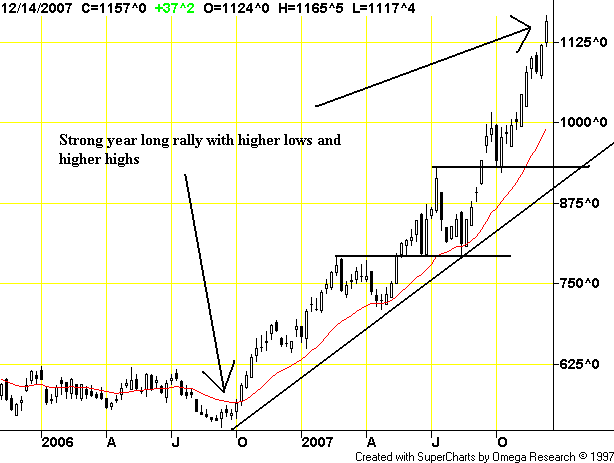
But, for the last two years, soy beans have also rallied. This is another example of a bullish chart. Note the continual pattern of higher highs and higher lows. While soy beans have been here before as the monthly chart demonstrates, this week chart shows there is every reason for prices to continue higher.


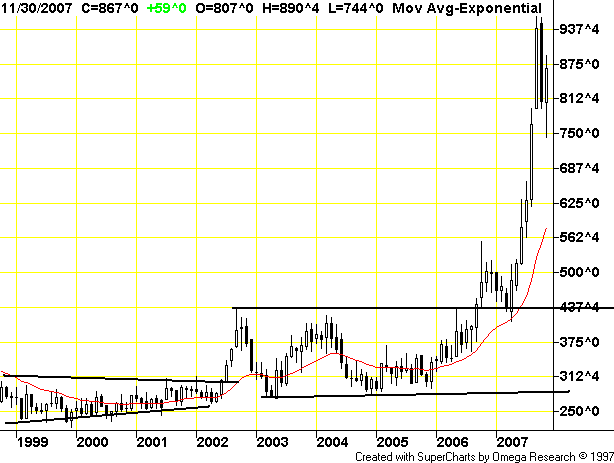
Like corn, wheat was in a pretty tight range for 8 years.


But since then, prices have clearly rallied. They broke out of their base in late 2006. From the end of 2006 through the first quarter of 2007 prices consolidated. Then they broke out. The only drawback to this chart's bullish angle is the possible formation of a double top this year.

Short version: agricultural prices are in a strong position to continue moving higher.

Monday, December 17, 2007

Today's Markets

Sir prints-a-lot speaks and the markets freaks. Imagine that.

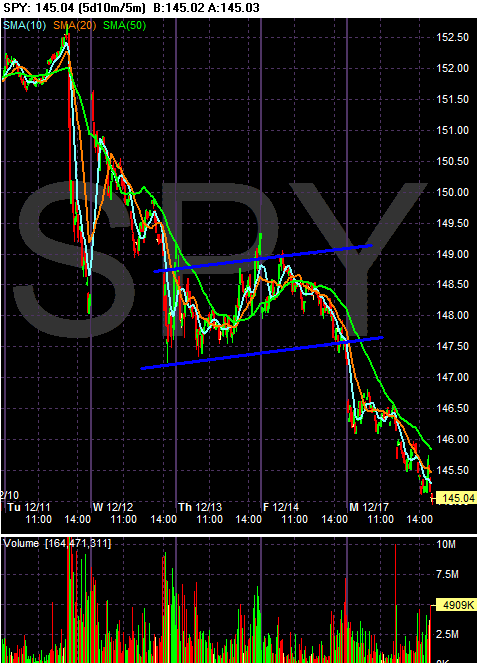
I'm going to do this a bit backwards today. Here is the 5-day SPY chart in five minute increments.


Ever since the Fed's policy announcement the market has not been happy. Notice that

1.) The market dropped immediately after the announcement.

2.) While the market popped the next day, it could not hold.

3.) The market consolidated on Thursday and Friday. However, the market sold-off at the close on Friday.

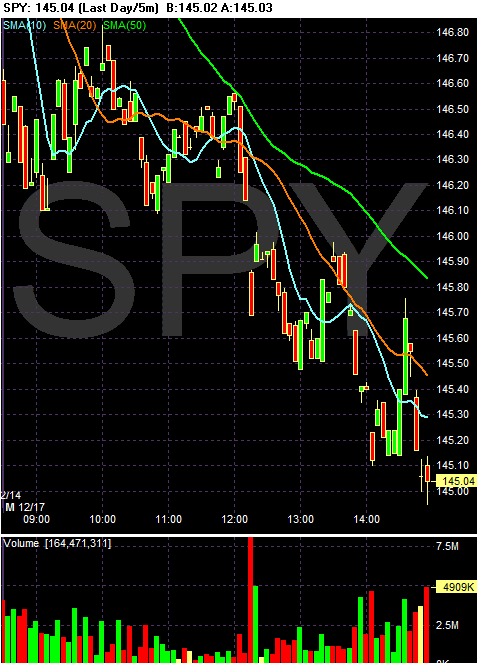
And then there is today's chart:


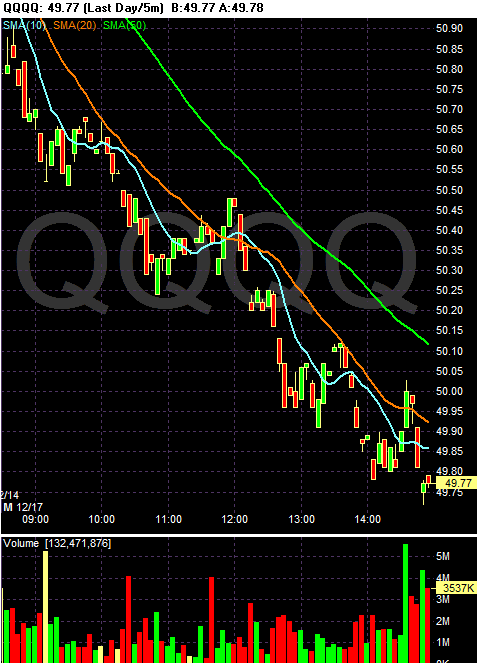
Notice the numerous gaps, and the heavy volume on several down bars. In addition, the market sold-off on heavy volume right at the close.


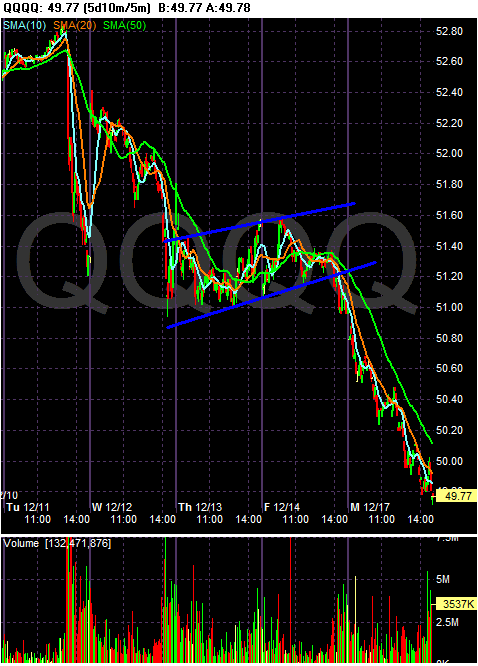
While much of the analysis for the SPYs applies to the QQQQs, notice on today's chart:


We have a solid downward trend with heavy selling at the close.


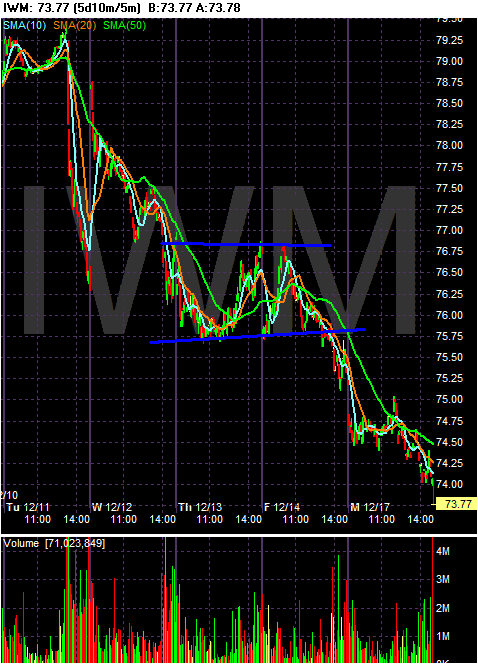
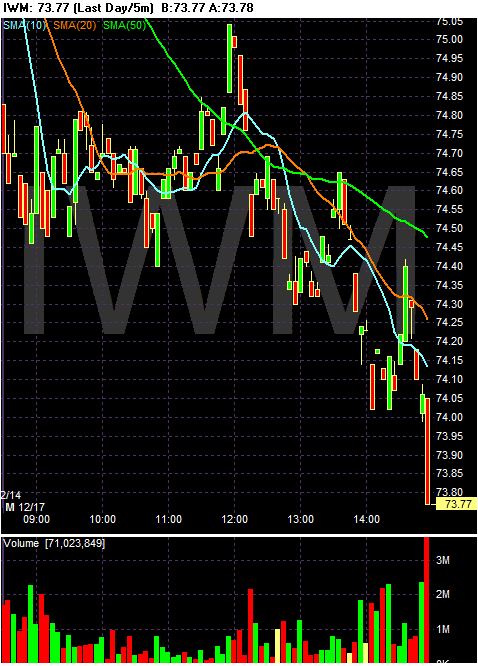
And the Russell 2000 has a lot in common on the five day chart....


But like the SPYs, this index couldn't hold the consolidation pattern it established in the morning.

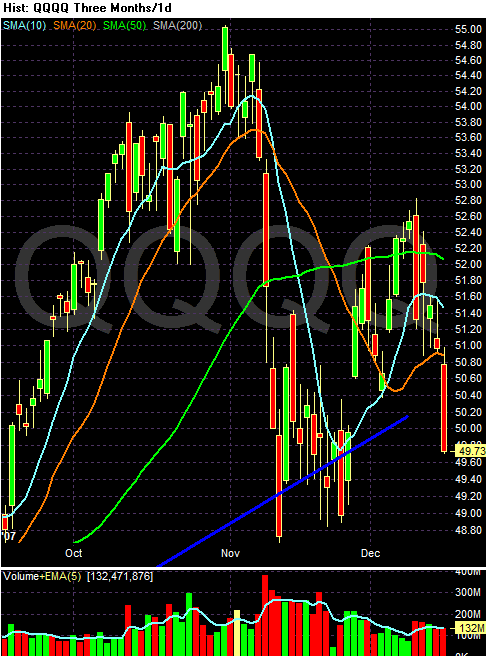
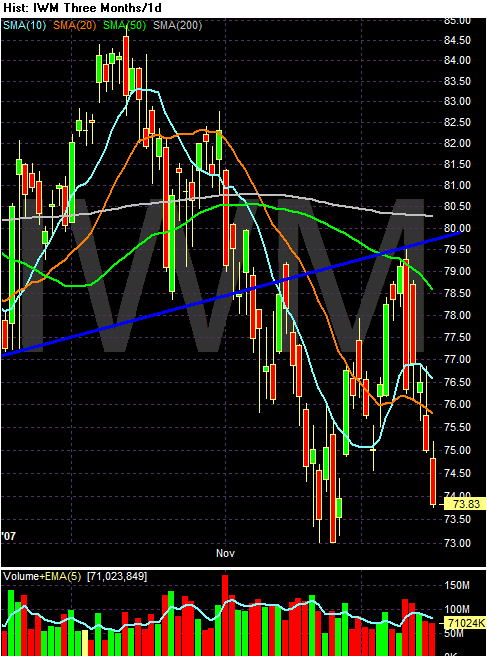
Go back to the daily charts -- the charts from today. Notice that on all three charts the bulls tried to regain control of the markets. There are places where you can find a strong upward moving bar with accompanying heavy volume. But also notice the market could not maintain this upward momentum. That's a troubling development, because it indicates the bears are developing more control over the market right now.

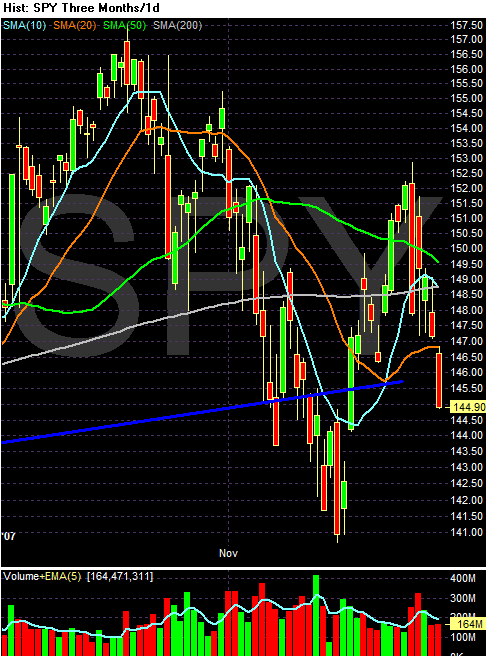
Let's go to the three month daily charts:


Today, prices moved through the 20 day SMA and the upper trend line of the 4-year uptrend of the average. That's not good. There is little technical support below the current price level, save previously noted price levels.


On the QQQQs we have the same situation, although today's bar is far more bearish because it is longer.


And on the IWMS, notice this is the second day prices have moved below the lowest moving average. Also notice there is only one close technical support is from the lows of late November.

About the only good thing about the daily charts is the SMAs are a mess. The SPYs and QQQQs have very conflicting signals coming from their moving averages right now. however, the IWMs are very close to a very bearish alignment with the shorted SMAs below the longer SMAs.