Saturday, October 13, 2007

Last Week's Market Action


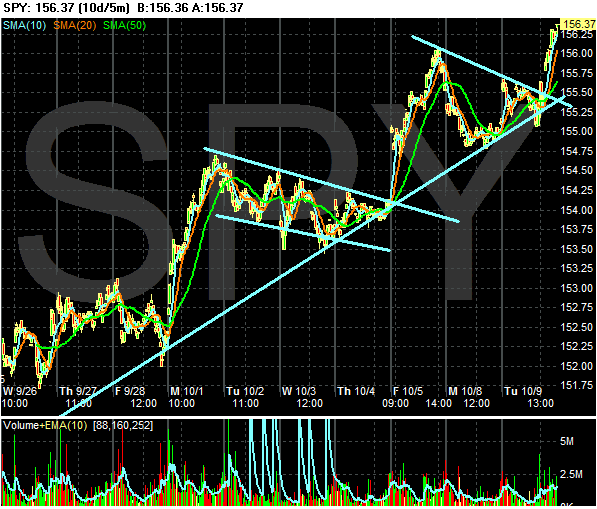
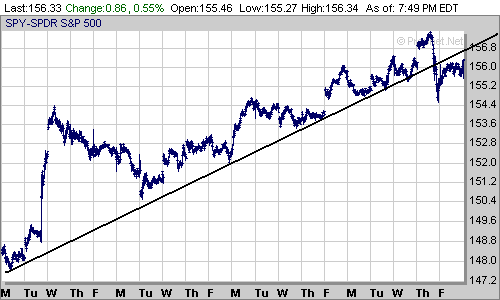
Above is a 20 day SPY chart in 5 minute increments. Notice how the market has been rallying since a few days before the Fed meeting. After the Fed cut rates, the market moved higher making higher highs and lower lows. However, on Thursday the market broke through support. On Friday the market continued to trade below the trendline.
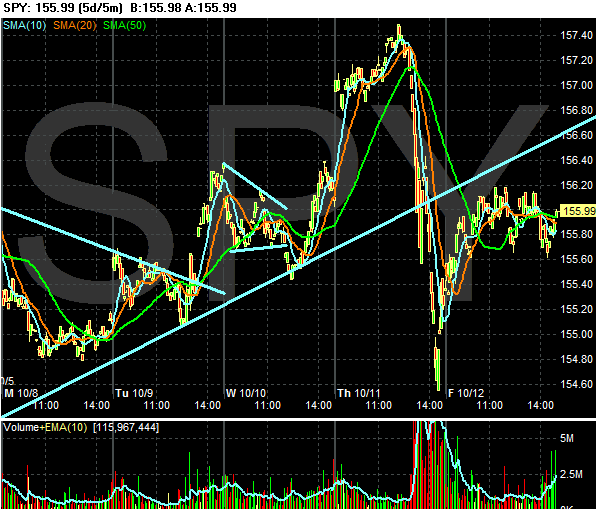


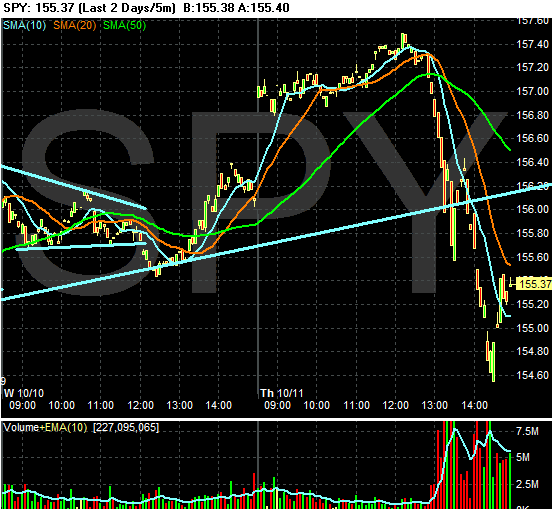
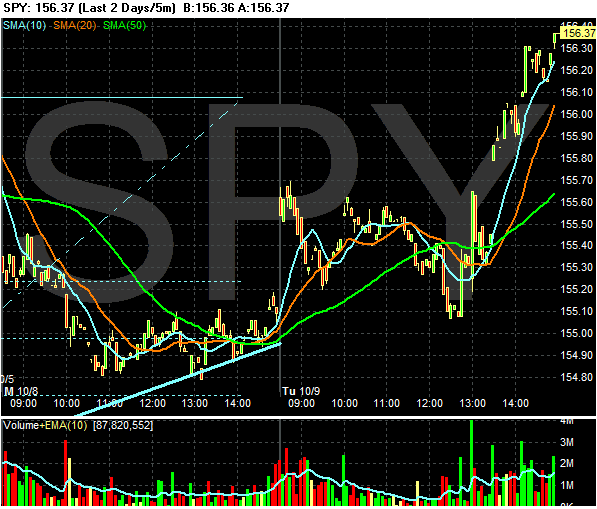
Above is a chart of last week's SPY action in 5-minute increments. Notice the heavy selling that occurred on Thursday, along with the long candles. Both of these factors indicate traders were looking for a reason to sell, and Thursday's news gave them ample reason.
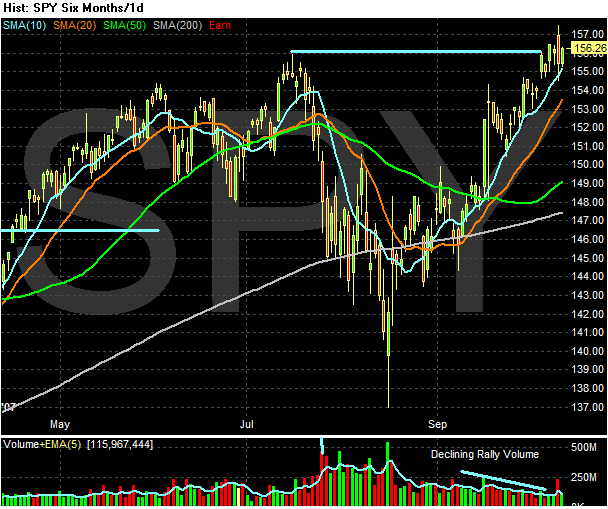


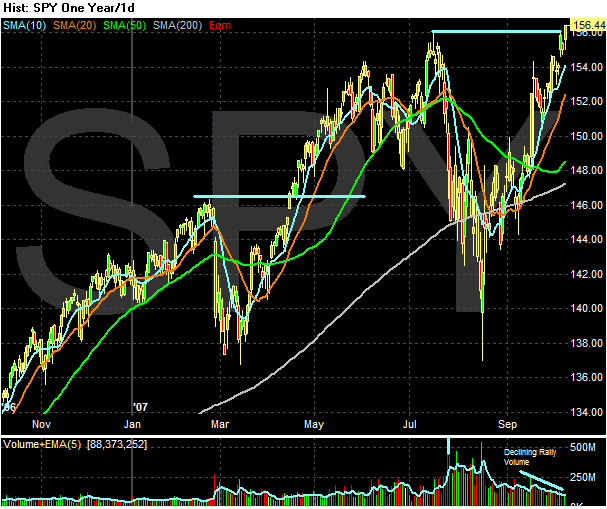
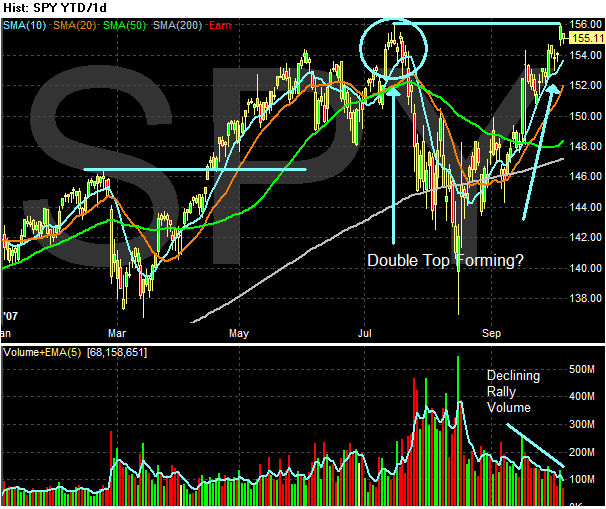
I've been on a double top watch for the SPYs for the last week or so. Last week's action -- especially the heavy selling near an important technical price point -- gives me a reason for concern. The earnings news from the financial sector has been terrible. Most major financial companies have reported big hits to their earnings from the credit mess. The energy sector is getting hit by tighter refining margins. In short, so far this earnings season has raised some red flags. We are still early in earnings season, so all of this could change over the next few weeks.
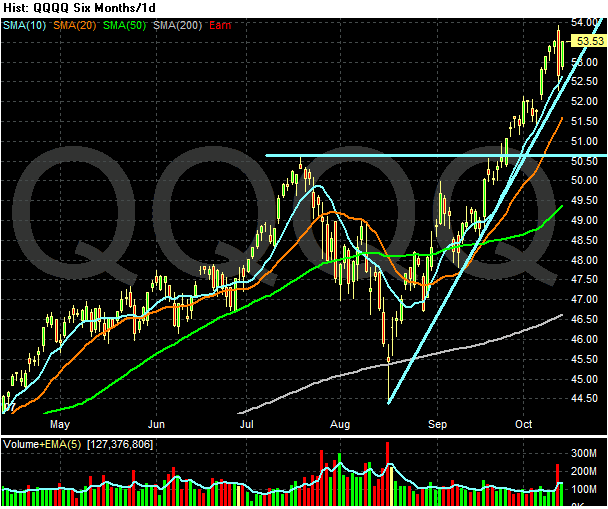


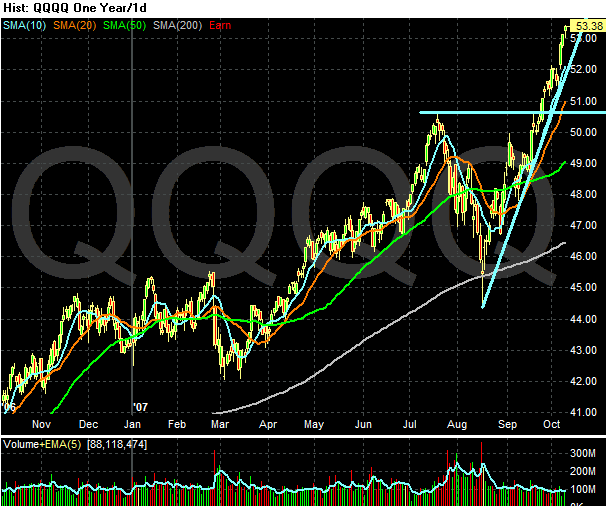
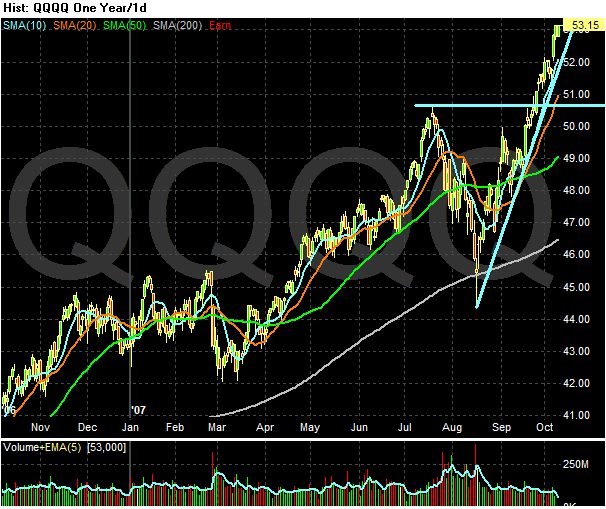
The QQQQ's continue their rally. They have moved convincingly above previous highs and last week's sell-off has done little technical damage to the chart. There has been a quiet rally across the technology sector.
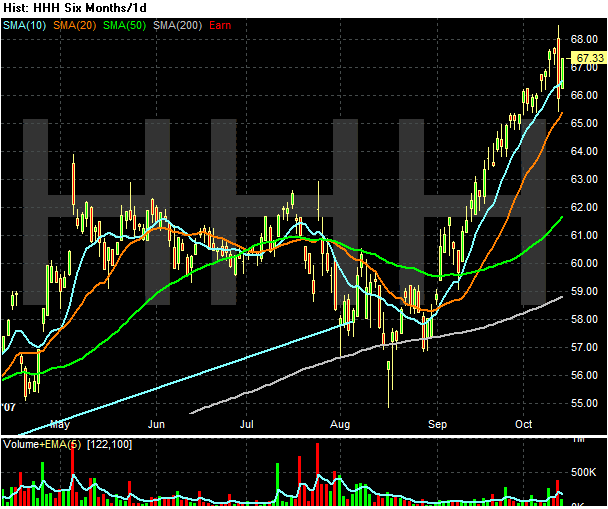


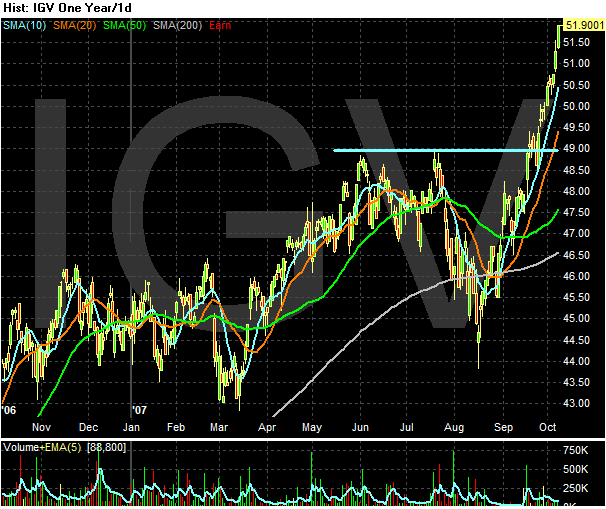
The internet sector has rallied
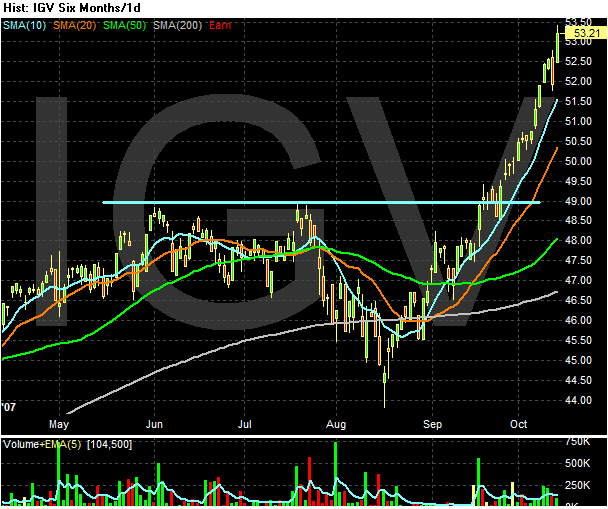


As has software
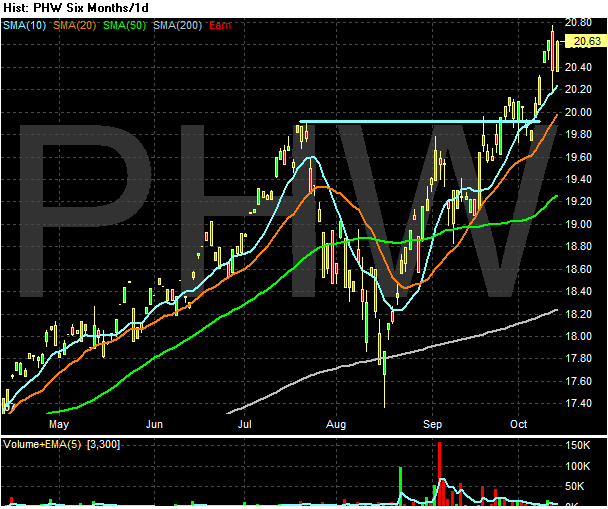


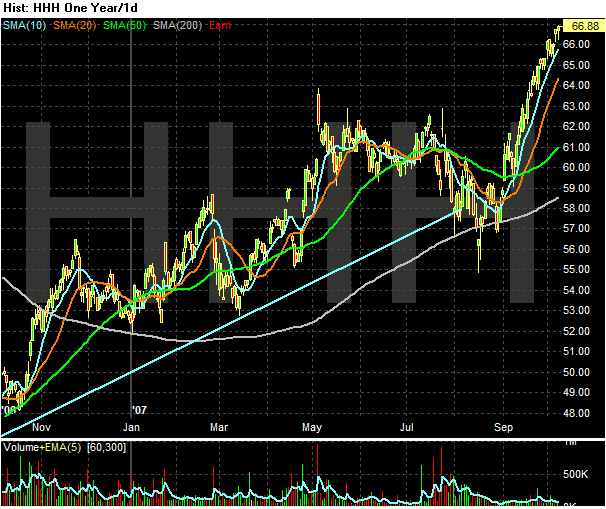
And electronics
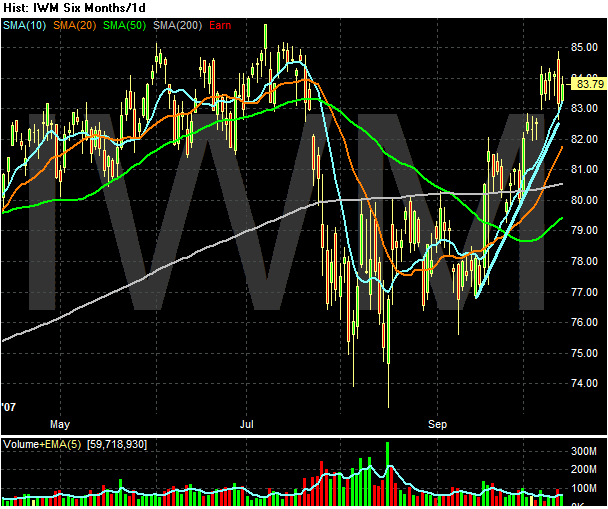


The Russell 2000 is also moving up. However, this index has to get above the 85 level before it moves into new territory. While it is encouraging to see this index moving up, new territory is where it will make its mark.
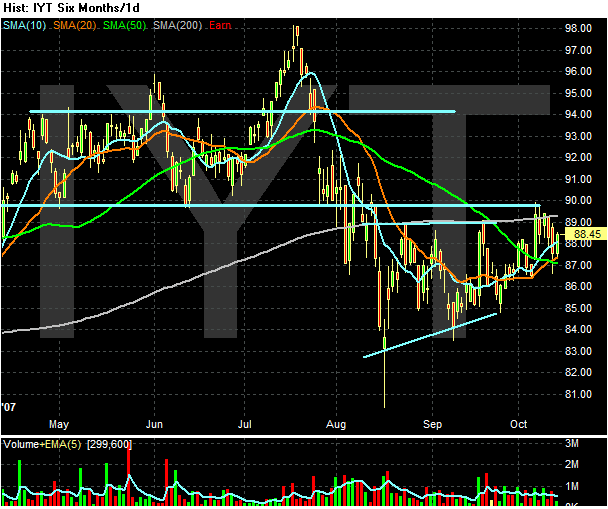


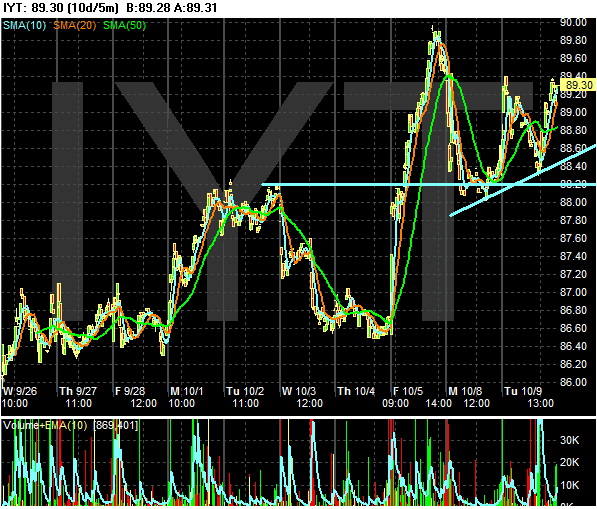
The Transports still haven't confirmed the rally.

So -- where does this leave us.

With the SPYs breaking trend at previous resistance, my concern level has gone up. We've had a nice post rate cut run, but now reality is setting in. Earnings aren't expected to do well this quarter. The Financial sector is taking a major hit. Retail sales were so-so (unless you count the increase in gas station receipts). Traders are starting to figure out the rate cut was not a panacea for all that ails the economy; there are still fundamental issues that won't easily go away.

The real test will be the earnings releases over the next few weeks. Traders may have set their sights artificially low, meaning companies can easily break expectations. However, we could also have a lot of downside earnings surprises. This is a very fluid situation.

Friday, October 12, 2007

Weekend Weimar


The markets are almost closed. Do something else. Do anything except think about the markets or the economy.

Retail Sales Up .6%

From Bloomberg:

Retail sales in the U.S. increased more than forecast in September, a sign that consumers will help the economy avoid a recession even as the housing slump deepens.

The 0.6 percent increase followed a 0.3 percent gain the prior month, the Commerce Department said today in Washington. Purchases excluding automobiles rose 0.4 percent.

The report will ease concern the collapse in housing and a decline in consumer confidence will cause spending, which accounts for more than two-thirds of the economy, to retrench. Gains in jobs and wages are giving Americans the means to weather lower home values and reduced access to credit, economists said. Treasuries dropped after the release.


Here are the tables from the Census Bureau

The underlying growth is a lumpy:

Gasoline sales were up 2%. Health was up 1%. Electronics and appliances were up .9%.

Regarding the increase in gas sales, remember that gas prices are higher now than they were a year ago.


CNBC noted:

Sales at gasoline stations also rose strongly in September, up 2 percent following a 2.6 percent drop in August. However, this increase primarily reflected the fact that pump prices were rising last month after having declined the previous month.


But general merchandise was down .1%, department stores were down .5%, and miscellaneous store retailers were down 1.3%.

The big news came from the auto sales, which increased 1.2%.

Will Basic Materials Continue to Lead the Market?

From Bloomberg:

Stocks in Europe and Asia fell, led by mining companies after Citigroup Inc. lowered its recommendation for the industry saying it was ``surprised'' by the shares' two-month rally. U.S. index futures also declined.

BHP Billiton Ltd., the world's largest mining company, and Rio Tinto Group paced the retreat. Alcatel-Lucent SA and Nokia Oyj sank following a sell-off in U.S. technology companies. Sony Corp. led Asian shares lower after the company's mobile-phone unit reported the first profit drop in two years.

.....

``Some of the mining stocks have had huge moves up from their lows during the credit crisis,'' said Job Curtis, who helps manage about $2.2 billion at Henderson Global Investors in London ``I am a bit cautious. You can't forget that this is a cyclical sector and, at some point, we are going to see a downturn.''


Basic materials are benefiting from huge global demand. Many countries (especially China and India) are literally gobbling up raw materials. I seriously doubt this is going to change in the near future -- or distant future. Both countries seem determined to grow a high rates.

However, markets rise and fall. This is a natural process. Traders take profits.

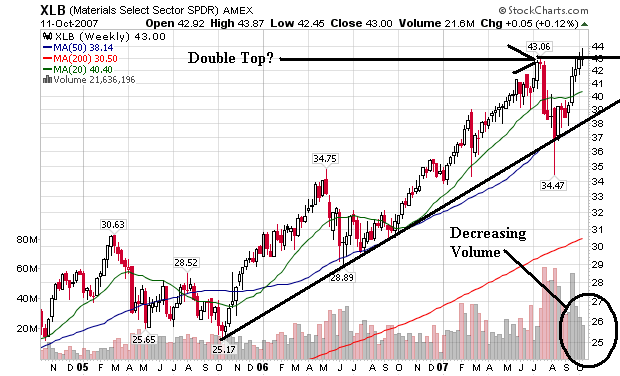
The basic materials ETF is one of the top performing ETFs for the year. However, all things come to an end.


Notice the following on the above chart.

1.) The uptrend is still very much intact. The index would have to lose about 10% before it comes close to testing long-term support.

2.) All the moving averages are moving up and the shorter moving averages are higher than the longer moving averages.

3.) Prices are above the moving averages.

4.) There is decreasing volume on the latest upward move.

5.) Like the SPYs, the XLB chart could be forming a double top.

Thursday, October 11, 2007

Today's Markets

For the last week, I've been talking about the rally in the market. That ended today.

But in the afternoon, ECB governing council member Axel Weber said rising inflation in the euro zone may require additional policy action, according to Dow Jones Newswires. The comments appeared to raise concerns on Wall Street that European growth could slow and that in the United States, inflation could prevent the Federal Reserve from making another rate cut.

Many investors have been betting on another rate reduction from U.S. policy makers, who lowered the target federal funds rate by half a percentage point on Sept. 18 in response to a tightening in the credit markets.

Wall Street's mood was also dampened when JPMorgan Chase & Co. lowered its revenue expectations for Baidu.com Inc., said Kelmoore Strategy Funds portfolio manager Matt Kelmon. That hurt technology companies, which had been rising strongly in recent days.


The ugly inflation word reared its ugly head and the market was reminded that agricultural and energy prices are still at very uncomfortable levels. In addition, technology has been the great saving hope of the markets, so the downgrade would definitely be considered a bearish indicator.

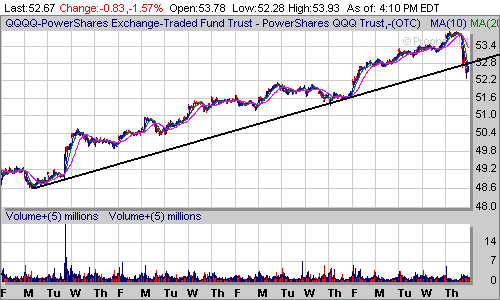
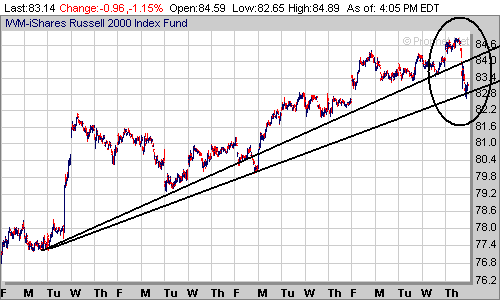
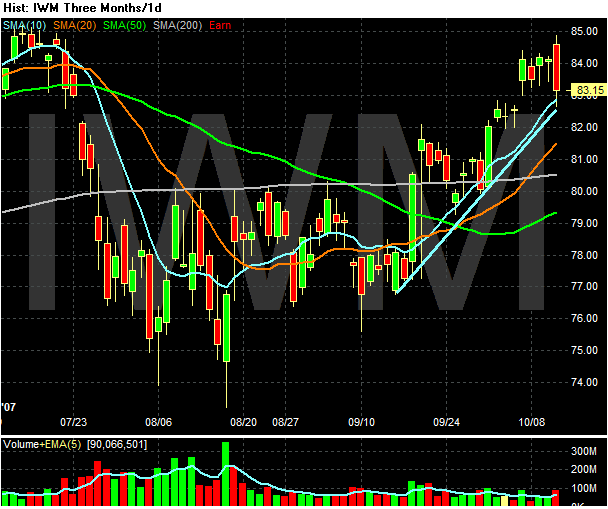
Respectively, here is a chart of the SPYs, QQQQs and IWNs.


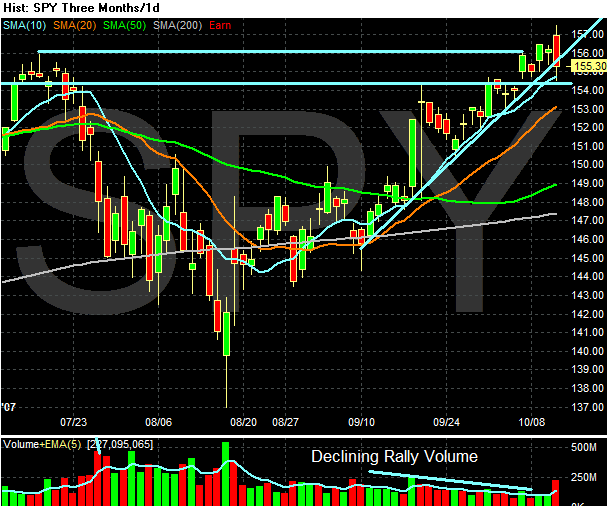
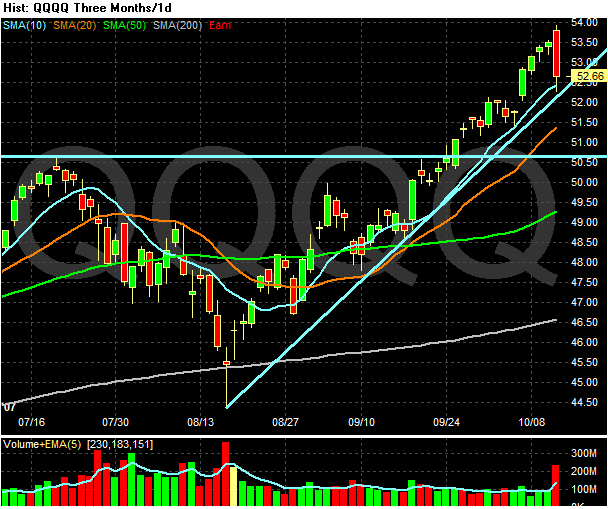
Both the SPYs and the QQQQs broke a strong uptrend today. There are two possible trend lines for the IWMs. I included both, although I think the highest one is the most appropriate beacause it makes more connections with actual prices.

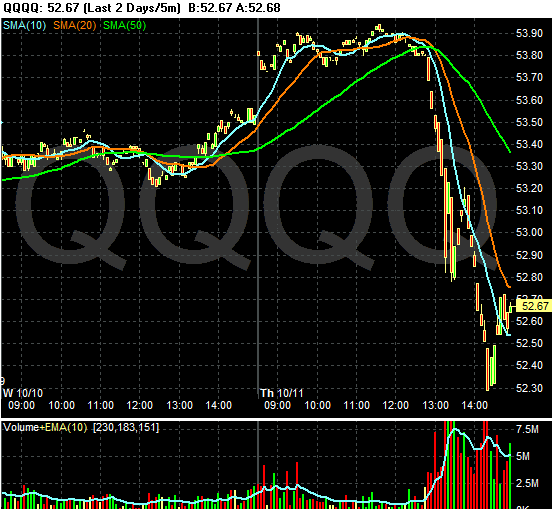
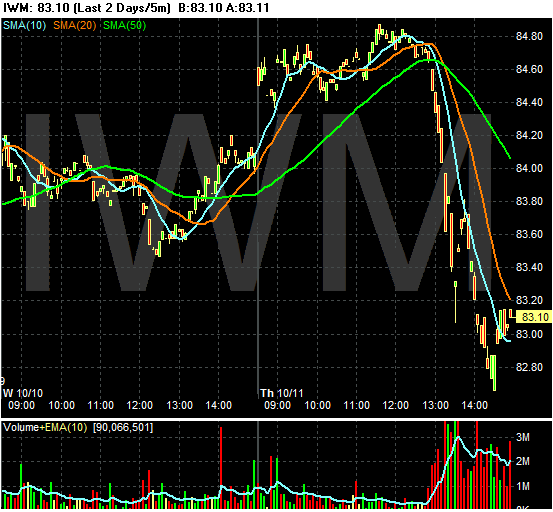
Here are, respectively, the two day charts of the SPYs, QQQQs and IWMs. Notice the extremely heavy selling volume on the downward moves. Also note the extremely large candles indicating the severity of the selling action this afternoon.


However, despite the heavy selling action, the upward trends on the daily charts of the SPYs, QQQQs and IWMs is still intact.


All three daily charts are still strong. My guess is traders have watched the market go up since the Fed cut rates. They were looking for a reason to sell and today's news gave them that reason.

Over the next week, pay particular attention to the SPYs. I use this average as my overall market benchmark because it includes 500 companies and a good breadth of market sectors. The chart could still be forming a double top.

Gas Prices Still Higher Than Last Yeat By Wide Margin

From This Week in Petroleum:

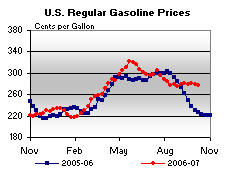
The U.S. average retail price for regular gasoline dropped 1.8 cents last week to 277.0 cents per gallon as of October 8, 2007, but is still 50.9 cents higher than last year. All regions were lower except on the West Coast where retail regular gasoline prices rose by 1.2 cents to 293.4 cents per gallon, the highest in the nation. The average price for regular grade in California was 299.6 cents per gallon, up 2.3 cents from last week and 39.5 cents per gallon over the previous year. The East Coast price fell 2.0 cents to 274.6 cents per gallon while the Midwest price decreased 2.7 cents to 275.5 cents per gallon, still 60.2 cents per gallon above last year. The region with the lowest price also tallied the largest decrease with the Gulf Coast falling 3.3 cents to settle at 266.7 cents per gallon. The Rocky Mountain region price decreased 0.8 cent to 280.2 cents per gallon.


Here's a chart of gas prices:


Notice that prices typically decline in the fall as the summer driving season comes to and end. That isn't happening this year. This could be a very important story as the Christmas shopping season approaches.

Also note that today's retail sales release was characterized as Retailers Report Slow September Sales. Gas prices could have something to do with that.

Trade Deficit Improves -- Exports Hit Record

From the AP

The Commerce Department reported that the trade deficit declined to $57.6 billion in August, down 2.4 percent from the July imbalance. It was the lowest gap between exports and imports since January and a much better showing than had been expected.

The improvement reflected a 0.4 percent rise in exports, which climbed to a record $138.3 billion, as the decline in the value of the dollar against many other foreign currencies boosted sales of American farm products, industrial supplies and consumer goods to all-time highs.


This is good news and demonstrates one good side effect of the falling dollars.

Retail Sales Disappoint

From the Street.com

Retailers were reporting sluggish September sales Thursday, with clothing sellers posting particular weakness and several warning of earnings shortfalls.

Many companies were quick to blame warmer weather for the lackluster results, saying high temperatures kept fall clothing items on the shelves. Broader-scale department-store chains performed weakly, with giants such as J.C. Penney (JCP - Cramer's Take - Stockpickr - Rating) and Nordstrom (JWN - Cramer's Take - Stockpickr - Rating) slashing their profit views.

One of the few bright spots came from retail giant Wal-Mart (WMT - Cramer's Take - Stockpickr - Rating), which posted a slight uptick in sales but offered a rosier profit forecast for the third quarter.

Wal-Mart's same-store sales rose 1.4% in the U.S., slightly shy of analysts' target for a 1.8% rise. Still, the company lifted its third-quarter earnings forecast to 66 cents to 69 cents a share from analysts' prior forecast of 62 cents to 65 cents. Analysts, on average, predicted earnings of 63 cents a share.


Here's a chart of retail sales from econoday. The chart is for last month's release. Tomorrow we get information from the Census Bureau.


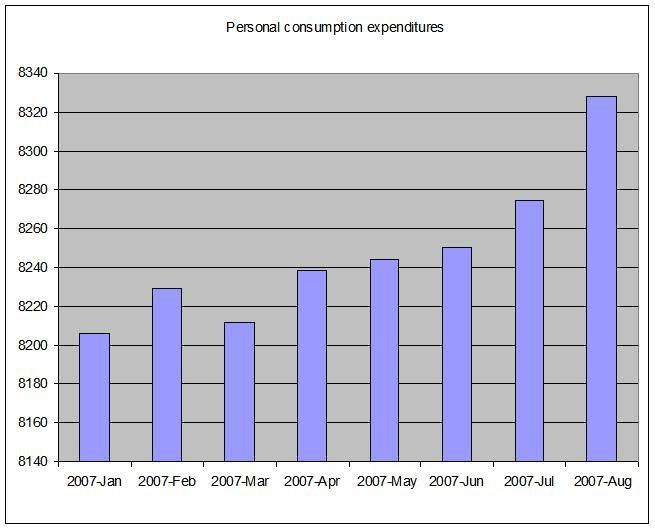
However, personal consumption expenditures from the Bureau of Economic Analysis have increase the last 2 months. Here are the last few monthly totals at a seasonally adjusted annual rate in chained 2000 dollars.

Home Foreclosures Double In September

From Bloomberg:

U.S. home foreclosures doubled in September from a year earlier as subprime borrowers struggled to make payments on their adjustable-rate mortgages, RealtyTrac Inc. said.

There were 223,538 foreclosure filings last month, including default and auction notices and bank repossessions, the research company said today. California had the most with 51,259 and Florida was second with 33,354. The national foreclosure rate was one for every 557 households, according to RealtyTrac.

Foreclosures are deepening the U.S. housing recession by pushing more homes onto a market where sales and prices are dropping. The glut of unsold homes makes it difficult to sell or refinance without losing money. As many as half of the 450,000 subprime borrowers whose mortgages will re-set through November may lose their homes because they can't afford the higher payments, according to a report by Credit Suisse Group.

``The truth of the matter is that borrowers are going into default as soon as they hit their adjustments,'' said Rick Sharga, executive vice president of marketing at Irvine, California-based RealtyTrac.


The WSJ has an article today that highlights the breadth of the problem:

To examine the surge in subprime lending, the Journal analyzed more than 250 million records on mortgage applications and originations filed by lenders under the federal Home Mortgage Disclosure Act. Subprime mortgages were initially aimed at lower-income consumers with spotty credit. But the data contradict the conventional wisdom that subprime borrowers are overwhelmingly low-income residents of inner cities. Although the concentration of high-rate loans is higher in poorer communities, the numbers show that high-rate lending also rose sharply in middle-class and wealthier communities.

The Journal's findings reveal that the subprime aftermath is hurting a far broader array of Americans than many realize, cutting across differences in income, race and geography. From investors hoping to strike it rich by speculating on condominiums to the working poor chasing the homeownership dream, subprime loans burrowed into the heart of the American financial system -- and now are bringing deepening woe.


The WSJ article is in the free section of the paper and includes a really good interactive map. I highly recommend it.

The bottom line is pretty clear.

1.) This problem will be with us a long time.

2.) A lot of people are gong to get hurt in this.

Wednesday, October 10, 2007

Today's Markets

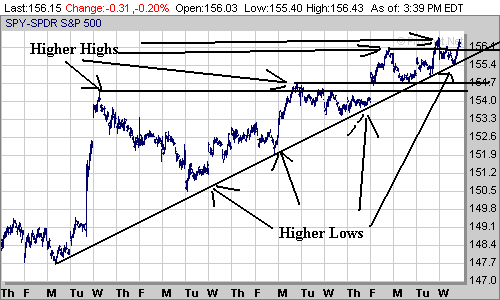
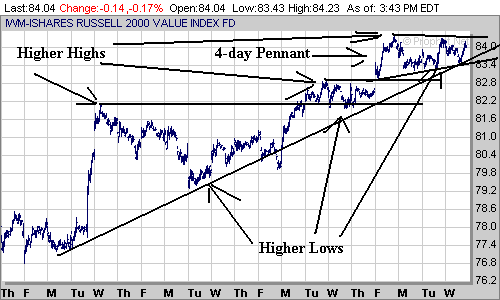
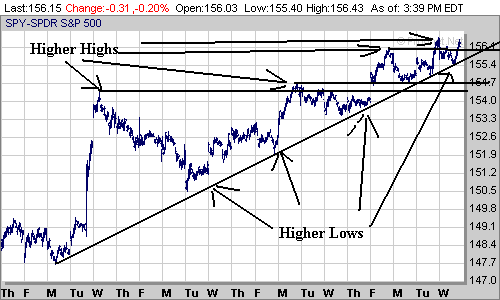
I'm going to break some tradition today. Normally, I use charts from Quotetracker, which is the market tracking software that I use. Today I'm going to use some charts from prophet.net because their daily charts go back a bit farther. The Fed lowered rates on September 18, which was 16 trading days ago. The following charts go back 20 days. They are of the SPY, IWR (mid-cap) and IWM -- Russell 2000 (small cap). All three charts show the markets are moving up along a nice trend line. All three are making higher highs and higher lows. The bottom line is since the Fed's rate cut the markets are doing well.


Will Energy Still Lead the Market?

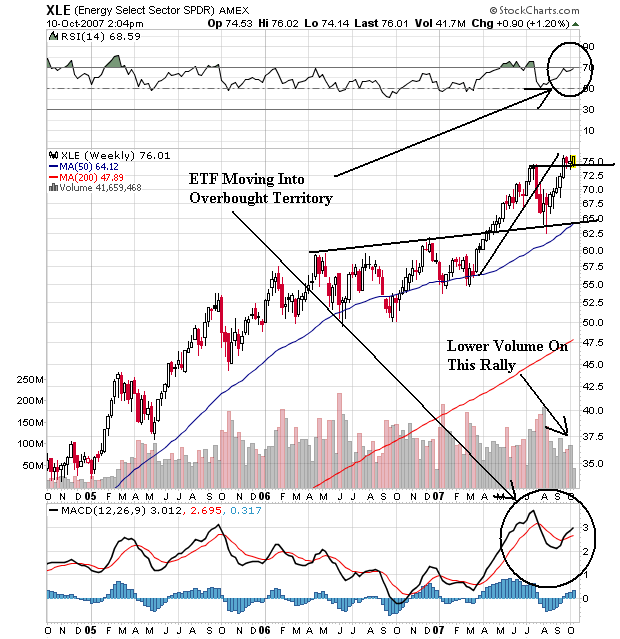
Every weekend, I go to stockcharts.com and use their performance function to look at how the bug market ETF sectors are doing. Accordingly, the energy sector (XLE) is the best year to date performer, up 29.71%.


The chart above shows that although this ETF has done well, it is in technically overbought territory. The RSI is high and the MACD is approaching levels where the ETF previously sold-off. In addition, the volume totals for this rally aren't that exciting.

That's why some news stories today make my wonder whether this sector will continue to lead the market.

From CBS.Marketwatch

Chevron Corp. shares came under pressure Wednesday after the oil giant warned investors to expect third-quarter net earnings "significantly below" the record $5.4 billion it posted in the previous quarter.

Drawing on preliminary numbers for the first two months of the quarter, Chevron late Tuesday blamed the weaker results on "a sharp decline in refined product margins for the downstream business and the impact of non-recurring items."


And Valero -- the fourth largest refiner by marketcap -- had a similar announcement today:

Valero Energy Inc. joined Wednesday the parade of big oil refiners issuing profit warnings, becoming the latest victim of higher crude prices squeezing margins.

The warning comes on the heels of similar moves by Chevron Corp, ConocoPhillips and Marathon Oil.

With oil prices of $75-$82 a barrel the norm in recent months, the cost of raw materials for makers of gasoline, jet fuel and heating oil has jumped significantly from year-ago levels, which were in the low $60-a-barrel range.


We're still early in earnings season, but this is the kind of news the usually leads to profit taking in the short-run.

A Closer Look At the Financial Sector

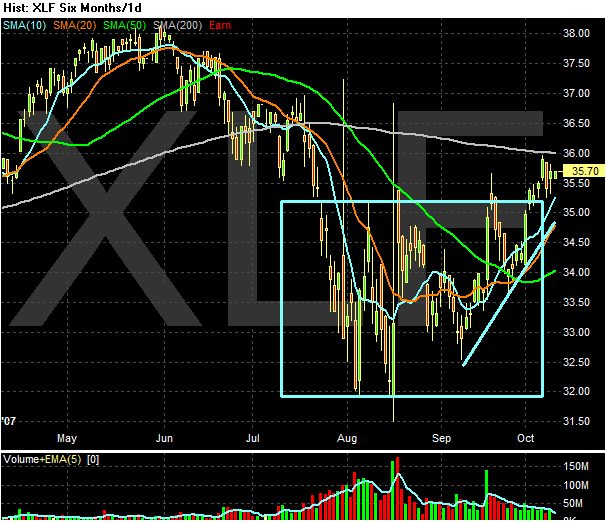
Financial companies comprise 20% of the S&P 500, and are by far the largest industrial sector. However, over the last few weeks, we have seen a lot of these companies make very negative pre-earnings announcements, largely stemming from write downs of mortgage and secured products. Let's look at some charts to see how this sector is faring in the market.


The XLFs have spent about two months trading in a consolidating range that is below the 200 day SMA. Most traders look at the 200 day SMA as the line between bull and bear markets. However, the XLFs didn't fall much below the line. Instead, they merely consolidated. Now we have what looks like the beginning of a rally in place. The price is moving up, the shorter SMAs are above the longer SMAs and we have a trend line in place. Recent news of portfolio write downs hasn't sent this sector lower. My guess is traders think this news is already factored into the price of these shares. Finally, over the last four says the ETF has formed a pennant formation, which could be a consolidation before a move over the 200 day SMA.


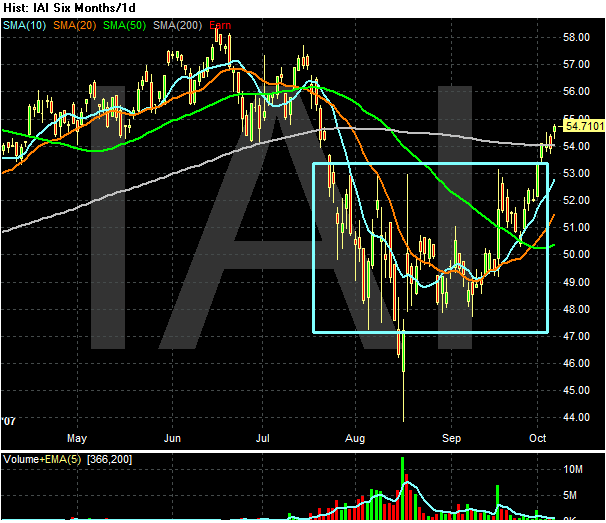
The broker dealer and insurance ETFs have the same characteristics as the XLFs with one key addition. Both of these ETFs have now moved over the 200 day SMA. This is a sign these sectors may at least be moving into a neutral market area rather than bearish.


The Regional bank ETF is the most bearish of the ETFs for two reasons.

1.) It is trading the further below the 200 day SMA.

2.) The 10 and 20 day SMA have the weakest upward angle. Frankly, both of these SMAs need better upward movement before this sector can technically recover.

Is the Credit Crunch Over?

From the WSJ:

Against the gloom that descended on credit markets, banks have pulled off a surprising feat: selling $30 billion of loans for leveraged buyouts by offering some unusual bargains. They also accepted losses on the sales.

Now comes the hard part: what to do about the other 90% of the LBO loans in the pipeline.

....

Gone, too, even more suddenly, was investor demand for the loans -- and the price for them fell in step. That left Wall Street banks such as Citigroup Inc., Credit Suisse Group and J.P. Morgan Chase & Co. holding some $400 billion in debt they had promised as financing for purchases private-equity firms had in the works globally.

Unless the pace of sales quickens in the coming weeks, banks could be stuck holding these hundreds of billions of dollars of loans for months to come -- a big risk if the economy slows and corporate profits weaken. That could reignite tensions with the private-equity firms they have agreed to finance the deals for and increase the possibility of a fire sale to unload the debt.


So far, financial companies have reported over $20 billion in losses related to the credit crunch from the summer. The question to ask now is this: "Is this a one time event, or will be keep seeing these types of write-downs for the foreseeable future?" While we don't have an answer for that yet, the amount of loans that still has to be sold (over $300 billion) indicates we're not anywhere near the end of the problems associated with the credit crunch.

Tuesday, October 9, 2007

Today's Markets

The big news today was the FOMC minutes. The general conclusion?

Wall Street advanced sharply Tuesday as investors interpreted minutes from the Federal Reserve's last meeting as indicating the central bank is ready to keep cutting interest rates to boost the economy.

The minutes from the Federal Open Market Committee's Sept. 18 meeting, when Fed governors voted unanimously to cut rates a half percentage point, also showed that officials were concerned that the weakness in the dollar could lead to higher inflation. But the Fed -- signaling it is more willing to intervene -- also said that the economic outlook was uncertain because of the summer's credit crisis, and that there were still risks to growth that justified lower rates.


Whether this is true or not, I have no idea. The Fed's stance on the economy did a 180 over the last two months, so I am not taking them at their word right now.

Be that as it may ....


The market traded in a range until the Fed Minutes came out. Then the market jumped and closed near its daily highs. Notice the big jump in volume after the Minutes came out. Traders were obviously excited by the news and felt compelled to buy into the rally.


The 10-day chart shows a nice rally taking place. The market is advancing then consolidating. This is a very bullish chart.


My main gripe with the daily chart is the declining volume on the latest rally. This usually indicates declining investor interest as the market advances, which is not a positive development. It's not a rally killer, but it is a warning. Think of it as a yellow flashing light (that we all speed through instead of slowing down for).


The QQQQ's daily chart shows a nice advance that is still progressing. Technology has the distinct benefit of not being mortgage or housing related.


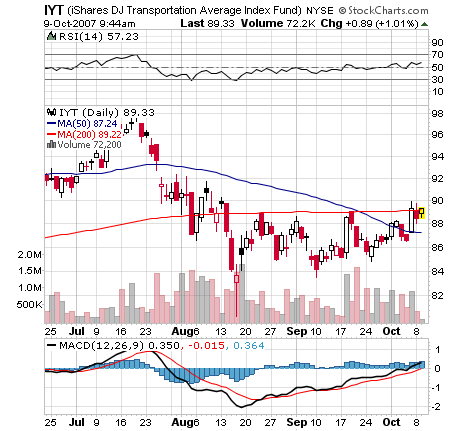
Finally, we have a 10-day transport chart, which shows very mixed trading. The Ryder news from a few days ago is obviously still important and weighing on the market.

I should add that aside from the Transports not confirming, all buy signals are pretty much green at this point. The market is clearly advancing, the moving averages are moving up and prices are above the moving averages. These are bullish charts.

Why Transports Matter, pt II

The more things change, the more they stay the same. At the end of last year, I read some of the earliest market analysts' theories (Gartley, Schabacker and Gann). It's amazing to me how relevant the analysis is to today's markets.

One of the theories that made the most sense to me was the Dow Theory, which according to Wikipedia:

In Dow's time, the US was a growing industrial power. The US had population centers but factories were scattered throughout the country. Factories had to ship their goods to market, usually by rail. Dow's first stock averages were an index of industrial (manufacturing) companies and rail companies. To Dow, a bull market in industrials could not occur unless the railway average rallied as well, usually first. According to this logic, if manufacturers' profits are rising, it follows that they are producing more. If they produce more, then they have to ship more goods to consumers. Hence, if an investor is looking for signs of health in manufacturers, he or she should look at the performance of the companies that ship the output of them to market, the railroads. The two averages should be moving in the same direction. When the performance of the averages diverge, it is a warning that change is in the air.


Sometime over the last few months, a commenter posted a really good observation. With the US becoming more technologically innovative wouldn't another average be a better confirming indicator? He suggested something along the lines of a communications average as a confirming indicator. Intuitively this also makes sense. US business is communications dependent. As business becomes busier, they will utilize more communications.

However, I still believe the transport average is incredibly important. First, the US still produces a lot of "stuff". Secondly, the US consumer is now responsible for 70% of US GDP growth and a lot of the consumer's purchases are made overseas. These consumer goods have to be transported from overseas to U.S. ports. The goods then have to be shipped from the ports to consumer markets. As a result, transport activity is still a very relevant metric of economic measurement.

That's why stories like this get my attention:

Cargo containers crammed with foreign-made goods that were supposed to set a record in August at major U.S. ports took an unexpected turn, with imports sinking 1.4% in another sign of the slowing of the economy.

Imports of items as diverse as toys and tiles could also be lower in September and October, when retailers will be stocking shelves for the holidays, because shell-shocked shoppers are expected to continue to pull back.

The falloff "reflects the consumer-demand-driven weakness in the U.S. economy," said Paul Bingham, an economist with Global Insight, a research firm that monitors cargo movements for the nation's top retailers.

The slump in oceangoing imports unloaded at the 10 largest U.S. container ports in August was the first drop since Global Insight began its monthly Port Tracker report in 2005. The number stunned some port watchers.


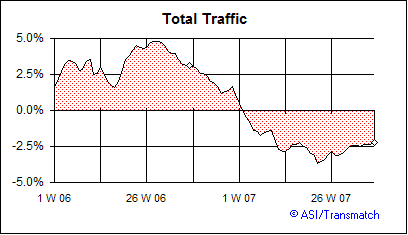
Granted, it's the first drop. But there is other news emerging from the transportation sector that indicates all is not well.

From Railfax here is the year over year percent change in total railroad traffic:


Transports importance to the economy as a whole was a central reason why Ryder's recent announcement was important:

Trucking and logistics company Ryder set off economic alarm bells Monday morning when it issued an earnings warning that it attributed to the economic slowdown spreading beyond housing and construction.

The meltdown in the mortgage and credit markets this summer, and the corresponding hit to the U.S. housing and home building markets, have been well documented by economists and investors. Many have also been anticipated that the problem may spread beyond those sectors.

Ryder, which manages and operates a fleet of more than 140,000 vehicles ranging from tractor-trailers to light-duty trucks for a wide variety of companies' transport needs, said that it is seeing a slowdown in business activity from its clients.


The bottom line is the transportation sector is sending warning signals right now. And the transportation average still isn't confirming the recent rally, which is cause for concern.

How Strong is the Labor Market Really

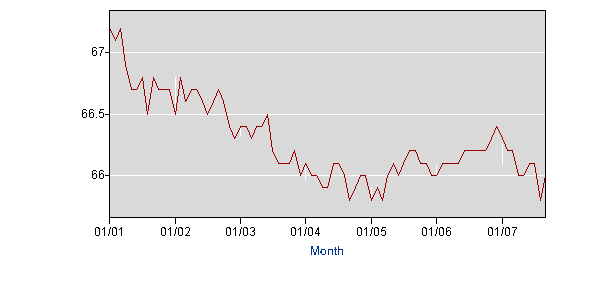
The market has concluded with that with the BLS' upward revision of August's jobs number and the 110,000 print for September everything is OK in the economy. But there are some disturbing trends underneath the headline number that indicate all is not well with the employment situation.
The labor participation rate has dropped since the beginning of the year.


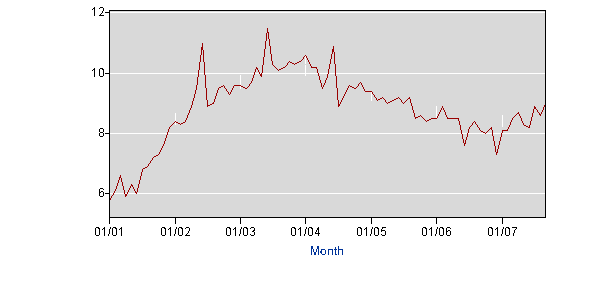
And the median duration of unemployment is increasing.


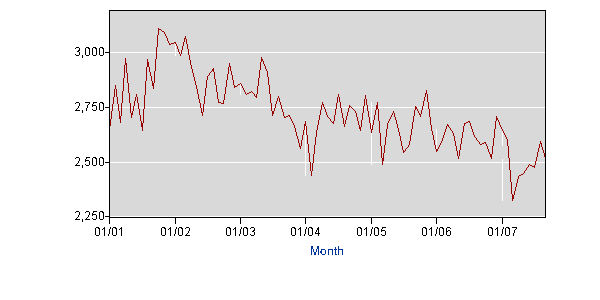
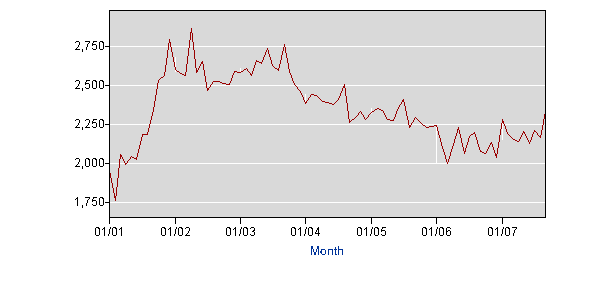
The number of people unemployed for particular periods of time is increasing as well:

Unemployed for 5 weeks and under is edging up.


Unemployed for 5 to 14 weeks


Unemployed over 15 weeks


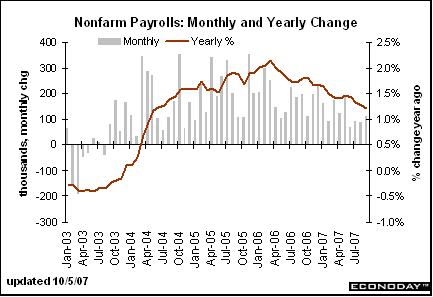
And from Econoday, we have the following chart. Note the brown line which shows year-over-year percent change.

Some Quiet Rallys In the Market

As I noted yesterday, the market action is split right now. The SPYs are hovering near highs they made a few months ago, but have not definitively made a move above those levels. That doesn't mean they won't -- just that they haven't.

However, the QQQQs are making some strong moves right now.


First, the overall average has made a good move through resistance.


Software has made a very strong move. This is a very bullish chart. The moving averages are all moving up, the closing price is above the SMAs and the short SMAs are above the longer SMAs. The only concern I have is the steepness of this chart.


The internet sector is also doing well. It has all of the same characteristics as the software sector.


The hardware and consumer electronics ETF has also made a strong advance. However, this one has more room to run. It has just moved above previous resistance.

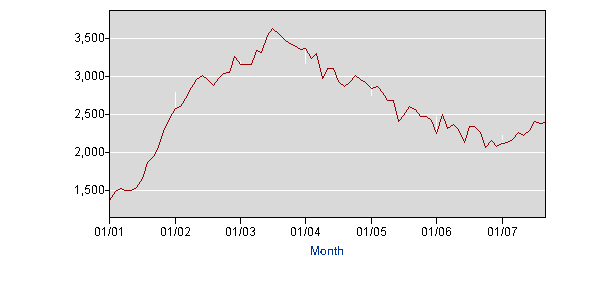
The blog Between the Hedges has been talking about the tech sector for awhile and has some good information.
Monday, October 8, 2007

Is the S&P Forming a Double Top?

From Trader Mike's Blog:

Despite the strong gains on Friday I’m still on double-top watch for the S&P 500. It’s still just teasing the all time high set in July. (and the volume is still unimpressive… but we won’t talk about that until it actually matters…)
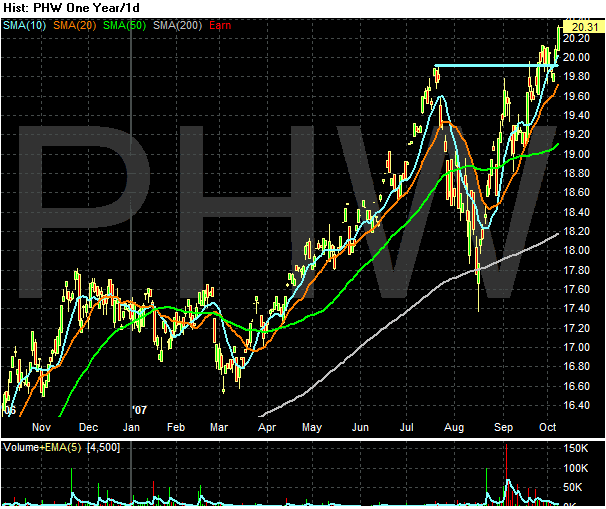

About the only thing I would add is volume has been decreasing on this leg of the rally which is a bearish development.