Saturday, June 23, 2007

It's About the Financials

Last week we had the "Bear Stearns Sell-off" in the market. As concerns increased about the situation with Bear's hedge fund, traders sold-off issues in the financial sector. There were also some other pieces of negative financial news.

Bank of America said the mortgage problems may be just beginning (Hat Tip, Calculated Risk):

Losses in the U.S. mortgage market may be the ``tip of the iceberg'' as borrowers fail to keep up with rising payments on billions worth of adjustable-rate loans in coming months, Bank of America Corp. analysts said.

Homeowners with about $515 billion on adjustable-rate home loans will pay more this year, and another $680 billion worth of mortgages will reset next year, analysts led by Robert Lacoursiere wrote in a research note today. More than 70 percent of the total was granted to subprime borrowers, people with the riskiest credit records, they said.

Surging defaults on subprime loans have pushed at least 60 mortgage companies to close or sell operations and forced Bear Stearns Cos. to offer a $3.2 billion bailout for one of two money-losing hedge funds. New foreclosures set a record in the first quarter, with subprime borrowers leading the way, the Mortgage Bankers Association reported.


Parmalat won a bankruptcy ruling against Bank of America:

It represents a defeat for holders of Parmalat bonds with some $868 million in claims, Reuters reports.

A BofA spokeswoman says the ruling is "merely the expected recognition of Parmalat's restructuring efforts by United States courts." She adds the injunction will not apply outside of the United States nor will it "impair any independent rights the bank may have against Parmalat affiliates and subsidiaries that did not restructure under Italian bankruptcy law."


Calculated Risk also highlights a fair number of credit write downs that occurred at the end of the week.

The main problem for the broader markets is financial issues comprise 21.6% of the S&P 500, giving them a slightly disproportionate impact on the index. Information technology is the next largest index sector at 14.9%. That shows the really big importance of financial issues in the S&P 500.

Here is a chart of the XLF. Bank of America is almost 8% of this index, and Merrill is about 2.75%. In other words, two financial issues that had a really bad week are about 10% of this index. That explains why the index had such a poor week.

However, the index had a bad month after the China sell-off in the spring. During that sell-off, the index used the 200 day SMA as support for consolidation. Look for the average to again test this crucial technical support area for the coming weeks as the financial sector sorts through the Bear Stearns mess.

Adding to the problems in the financial sector is existing home sales come out on Monday and New Home sales come out on Tuesday. In other words, housing will be on everyone's lips for the first part of the week.

So long as we have this problem in the financial sector it will be difficult for the S&P to advance.

However, there are also a record number of shorts in the market, which is a classic contrary indicator. Any more up will force the shorts to cover which will add to upward momentum in a rally.
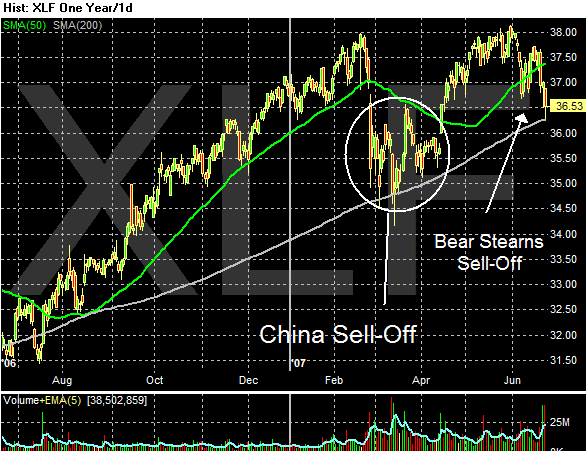
Photo Sharing and Video Hosting at Photobucket

Friday, June 22, 2007

Weekend Weimar

It's back -- the weekend Weimar. I started this when I started this blog, but have stopped doing it. Well now it's back. When you see the Weimar picture, you should know the following things.

1.) It's Friday
2.) The market is closed
3.) It's time to take a break from the economy and the markets and do anything except look at the market and economics.

So -- go outside, take a run, walk, hit the gym, watch the tube, see a movie or do whatever.

Come back tomorrow.

Photo Sharing and Video Hosting at Photobucket

About That Low Unemployment Rate....

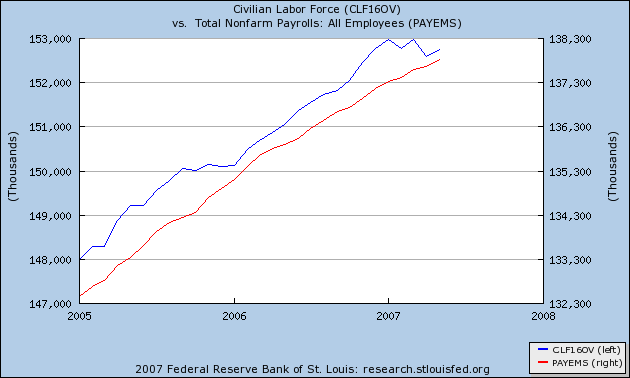
Here is a chart from the St. Louis Federal Reserve's FRED system. The blue line is the civilian force and the red line is the total number of employed according to the establishment survey. Notice the blue line has remained fairly constant for the last few months while the red line has increased. That means the low unemployment rate is partly explained by simple math rather than a really strong employment situation. That does not mean the employment situation is incredibly bad. I would guess that if you took out the skewing of the numbers you'd wind up with an unemployment rate around 5% (this is a guestimate, nothing more). However, the picture isn't as rosy as implied by the numbers either.

Photo Sharing and Video Hosting at Photobucket

Food Prices Increasing

The Big Picture calls it agflation. I think that's a really good title because it explains the concept very clearly and succinctly. The bottom line is food prices are in the news again:

May food prices rose 4.7% from a year earlier, according to the latest consumer price index. The cost of eating out rose only slightly less.

The Agriculture Department said consumer food prices will rise 3% to 4% this year, notably faster than last year's 2.3% gain.

Tighter world grain supplies on top of extra ethanol demand could send those numbers even higher.

That's straining some of the equilibrium in markets that are used to a little more wiggle room, analysts say.

"We could be adding to the mix a supply problem," said Darin Newsom, a commodities analyst at DTN in Omaha, Neb. "We could have both situations going on this summer where we have long-term demand change and the short-term supply problems. It could get very interesting over this summer until we get a better handle in late August or early September on what's actually been produced."


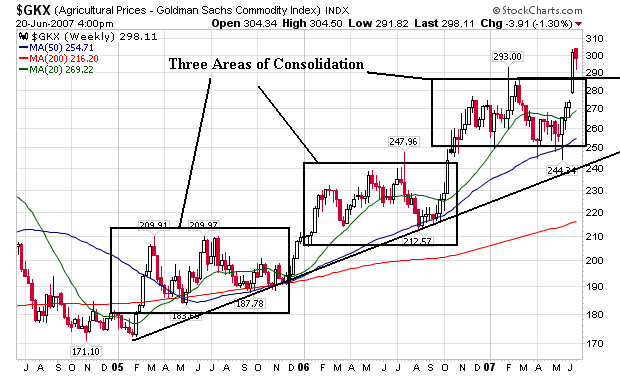
Yesterday we looked at the Goldman Sachs Agricultural index. Let's throw-up the long-term chart again to get an idea of what we're looking at.

Photo Sharing and Video Hosting at Photobucket

Short version -- this chart indicates agricultural prices are increasing and have been for the last 2.5 years.

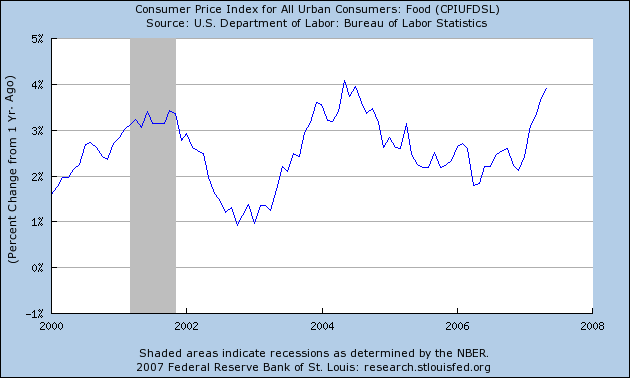
Here's a chart of food prices from the St. Louis Federal Reserve's FRED system. Notice the recent spike in activity:

Photo Sharing and Video Hosting at Photobucket

If anything, this situation completely debunks the notion of looking only at core inflation.

More on Bear Stearns Fallout

From Bloomberg:

``The demise of two Bear Stearns managed Leveraged Mortgage Funds could be the tipping point of a broader fallout from subprime mortgage credit deterioration that would lead to cascading de-leveraging and ultimately ending with higher rates to new mortgage borrowers,'' New York-based analysts at Bank of America Corp. including Robert Lacoursiere wrote in a report published today.


Let's translate this sentence.

Mortgage securities 101: Loan originators sell the vast majority of their mortgage loans to firms that securitize loans. This means that securities firms take similar mortgages (same coupon, length to maturity etc...) and place them in giant pools of mortgages. By giant, we're talking $10 million minimum and usually quite a bit larger.

This pooling of assets is assumed to diversify the risk. Suppose there is a pool of $100 million mortgages. Out of this pool of $100 million, there is one loan worth $100,000 that is delinquent. Because this $100,000 loan is so small in relation to the $50 million pool (it is .01%), this one loan's underperformance won't effect the overall performance of the entire pool.

However, let's say there are 10, $100,000 loans that are delinquent. Now about 1% of the entire pool of mortgages are underperforming. This means we could start to have a problem with the entire pool of mortgages.

There is no universal point at which an amount of underperforming loans automatically impact the performance of the overall pool of mortgages. Each mortgage pool is unique onto itself.

Let's extrapolate this information to the bigger picture.

Delinquencies are increasing. As a result, there are more loans in mortgage pools that are underperforming. That means a larger number of mortgage pools may be experiencing problems. This is what the paragraph is talking about. The possibility that the number of underperforming/delinquent loans is starting to impact the entire industry is increasing. Bond 101: increasing risk = increasing interest rates. If someone is going to lend a high credit risk borrower money, the lender will ask for more interest as compensation for the increased risk.

Thursday, June 21, 2007

Are Things Picking Up?

There have been 5 manufacturing surveys released in the last month. Below are some excerpts from each one to get an idea for where various manufacturing regions are.

Philadelphia Fed sees increases:

The survey’s broadest measure of manufacturing conditions, the diffusion index of current business activity, increased from 4.2 in May to 18.0 this month, its highest reading since April 2005 (see Chart). The percentage of firms reporting increases (40 percent) exceeded the percentage reporting decreases (22 percent). Demand for manufactured goods, as represented by the survey’s new orders index, showed notable improvement this month. The new orders index rose 10 points, to its highest reading since March 2006. The current shipments index fell four points but remained positive. Indexes for delivery times and unfilled orders, although remaining negative, improved from their May readings and are at their highest readings this year.


Empire State Survey Sees Growth:

The Empire State Manufacturing Survey indicates that conditions for New York manufacturers improved significantly in June. After three months of lackluster readings, the general business conditions index bounced up 18 points, to 25.8.

The new orders and shipments indexes also rose. The prices paid index climbed several points, while the prices received index fell. Employment indexes were marginally positive. Future indexes indicated a high level of optimism for the six-month outlook, while capital spending and technology spending indexes dropped markedly.


Kansas City Sees a Slight Decline:

Growth in Tenth District manufacturing activity eased slightly in May but remained solid, and expectations for future factory activity were not as strong as in the past two months. The price indexes in the survey climbed higher, largely as a result of increasing energy prices, particularly gasoline.

The net percentage of firms reporting month-over-month increases in production in May was 20, down from 26 in April but up from 8 in March (Tables 1 & 2, Chart). Production decelerated slightly at both durable- and non-durable-goods-producing plants. The year-over-year production index climbed slightly higher, while the future production index declined from 41 to 30.


Richmond Fed Still In the Red:

Manufacturing activity in the central Atlantic region continued to decline in May, according to the Richmond Fed’s latest survey. Respondents reported that the weakness in factory shipments moderated and they noted greater declines in employment, new orders and backlogs. In addition, capacity utilization and delivery times edged slightly lower, and manufacturers reported somewhat slower growth in inventories.


There is also the Chicago Purchasing Managers Index, which rebounded sharply in the latest survey

So, we have three good, one fair and one terrible. That seems to fall in line with today's release of the leading economic indicators:

The Conference Board's index of leading indicators, a gauge of the economy's direction, rose 0.3 percent in May after a 0.3 percent drop the prior month. The Philadelphia Federal Reserve Bank's factory index jumped to the highest in more than two years in June.

The six-year expansion, which slowed to an annual pace of 0.6 percent last quarter, is gaining new life as companies increase investment. Economists are raising forecasts and predict growth this quarter will exceed 3 percent.

``The winter blahs for the economy seem to have receded,'' said Neal Soss, chief economist at Credit Suisse Group in New York, who correctly forecast the gain in the leading indicators. ``One of the most reassuring features of the economy has been job growth, and we expect that to persist.''


It looks like the economy will pull out of the .6% growth rate in the next few quarters. However, there are a few wild cards. The obvious one is housing. So far, the decline in the housing market has not impacted consumer spending. We'll have to see if that continues. There are still about two years worth of resets out there in mortgage land, so we're nowhere near out of the woods.

In addition, gas is really expensive right now. Last year the economy accepted the higher prices, but that was a different economic situation. Last year's "not too expensive gas prices" may become this year's "gas is too expensive" prices.

Employment is picking up, but it is not a hot bed of activity. Last month the economy added 157,000 jobs. This is OK, but not something to write home about.

And then there are bond yields. While I have argued they aren't anywhere near cost prohibitive levels, the market sure seems to think so. My guess is the market has gotten use to extremely favorable financing levels, but will some to the realization that 5% - 5.5% is nowhere near a catastrophe.

Finally there is the Fed. The market finally listened to what they were saying and realized the Fed is more concerned about inflation right now. If the economy picks-up some steam and the Fed is still concerned about inflation they may consider hiking rates to contain inflation. However, that move would be at least a quarter of decent growth away if not two. So while it's a possibility, it's not a possibility that will happen until say the beginning of the fall at the earliest.

Merrill Backs Away From Selling CDOs

From Bloomberg:

Merrill Lynch & Co. backed away from a threat to dump about $850 million of securities it seized from Bear Stearns Cos. hedge funds, according to a person with knowledge of the firm's plans.

Merrill sold a small portion of the collateralized debt obligations through an auction, said the person, who declined to be identified because the decision hasn't been announced. The firm plans to hold onto the remaining securities for now, the person said, without being more specific.

The decision removes the risk that a large amount of securities would be liquidated immediately. Merrill set the sale in motion to reclaim its loans to the two hedge funds, which had posted losses of as much as 20 percent by betting on CDOs. The plan may have confirmed that other funds were overvaluing their holdings of similar securities, potentially causing a chain reaction of writedowns causing billions in losses.


If this story is true and Merrill backs away from selling these securities, the market can breath a huge, collective sigh of relief. In short, Merrill blinked. They knew what would happen if the sale went through and the prices they received were really low. They didn't want to be responsible for that carnage in the market. They will simply hold onto their losses for now.

However, the problem is still out there. There are a ton of CDOs and other risk management tools out there is various portfolios that are probably mispriced. I doubt this is the last time we're going to have a story like this is the financial press.

The Market's Underlying Strength and Money Supply

From the WSJ:

In just the past few years, the markets have been tested by turmoil in the automobile sector, rising global interest rates, a weakening dollar and the housing slowdown. They quickly bounced back after brief spasms of risk-aversion in every case. The last bout of jitters was just this past February, when problems in the subprime mortgage sector sparked brief selling.

Ample amounts of cash in the hands of investors -- something investment pros call liquidity -- and a growing confidence in the market's resilience, have helped them to overcome worries. But some investors wonder if this case could be different.

"The fear is that this Bear situation is the tip of the iceberg and it could lead to other funds being liquidated," said Todd Clark, director of stock trading at Nollenberger Capital Partners Inc. in San Francisco.


This article makes a very good point. The US financial markets have the ability to withstand big financial strains. One the article does not mention is the housing slowdown of the last year. The market's have more or less ignored that one completely outside of housing stocks.

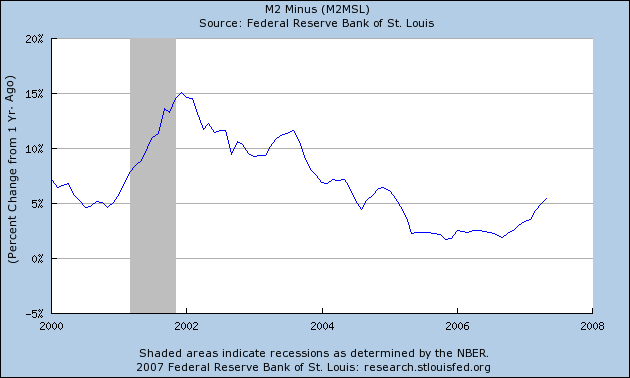
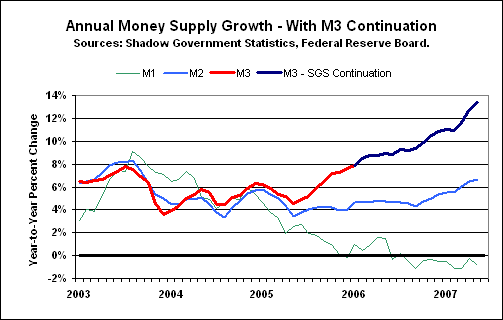
As for money supply, there's still a ton of liquidity out there. Here's a chart of the YOY change in M2 minus small time deposits from the St. Louis Fed. Notice how this indicator started to increase about the same time market's started to rally.

Photo Sharing and Video Hosting at Photobucket

Here's a chart of M3 from Shadow Stats.

Photo Sharing and Video Hosting at Photobucket

Short version, there's a ton of money out there chasing the market.

Agricultural Prices Increasing

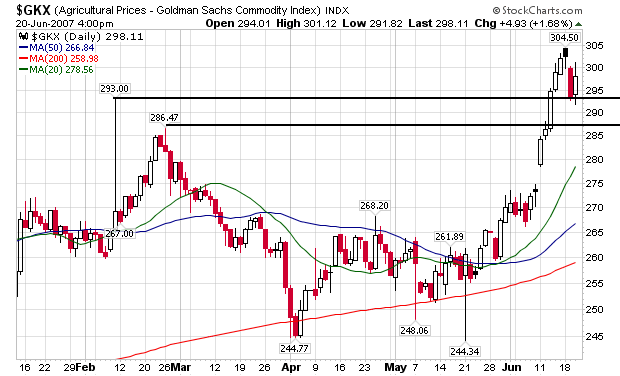
The Big Picture has a story at the top of the blog on agricultural prices. It's been awhile since we looked at those charts, so lets see what a chart of the Goldman Sachs Commodity Index looks like.

Here's the daily chart:

Photo Sharing and Video Hosting at Photobucket

Prices have spent the last 3-4 months consolidating right around the 260 level. But they have increased since then, moving above resistance at 293. All of the moving averages are rising. However, the price level is pretty far above the 20 day SMA. This implies the market may consolidate or move back to those levels.

Here's the weekly chart:

Photo Sharing and Video Hosting at Photobucket

Notice there are three areas of consolidation that last at least nine months each. These provide a solid area of support for the moves upward. Also note the 50 and 200 day SMA are moving up. The 20 day SMA is also increasing, but that indicator has stalled in a range right now.

Short version -- agricultural prices are increasing. And there are a lot of technical and fundamental reasons for this increased to at least remain the same or move higher.

More of "Why the Bear Stearns Hedge Fund Story is So Important"

From Bloomberg:

Merrill Lynch & Co.'s threat to sell $800 million of mortgage securities seized from Bear Stearns Cos. hedge funds is sending shudders across Wall Street.

A sale would give banks, brokerages and investors the one thing they want to avoid: a real price on the bonds in the fund that could serve as a benchmark. The securities are known as collateralized debt obligations, which exceed $1 trillion and comprise the fastest-growing part of the bond market.

Because there is little trading in the securities, prices may not reflect the highest rate of mortgage delinquencies in 13 years. An auction that confirms concerns that CDOs are overvalued may spark a chain reaction of writedowns that causes billions of dollars in losses for everyone from hedge funds to pension funds to foreign banks. Bear Stearns, the second-biggest mortgage bond underwriter, also is the biggest broker to hedge funds.

`More than a Bear Stearns issue, it's an industry issue,'' said Brad Hintz, an analyst at Sanford C. Bernstein & Co. in New York. Hintz was chief financial officer of Lehman Brothers Holdings Inc., the largest mortgage underwriter, for three years before becoming an analyst in 2001. ``How many other hedge funds are holding similar, illiquid, esoteric securities? What are their true prices? What will happen if more blow up?''


This reminds me of the Japanese bank problem that started in the late 1980s/early 1990s. Banks had a ton of assets that were not continually repriced as the market decreased. Instead, the banks had assets on their books that reflected a higher price. As the value of those assets decreased, the value of banks collateral decreased as well. Eventually, the problem was dealt with, but it took 10+ years of major problems in the Japanese economy for the problem to get corrected.

This problem is directly related to the problems in the housing market:

CDOs were created in 1987 by bankers at now-defunct Drexel Burnham Lambert Inc., the home of one-time junk-bond king Michael Milken. Sales reached $503 billion in 2006, a five-fold increase in three years. More than half of those issued last year contained mortgages made to people with poor credit, little loan history, or high debt, according to Moody's Investors Service.

.....

Not since 1994 have mortgages with past due payments been so high, according to first-quarter data compiled by the Federal Deposit Insurance Corp., the agency that insures deposits at 8,650 U.S. banks. Lehman analysts estimated in April that the collateral backing CDOs had fallen by $25 billion.


One of the reasons for the big increase in the mortgage market over the last 10 years (and pretty much the last 25) is the creation and development of the Mortgage-back securities market. This market has created a ton of liquidity which allows an increase in mortgage underwriting.

CDOs are theoretically an insurance policy against a blow-up in the mortgage industry. However, these investments have never been tested by a real problem in the market. That does not mean they won't work as advertised. It simply means that the market has never tested them.

People are understandably worried about how these hedging tools will perform if the market goes belly-up.

Merrill's decision yesterday to accept bids on $800 million of bonds it took as collateral for its loans further stifled trading in CDO securities, said David Castillo, who trades asset- backed, commercial-mortgage and CDO bonds in San Francisco at Further Lane Securities.

``Nobody wants to look at the truth right now because the truth is pretty ugly,'' Castillo said. ``Where people are willing to bid and where people have them marked are two different places.''


The real question is "why is Merrill doing this?" They most likely have a dog in this hunt somewhere and know the real stakes involved -- a massive repricing across the hedge fund universe that would have a negative impact on a ton of investors. My initial thought is Merrill is using this as a negotiating tactic so they can talk to Bear from a position of strength and exact some major concessions. However, I am sure there are other possibilities.

Wednesday, June 20, 2007

Gas Prices Fall For Another Week

From This Week in Petroleum

For the fourth consecutive week, the U.S. average retail price for regular gasoline decreased, falling 6.7 cents to 300.9 cents per gallon as of June 18, 2007. Prices are 13.8 cents per gallon higher than this time last year. All regions reported price decreases. East Coast prices dropped 4.6 cents to 297.6 cents per gallon. The largest regional decrease was in the Midwest, where prices fell 8.9 cents to 298.4 cents per gallon, while prices for the Gulf Coast decreased 5.9 cents to 290.3 cents per gallon. Rocky Mountain prices fell 4.4 cents to 318.1 cents per gallon but remain 33.8 cents per gallon above last year's price. West Coast prices were down 7.7 cents to 318.8 cents per gallon. The average price for regular grade in California was down 8.4 cents to 323.6 cents per gallon.


The good news in this report is gas and oil stockpiles are increasing. And gas production is finally at strong levels as well. However, gas demand is also 1.71% higher than the same time last year.

I doubt we're going to see gas prices drop much below last years levels at this point, which means consumers will get hit with high gas bills for the next 2-3 months. That means we could see a dent in lower-income based consumer behavior at stores like Wal-Mart an Dollar General.

Why the Bear Stearns Story is So Important

From Bloomberg:

``The real fear has to do with just how many other funds and warehouses could be in trouble,'' said Jeremy Shor, who oversees about $3 billion in asset-backed bonds as a portfolio manager at Brown Brothers Harriman & Co. in New York. A warehouse is a credit line extended to funds to buy the securities.


And that's where the real potential problem lies. I don't know why this story broke publicly. However, it did and it highlighted the problem with one hedge fund.

But this isn't the only fund out there. And the real question now becomes, "how many other problems are out there waiting to happen?"

FedEx Reports Earnings

From Reuters:

Package delivery company FedEx Corp. (FDX.N: Quote, Profile , Research) on Wednesday reported a profit and gave a quarterly forecast that missed expectations, citing slowing U.S. economic growth, but a solid full-year outlook sent its stock up more than 2 percent.

"The weakened industrial sector is currently limiting demand for transportation services," Chief Executive Officer Frederick Smith said in a statement. "But we expect the U.S. economy to begin to show modest year-over-year improvement in the late summer to early fall time frame."

The Memphis, Tn.-based company said net income for its 2007 fiscal fourth quarter ending May 31 rose 7 percent to $610 million, or $1.96 a share, compared with $568 million, or $1.82, a year earlier.


My guess is this is the blueprint for upcoming earnings releases. They will follow this blueprint:

1.) Earnings were a bit weaker than expected.
2.) Weaker earnings are to be expected when the economy hits a soft patch.
3.) Although earnings were weaker they are still positive, just not by as much as we would like.
4.) Things look like they are picking up.
5.) By the end of the year things should be fair to good.

Right now the evidence suggests a mild second part of the year. On the negative side we have housing and the trade deficit subtracting from growth. On the positive side we have consumer spending, an uptick in business activity and strong business real estate investment. Employment is fair but not great.

It's important to reiterate what this release says about Dow Theory. Dow theory says that transports and industrials have to confirm each other. If business is more profitable they will have to ship more stuff. The reverse is also true. FedEx is one of the largest shippers on the planet, so their earnings give us a good guide to what is happening in business. Fed Ex's net increase 7% -- not great, but not bad either. People are shipping, but not in as large a number as a few months ago.

From a market perspective, releases like this would indicate a range bound market, which would also coincide with the summer doldrums. Earnings aren't bad enough to sell, but not strong enough to buy.

Mortgage Market May Take A Big Hit This Week

Today's WSJ has an article the gives more detail about the Bear Stearns hedge fund that is having problems in its mortgage portfolio.

First, here's the root of this hedge fund's problems.

On Wall Street, the Bear Stearns hedge funds' problems point to another sensitive issue: Markets for exotic investments like derivatives linked to subprime mortgages have exploded in size in the past few years, but it is often hard to attach an accurate value to those assets.

Last month, Enhanced Leverage reported that its value fell 6.75% in April after the fund's bets on the mortgage market went wrong. Two weeks later, it put the loss at 18%, spooking already-nervous investors and creditors and sending many of them running for the exits.

The huge revision at least in part reflected conversations Bear Stearns hedge-fund managers had with bond dealers, three of which told them in late April that some of the funds' assets were worth less than the values stated on the funds' books, according to a person familiar with the matter.

......

Unlike stocks and Treasury bonds, whose prices are continually quoted and easily obtained, many of these derivative instruments trade infrequently and don't have clear market prices. To come up with market values for these investments -- a process known as "marking" their positions to market -- investment funds often rely on their own valuation models.


While the bond market is liquid -- that is you can usually buy and sell securities freely -- it's more of a market where the individual players negotiate price on a regular basis. When I was a bond broker, portfolio managers would call dealers every month to get a quote on all the bonds in their portfolio for end of the month pricing (I'm assuming this is still the practice, but I haven't been in the market for over 5 years so it could have changed). This means there wasn't a central market where managers could simply pull up a screen and get a market-wide accepted quote. As a result, bond portfolio values have some play in them.

Notice the huge drop in the value of Bear's portfolio holdings over a two-week period. The drop in value went from 6.75% to 18%. That's a really big drop.

"There's some real concern about how realistic dealer quotes are," said Andrew Lo, a finance professor at the Massachusetts Institute of Technology who is also a principal in AlphaSimplex Group LLC, an asset-management company that also runs a hedge fund. "You're talking about quotes during normal times that are very different from quotes during stress times."

There is no indication that Bear Stearns's fund managers sought to mislead lenders or investors about the value of the funds. Indeed, the firm's approach to valuing its securities seems to be in line with guidelines set up by Moody's Investors Service, which evaluates hedge-fund practices. But the crisis does point to the kinds of valuation problems hedge funds and their investors or lenders can run into, even when they follow sound practices.

A forced sale of the Bear Stearns funds' assets now could trigger a broader repricing of mortgage-backed bonds and lead to losses and margin calls -- demands for additional cash or collateral -- at other funds. That prospect might have given some of Bear Stearns's lenders, which include Merrill, Citigroup Inc. and Barclays PLC of Britain, an incentive to help out the funds. But Merrill and others decided to bail out of the funds yesterday.


These paragraphs are very important.

1.) There doesn't appear to be any deliberate wrongdoing.
2.) Hedge Funds were pricing their securities based on a liquid market that had confidence in the value of the securities it traded. Now it appears that model was too optimistic when it came to the actual value of the bonds it traded.
3.) Because Bear is selling the underlying securities over the next few days, the market will get actual prices from buyers and sellers. These will be far more accurate than the prices based on models.
4.) The prices Bear gets for the bonds it sells may be below the prices on the books.
5.) This could force other hedge fund to reprice their mortgage portfolios at lower prices.
6.) If the repricing is severe other hedge funds could have the same problems that Bear is having, essentially creating a ripple effect throughout the industry.

I want to caution on a few points:

1.) This is not financial Armageddon. Securities markets are incredibly resilient and are almost always able to deal with stressful events like this.
2.) That being said, this could be an incredibly stressful event for all the players involved.
3.) We had the sub-prime shakeout earlier this year. A ton of sub-prime players went belly-up or sold portfolios. This could be the beginning of a shake-up in the hedge fund industry with similar results. We're going to have to watch this situation very carefully to see what happens.

Tuesday, June 19, 2007

Merrill Will Sell MBS

From the WSJ:

A day after managers of a troubled internal hedge fund at Bear Stearns Cos. presented lenders with a last-ditch plan to reinvigorate the fund with additional financing, creditor Merrill Lynch & Co. pushed forward with plans to sell hundreds of millions of dollars in collateral assets out of the fund, said traders late Tuesday.

Merrill has indicated plans to sell off at least $850 million worth of collateral assets, mostly mortgage-related securities, Wednesday afternoon, according to documents reviewed by the Wall Street Journal. Those plans come amid efforts by the Bear fund managers to stave off liquidation by lining up $1.5 billion in new credit from parent company Bear Stearns and an additional $500 million in new equity capital. The managers spent Tuesday trying to finalize those financing arrangements.

An auction Wednesday could come as a blow to the fund, known as the High-Grade Structured Credit Strategies Enhanced Leverage Fund, because it could spur additional sales of collateral assets from other worried dealers. A string of asset seizures would likely force the dissolution of the fund, and could effectively drag down the prices of similar securities in the market, creating losses at other Wall Street firms. On the other hand, a handful of successful trades might still pull the troubled fund out of harm's way, and Merrill could yet change its plans, as it has done once before.


Merrill is one of the primary broker dealers that deal directly with the government. That means their trading desk is large and very connected. Right now there are tons of calls going out to accounts about this sale.

However, it could also backfire on Merrill if they don't get the prices they want. If that happens, expect problems to ripple through the mortgage markets.

Best Buy's Net Income Drops 18%

From the AP


Profit for the quarter ended June 2 dropped to $192 million, or 39 cents per share, from $234 million, or 47 cents per share, in the same period a year ago.

Revenue rose 14 percent to $7.93 billion, from $6.96 billion last year.

Analysts polled by Thomson Financial expected a profit of 49 cents on revenue of $7.85 billion.

Same-store sales, or sales in stores open at least 14 months, grew 3 percent during the quarter.


Increasing revenue + decreasing net income = margin compression. This means the company is making less money on what it sells. Compressing margins means the company has less room for internal error. It also means the company has work to do because from the company's perspective it is selling the wrong mix of products.

This is not a conscious effort from consumers; they are not going into the store and saying to themselves, "I want to buy products that make Best Buy less money." What's happening is consumer's tastes and preferences are changing to items that make the company less money. Now the ball is in Best Buy's court to find a mix of products that increases their margins.

The reason for following Best Buy is simple: they are the largest consumer electronics store by a large margin. Their market capitalization is $22.9 billion and their next largest competitor is Gamestop at $6.2 billion. In other words, BBY dominates the industry, so their overall fortunes give a strong indication of what may be happening in this industry. It also gives us an idea of what may be happening with the consumer.

Housing Starts Drop

From Bloomberg:

Housing starts in the U.S. fell in May, signaling the slump in home construction will continue to depress growth.

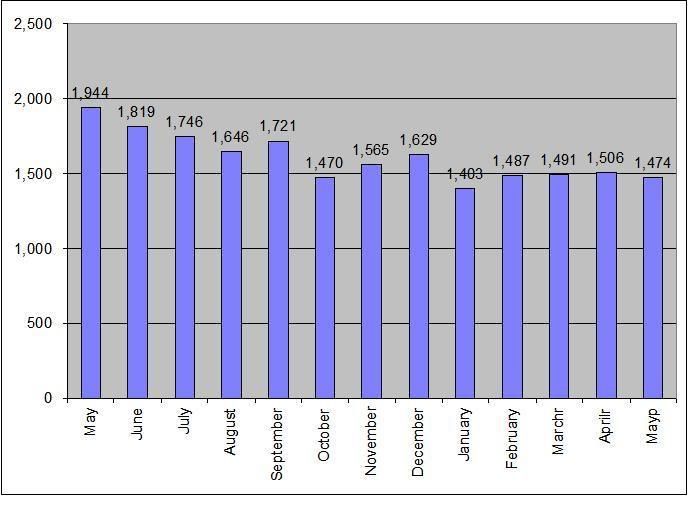
Builders broke ground on new houses at an annual rate of 1.474 million, down 2.1 percent from 1.502 million the prior month, the Commerce Department said today in Washington. Building permits rose 3 percent to 1.501 million from 1.457 million.

Lower prices and more incentives have failed to spur interest as buyers wait for even bigger bargains, leaving builders with a glut of unsold properties. A jump in mortgage rates and stricter rules to qualify borrowers with poor credit ratings, known as subprime customers, may reduce demand even more in coming months, economists said.

``There is still some more downside to the housing market,'' said Nariman Behravesh, chief economist at Global Insight Inc. in New York. ``Mortgage rates started up again and there is still a shakeout going on in subprime.''


Here's a chart of housing starts. Notice that although this months figures were down, total starts have stabilized over the last 5 months at 1.4 - 1.5 million/year. That does not mean housing starts will stay at these levels. But for now the market has found equilibrium.

Photo Sharing and Video Hosting at Photobucket

Oil Prices Fall From Highs

From Bloomberg:

Crude oil fell from near a nine-month high in New York as some traders speculated recent gains that followed unrest in Nigeria were unjustified.

Nigeria's two main oil unions said yesterday they planned to join a general strike scheduled to start tomorrow. In addition, Chevron Corp. and Eni SpA reported raids on facilities in the West African nation, Africa's biggest oil producer.

``How much these situations are priced in is hard to measure,'' said Wolfgang Kraus, chief energy and commodities trader at BayernLB in Munich. ``The fact is that the market is willing to react to negative headlines, so the risk is there.''

Crude oil for July delivery fell as much as 35 cents, or 0.5 percent, to $68.74 a barrel in after-hours electronic trading on the New York Mercantile Exchange. It traded at $68.75 at 9:24 a.m. in London. The contract jumped $1.09, or 1.6 percent, to $69.09 a barrel yesterday, the highest close since Sept. 1 and the fourth straight day of gains.


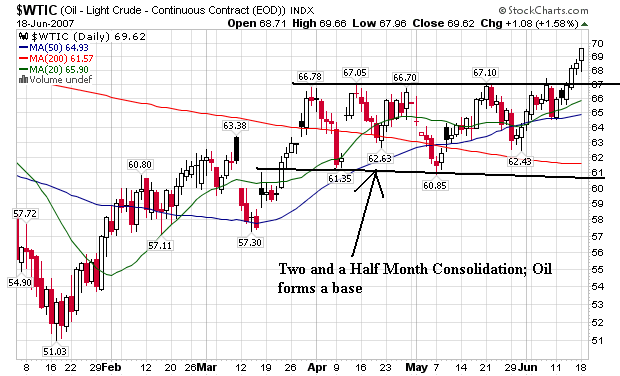
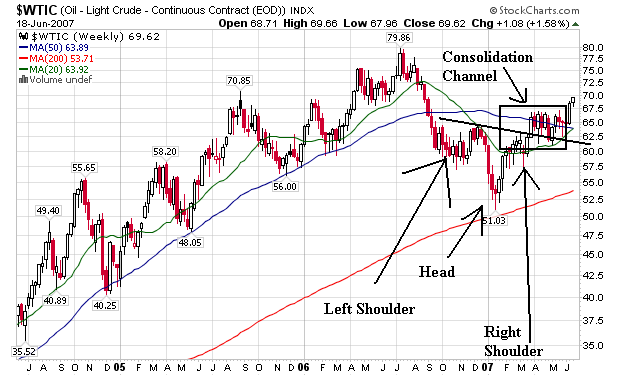
It's been awhile since we've looked at the oil chart, so let's see what the chart says.

Photo Sharing and Video Hosting at Photobucket

The most striking feature of this chart is the two and a half month consolidation that occurred between roughly $61 and $67. Anytime you see a channel that is anywhere up to about 10%, think consolidation channel/forming a base (10% is simply a best guess rule of thumb). That's exactly what he have here.

Let's pull the lens back to the weekly chart to see what it looks like.

Photo Sharing and Video Hosting at Photobucket

Notice he have an upside down head and shoulders formation forming since October of last year. In addition, the recent consolidation occurred just above the head and shoulder's neckline. And we have the 20 day SMA just about to cross the 50 day SMA. In other words, we've got a lot of technical reasons for the market to move higher or remain at these levels.

All of this occurred right before the summer driving season. We also know from the Department of Energy that gasoline demand is up and refineries are just now getting up to snuff for gasoline production. And while gas prices have fallen for the last three weeks, they are still 17 cents above year-ago levels.

On top of this, recent price increases are due to geopolitical tensions -- another wild card in the oil market.

So, we have strong fundamental reasons for oil to remain at these levels plus strong technical reasons for oil to remain at these levels.

Monday, June 18, 2007

Homebuilder Confidence Drops

From Bloomberg:

Confidence among U.S. homebuilders fell this month to the lowest since February 1991 as interest rates climbed and delinquencies surged.

The National Association of Home Builders/Wells Fargo index of sentiment declined to 28 this month from 30 in May, the Washington-based association said today. Readings below 50 mean most respondents view conditions as poor. Economists surveyed by Bloomberg News forecast the gauge to stay unchanged this month.

Homebuilders including Hovnanian Enterprises Inc. are losing money as they cut prices to stem a slide in sales amid stricter standards for getting mortgages. Builders have scaled back projects to work off bloated inventories, a sign housing construction will weigh on growth for the rest of the year, economists say.

``There will be continuing declines in home building through the second half'' of this year, said Robert Mellman, an economist at JPMorgan Chase Corp. in New York. ``If rates hadn't gone up, we would have expected it would have stabilized. We've put off the stabilization in housing until early next year.''


Any frankly, why should anyone in the housing market be bullish right now? Interest rates are increasing, foreclosures are increasing, inventory levels are at generational highs, consumers are in debt up to their eyeballs, credit standards are tightening ... I could go on, but I think you get the picture.

Dow Theory, P&F Charts And the Current Market

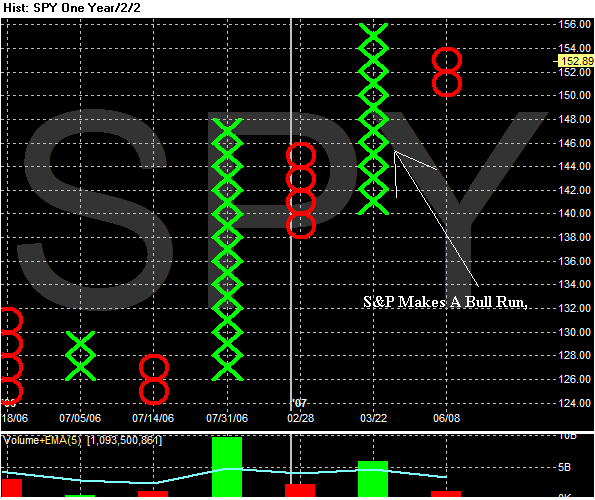
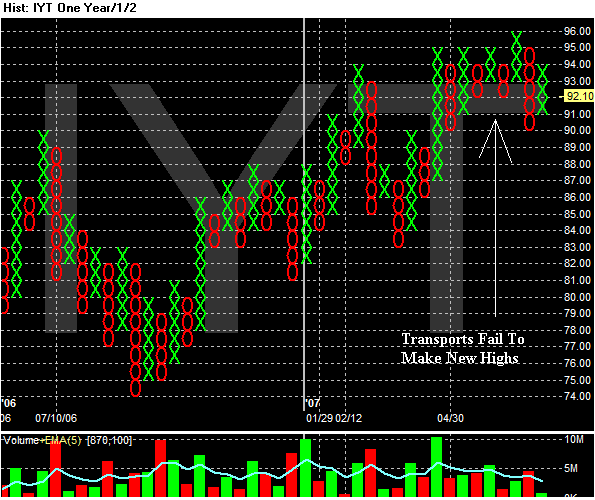
Below are two P&F Charts of the IYTs (Transports) and the SPYs (S&P 500). Notice something very important. As the SPYs were making new highs, the transports weren't. Standard Dow theory states the transports and the major indexes have to confirm each other. The underlying theory is deceptively simple. If business prospects are increasing, businesses will increase the amount of transportation they use.

However, the transports are continually bumping into resistance.

Photo Sharing and Video Hosting at Photobucket

Photo Sharing and Video Hosting at Photobucket

Retail Sales Explained

From Hank Greenberg:

Big boost in May retail sales? Consumer not really hurt? High gas prices irrelevant. How's this for an explanation? Tax refunds. Now, back to your regularly scheduled programming.


Wow -- something I totally overlooked along with just about every other analyst out there. And a really good point.

Yields Aren't Prohibitive Yet

This is from BCA Research. It is solely their opinion, and I am sure divergent opinions exist. However, it's worth considering.

Rising bond yields impact stock prices in two ways. One being the real economic effect where a backup in yields causes growth to slacken and profits to drop, thereby placing downward pressure on stocks. The other is via a discounting factor. All else being equal, rising yields reduces the fair value of equities. However, our Global Investment Strategy service noted in its latest weekly bulletin, that even if 10-year Treasury yields were to hit 6%, stocks would still fail to become expensive compared to other competing assets. This message is consistent with our view that global equities would still be inexpensive compared with bonds if yields rose another percentage point in aggregate. Bottom Line: Recent equity market weakness should not be viewed as anything more than a bull-market correction. Further weakness is likely, but buying on dips is the right strategy.


This analysis furthers my argument that 5% - 6% yields on the 10-year Treasury aren't as alarming as the market has been thinking they were.

However, if someone finds a counter-argument, please let me know by posting it in the comments. I am open to changing my mind if the argument is solid.

Interest Rates, Corporate Profits and Economic Growth

This paragraph from a WSJ article got me thinking:

Tom Sowanick, chief investment officer for investment manager Clearbrook Financial LLC's Clearbrook Research unit, says concerns that rising rates will hurt corporate stocks may be overblown. He notes that since its June 2003 trough, the yield on the 10-year Treasury note has climbed two percentage points, and the yield on the two-year note has risen nearly four percentage points. During the same period, he says, the S&P 500 has risen 64%, while the Russell 2000 Index, a measure of small-stock performance, is up 95%.


Let's look at a few points.

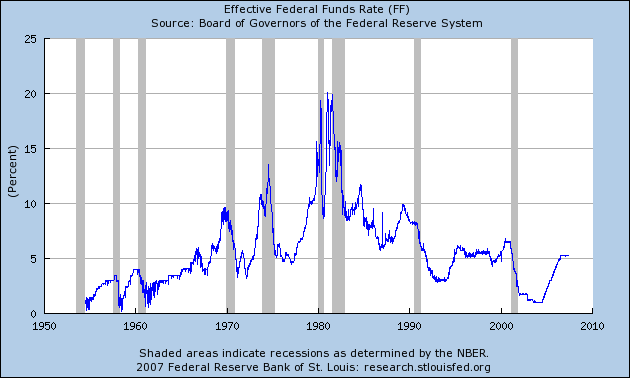
1.) US interest rates are rising from generational lows. Here is a chart of the effective Federal Funds rate. Notice it is rising from the lowest levels of a generation.

Photo Sharing and Video Hosting at Photobucket

So -- while interest rates are increasing, it's important to remember where they're rising from: the lowest rates we'll see in our lifetime.

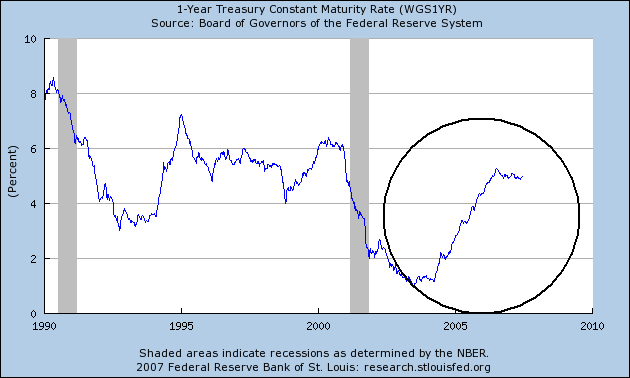
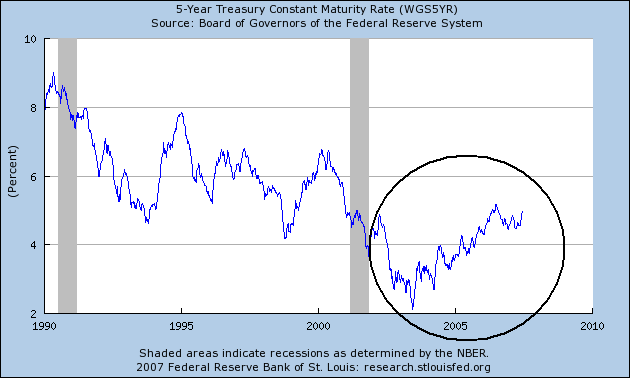
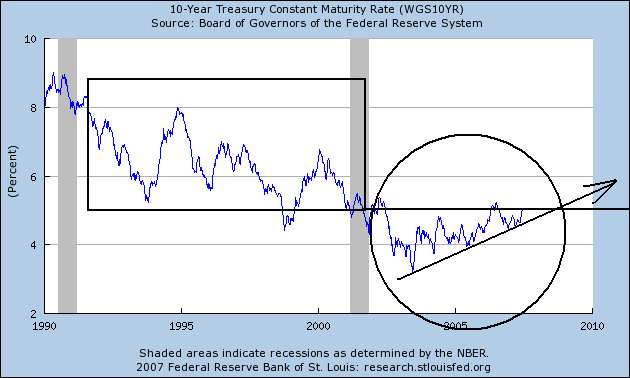
2.) The 1, 5 and 10 year constantly maturing Treasury Bonds have all been rising for the last few years with no impact on corporate profits.

1-Year Treasury

Photo Sharing and Video Hosting at Photobucket

5-Year Treasury

Photo Sharing and Video Hosting at Photobucket

10-Year Treasury

Photo Sharing and Video Hosting at Photobucket

I've added a few more points to the 10-year chart. First, notice current yields are just now approaching and broaching the lowest levels of the preceding expansion's interest rate levels. In the 1990s expansion corporate profits grew just fine. So some of the concern may be overblown.

In addition, most companies have very strong balance sheets and have already locked-in lower borrowing costs:

There are several reasons the initial shock over higher Treasury yields has quickly worn off. For starters, most corporate debt is locked in for the long term, and won't roll over for years -- as long as a decade for some companies with investment-grade bonds outstanding.

At the same time, many companies are so flush with cash after several years of booming profits that increased borrowing costs won't make a big difference at this point. Excluding financial companies, components of the broad Standard & Poor's 500-stock index have enough cash on hand to buy back 40% of their outstanding long-term debt, S&P says.


However, notice that 10-year rates are clearly increasing and will probably maintain that course for the foreseeable future. In other words, the rising rate story will probably be with us for the remainder of this expansion.

Most of the interest rate stories over the last few weeks have an implied premise: there is an inflection point in interest rate levels above which rising rates have an increasingly negative impact on corporate growth. I think this is more of a sliding scale, where an increasing level of rates by x% will lower corporate profits by y% or something to that effect. In addition, I don't think current interest rate levels are so high as to inhibit profit growth. The main factor causing slower profit growth is a slowing US economy, not higher interest rates.

Moody's Downgrades Sub-Prime Bonds

From the WSJ:

On Friday, credit-rating firm Moody's Investors Service slashed ratings on 131 bonds backed by pools of speculative subprime loans because of unusually high rates of defaults and delinquencies among the underlying mortgages. The ratings company also said it is reviewing 247 bonds for downgrades, including 111 whose ratings it had just lowered. All the bonds were issued as recently as last year.

The latest moves by Moody's affected around $3 billion worth of bonds, which represent less than 1% of the over $400 billion in subprime mortgage-backed bonds that were issued in 2006. Still, it was the most aggressive action taken yet by any of the ratings companies -- which some critics say have been slow to address the housing downturn -- and could weigh on the already fragile subprime bond market. Some investors may be forced to sell bonds whose ratings were cut to "junk" from "investment-grade," and some may have to write down the values of the downgraded bonds in their portfolios.


There's good and bad news in this report. The good news is it only effects less than 1% of the sub-prime market. The bad news is this is the first wave of downgrades which is probably going to increase over the coming year.

This move by Moody's may be the start of a second wave of problems in the sub-prime market. The first occurred earlier this year when there was a wave of bankruptcies in the lender section of the sub-prime market. This move by Moody's may be the first shot in a second wave of problems focusing on the investor segment of the sub-prime market.

The index which tracks the sub-prime market is taking a tremendous hit:

On Friday, an index that tracks risky subprime bonds plunged to an all-time low of 60.95. The ABX index was above 97 at the start of this year. In February it dove to a low of 62 before rebounding somewhat to 72 by mid-May.

"Negative sentiment took a firm hold of the [subprime bond] market" this past week, J.P. Morgan analysts said in a report Friday. "We think the weakness in the ABX will continue." The analysts also noted that the recent steep rise in yields on 10-year Treasury bonds, which in turn pushes up long-term mortgage rates, would make it difficult for subprime borrowers to refinance into fixed-rate loans.

Data from the Mortgage Bankers Association last week showed a record number of homeowners entered the foreclosure process during the first quarter. Delinquency rates on subprime loans have soared to 13.77% from 11.5%, and the association's chief economist, Doug Duncan, said delinquencies will peak only later this year, while foreclosures may not peak until next year.


Predictions of a peak in the housing market decline have been very wrong. I tend to think that the problems won't stop even early next year.

The good news here is this is a situation that is ripe for vulture investors -- investors who buy assets that are clearly in trouble with the intention of making a profit further down the line. Right now securities in the sub-prime market are getting cheaper and cheaper. I would guess they would start to make money in say 5 years or more. An investor with that kind of time line and the patience to wait that long is going to find some excellent deals in this market right now. The question then becomes when will these investors start to buy and and at what level.

Sunday, June 17, 2007

Excerpts From Barron's Interviews, Pt 2

These are the second set of interviews from the article linked to below.

Archie McCalister offers his assessment of the coming year:

I see 2½% inflation, 2½% GDP growth and profits up maybe 6% or 7% on the year. The S&P 500 trades for just under 17 times earnings. It is a stockpicker's market -- the kind of market I like. When they're selling everything, it's no fun, and when they're buying everything, you can't make a difference. I thought the market would be flat this year, and it is up incredibly. By year end, who knows?

At least you're honest.

If you take a longer-term view, stocks are not that expensive.


I think his assessment of economic growth and inflation is very possible by December. While housing will continue to really hit GDP growth for the remainder of the year, there are other areas of the economy that -- as Mario Gabelli said -- will provide ballast and keep the economy from sinking into a recession.

John Neff offers this overview:

I'm using $100 for S&P 500 earnings in 2008, which would mean a gain of about 8%, based on my '07 estimates. The market sells for 15.3 times my '08 number, which isn't outlandish, particularly relative to the alternatives. The bond market doesn't look attractive, and commercial real estate has had an awfully good move and in some cases looks overdone. The stock market looks OK until we have a recession. An 8% increase in earnings and a 2% dividend yield give you a total return of 10%. That's attractive. A couple of things bother me, though.

Such as?


One is the abundance, if not overabundance, of private-equity deals and leveraged buyouts. You're creating a great deal of debt among target companies, and inviting the possibility of some sort of accident, given that higher leverage. Also, I'm bothered by the outrageous investment fees charged by so-called hedge funds. Twenty percent of profits and 1% or 2% of assets in fees is outlandish in terms of a money manager's ability to succeed by enough of a margin to make a good return for the shareholder. It's just too much to give away. Some funds are going to have to take bigger risks, which could lead to bad headlines that disturb the confidence of the market, as "Wrong-Term" Capital Management did in the 1990s. Having said all that, the subprime-mortgage problem was bad, but didn't affect the market's confidence or performance. I'm still in the market, though I've taken something off the top since stocks moved up. The accounts I manage are 11% to 15% in cash. I can't find anything to buy. But stand by.


Neff is an old hand at investment management. One of the Money Mangers books profiled him back in the late 1980s or early 1990s.

Neff is in agreement with many managers in stating the market isn't cheap but not expensive.

I found his observations about hedge funds very astute and interesting. What he's saying is fund managers are charging fees that are so high they will either prevent solid performance or force managers to take on disproportionate risks to the portfolio. For example, a manager may place too large a bet on a single company or asset class and have the trade backfire, causing tremendous losses for the entire portfolio. Classic investment management says to not put all of your eggs in one basket -- in essence, to diversify.

Marc Faber offers a very sanguine assessment of the overall situation:

Faber: The economies of the rest of the world have been very strong in the first five months of 2007, whereas U.S. consumption has slowed. If GDP and the rate of inflation were measured properly, we would see the U.S. already has reached the no-growth stage, but with some inflation -- in other words, stagflation. The housing downturn has hurt consumers, and retail sales have been disappointing. If nominal GDP is 6% and inflation is 2%, you get 4% real growth. But if inflation is 5%, you get only 1% growth. In other ways, too, the world has a dual economy. A lot of money flows into the pockets of affluent people, as evidenced by the continued rise of London property prices, art prices at auctions, fine wines and so forth. The economy of the middle class and the workers is not doing particularly well.

What does this mean for the stock markets of the world?

The U.S. stock market, like all other asset markets, is in cuckoo land. We have bubbles everywhere, which hasn't happened before. The 19th century saw occasional bubbles in canals and railroads. Share prices entered a bubble in 1929; gold, silver and oil in 1980, and Japan and Taiwan in 1989. In 2000 there was a huge bubble in one sector: TMT, or technology, media and telecommunications. This time around, since 2002, everything has gone up: home prices, real estate and art prices, stock prices, commodity prices and even, until recently, bonds.

We are going to see a gradual narrowing of the bubbles, or perhaps they will all break at the same time. The Dow Jones industrials and the S&P 500 are in an incredible bubble phase. For foreign investors, the rise in the S&P mostly has been offset by weakness in the dollar, so U.S. assets aren't terribly expensive relative to other assets. Sure, the market sells for only 15-16 times forecast earnings. But if you take out the gains in energy and financial-sector earnings, the market is selling above 20 times earnings. Given that you can buy a two-year Treasury note yielding 5%, that is not an attractive valuation. I would rather be a seller of the stocks around the world than a buyer here.


Faber is one of the few money managers who notices or mentions issues of social equity. There has been a fair amount of press about income stratification in the US, and all of the signs are it has increased for the duration of this expansion.

Abbey Joseph Cohen offers this assessment:

When we revised our estimate of operating earnings to $93 from $92, we also adjusted our year-end S&P price target modestly, to 1600 from 1550. First-quarter earnings came in stronger than we had expected, which gave us a higher baseline. More important, 2008 looks to be another year in which inflation is under control and economic growth continues. Toward the end of 2007, investors should be willing to pay for '08 results. That was our main motivation for 1600; the comparable number on the Dow Jones Industrial Average is 14,000. If our numbers are right, total returns this year, including dividends, will be about 15%.

You're more optimistic than most.

Our forecast is a reflection of several things. The market began the year at attractive valuation levels, whether you look at multiples of earnings or sales, or comparable metrics. This is not a market that looks overdone. Our valuations are based on dividend-discount and discounted-cash-flow models. We use eight different mathematical assumptions that we think are reasonable. We are not reaching for the stars, and in some cases we try to be overly conservative. For example, even though intermediate and long-term interest rates have gone up in the past few weeks, they are still below the numbers built into our models. Also, we plug in earnings-growth estimates that are well below historical trends.

Many people who were concerned about 2007 pointed out properly that earnings growth would be slowing. Therefore, they couldn't see how stocks would go much higher. Our position has been different; we thought this might be a long-lasting economic expansion, in which case you could have a period of moderate growth and share prices still could rise. Historically inventory corrections bring U.S. economic cycles to an end, but inventories are under control. The expansion of the late 1990s was brought to an end through too much enthusiasm for business investment. That is not happening now. Globally, most established economies are experiencing moderate growth, and core inflation doesn't seem to be rising rapidly.


Like others (including myself) she does not see the market as overvalued. In addition, she points out that earnings growth in the first quarter was stronger than expected. This means that forward looking estimates are now based on a higher earnings number going forward. This is where the increase in earnings is coming from.