... you can find Crude Oil news at The Oil Drum ... mixed in with a wide range of Peak Oil and New Energy Technology news, some of it at a very high level of technical sophistication ... and also that special post-apocalyptic Mad Max spice that sometimes enters into the discussion threads.
This week's This Week In Petroleum, in particular, has a very cogent discussion on understanding what is going on with gasoline prices ... and how the decline of gasoline prices last fall is one of the principle driving forces for the rise in gasoline prices that we are going to be experiencing over the next few weeks to months.
Saturday, May 19, 2007
Thursday, May 17, 2007
Bonddad On Mini-Vacation
I am signing off until Monday. Bonddad and Bonddad's girlfriend are going to San Diego for some R&R. I am not taking a computer, I am not answering my cell phone (save for my niece and Dad), I am not reading a newspaper, nor am I watching the news.
I will see y'all on Monday morning, bright and early.
Have a safe weekend.
I will see y'all on Monday morning, bright and early.
Have a safe weekend.
Leading Indicator Drops
From the Conference Board:
I made it a habit of not looking at leading/sentiment indicators because I didn't think they were very good at predicting. However, some research from Merrill Lynch (I'm a client) proved me wrong. The LEI index is actually pretty good at forecasting the next 3-6 months.
Here's a chart from Martin Capital that shows the Leading, Coincident and Lagging indicators from the Conference Board:
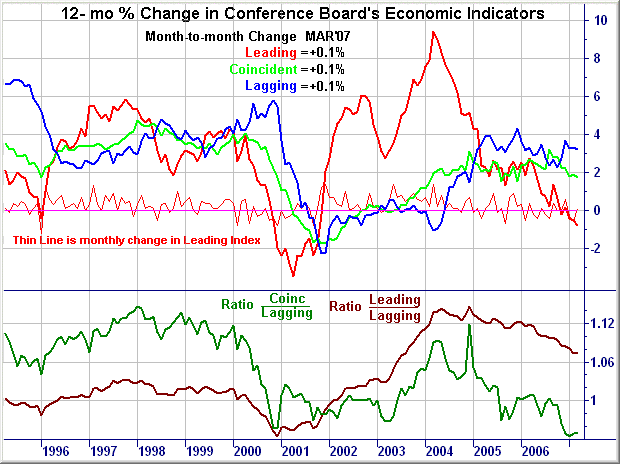
* The leading index decreased in April, and the small March increase was revised up as actual data for manufacturing new orders for nondefense capital goods became available. The leading index declined or remained the same in three of the last six months. As a result, from October to April, the leading index fell 0.2 percent (a -0.4 percent annual rate). In April, housing permits made the largest negative contribution, but the weaknesses among the leading indicators have been somewhat more widespread than the strengths over the past few months.
* The coincident index increased again in April, the third consecutive gain. From October to April, the coincident index rose by 0.7 percent (a 1.3 percent annual rate). In April, all four coincident indicators contributed to the gain and the largest contribution came from industrial production followed by personal income. The coincident index grew at an average annual rate of about 2.5 percent in 2006, but its growth has moderated to about a 1.5 to 2.0 percent average annual rate in the first four months of the year.
* The leading index is 0.7 percent below its April 2006 level. In the second half of 2006, the leading index was essentially flat from July through November, followed by a small pick up in December, and it is now slightly below its October level. At the same time, real GDP grew only at a 1.3 percent annual rate (advance estimates) in the first quarter of 2007, following a 2.5 percent rate in the fourth quarter of 2006. The recent behavior of the composite indexes suggests that economic growth is likely to continue to be slow in the near term.
....
The leading index now stands at 137.3 (1996=100). Based on revised data, this index increased 0.6 percent in March and decreased 0.6 percent in February. During the six-month span through April, the leading index decreased 0.2 percent, with three out of ten components advancing (diffusion index, six-month span equals thirty percent.)
I made it a habit of not looking at leading/sentiment indicators because I didn't think they were very good at predicting. However, some research from Merrill Lynch (I'm a client) proved me wrong. The LEI index is actually pretty good at forecasting the next 3-6 months.
Here's a chart from Martin Capital that shows the Leading, Coincident and Lagging indicators from the Conference Board:

Wal-Mart Hedges On Outlook
From CBS Marketwatch:
Let's look at those three factors in a bit more detail.
1.) Income: According to information from the Bureau of Labor Statistics, the average hourly earnings of production workers rose about 1% after adjusting for inflation from April 2006 to April 2007. I use this figure for Wal-Mart customers because the information from the BEA has figures for executives whereas the average hourly earnings of production workers is focused on the lower 80% of the US workforce.
For the duration of this expansion the increase is even worse. In November 2001, the average hourly pay of non-supervisory workers was $14.72. This increased to $17.25 in the latest survey for an increase of 17.18%. Inflation level increased from 177.4 to 206.86 over the same period for an increase of 16.51%, making the real increase in non-supervisory wages .67% since this expansion began.
Combine this 1% yearly increase and .67% expansion increase with a national savings rate that's been negative for over a year and high consumer debt levels and you can see why Wal-Mart's core customer group may slow down purchases. Their pay isn't increasing much after inflation, they're drawing down their savings (if they have any) to spend and they're already heavily in debt.
2.) Inflation: this is where the ridicules obsession with the "core rate" of inflation really comes into the spotlight. Wal-Mart's customers -- along with every other person in this economy -- consumers food and energy. While the YOY numbers aren't bad, they are still very visible every day at the grocery store and the gas pump. In addition, inflation is hitting key items. For example, the ethanol obsession is increasing corn prices, which is increasing milking cow's feed prices, which is increasing milk prices. The point here is consumers are seeing key food products increase in price at uncomfortable rates.
3.) Gas prices are at a nominal, all-time high -- before the summer driving season. See this post for more detail.
Wal-Mart has some problems that are self-made. But their core customer hasn't seen a meaningful pay increase for the duration of this expansion and is seeing gas and food prices (those annoying non-core elements of inflation) increase at an uncomfortable level. No wonder Wal-Mart had a terrible April.
Wal-Mart Stores Inc. said Tuesday that first-quarter earnings rose 8%, as robust results from the retailer's growing international division and at its warehouse stores offset persistent problems in its core U.S. stores.
The world's largest retailer also signaled that second-quarter results could fall short of expectations. Moreover, Wal-Mart said it would put greater emphasis on its "everyday low prices" to boost traffic and sales.
Bentonville, Ark.-based Wal-Mart saw its shares slip fractionally to close at $47.62 on the New York Stock Exchange.
.....
The retailer has blamed disappointing U.S. sales on a number of issues in recent quarters -- from disruptions tied to store-remodeling efforts to misreading consumers' desires. But Tuesday it narrowed its list of factors to three related financial concerns that Scott said currently face Wal-Mart customers:
* General money or income worries.
* Inflation's effect on consumers' budgets.
* Escalating prices at the gas pump, which Wal-Mart has long called the biggest factor affecting the purchasing decisions of its core customers.
Gasoline prices at the retail level have risen nearly 40% since the end of February, and on Monday the American Automobile Association said that the cost of filling up a vehicle had hit an all-time high.
Let's look at those three factors in a bit more detail.
1.) Income: According to information from the Bureau of Labor Statistics, the average hourly earnings of production workers rose about 1% after adjusting for inflation from April 2006 to April 2007. I use this figure for Wal-Mart customers because the information from the BEA has figures for executives whereas the average hourly earnings of production workers is focused on the lower 80% of the US workforce.
For the duration of this expansion the increase is even worse. In November 2001, the average hourly pay of non-supervisory workers was $14.72. This increased to $17.25 in the latest survey for an increase of 17.18%. Inflation level increased from 177.4 to 206.86 over the same period for an increase of 16.51%, making the real increase in non-supervisory wages .67% since this expansion began.
Combine this 1% yearly increase and .67% expansion increase with a national savings rate that's been negative for over a year and high consumer debt levels and you can see why Wal-Mart's core customer group may slow down purchases. Their pay isn't increasing much after inflation, they're drawing down their savings (if they have any) to spend and they're already heavily in debt.
2.) Inflation: this is where the ridicules obsession with the "core rate" of inflation really comes into the spotlight. Wal-Mart's customers -- along with every other person in this economy -- consumers food and energy. While the YOY numbers aren't bad, they are still very visible every day at the grocery store and the gas pump. In addition, inflation is hitting key items. For example, the ethanol obsession is increasing corn prices, which is increasing milking cow's feed prices, which is increasing milk prices. The point here is consumers are seeing key food products increase in price at uncomfortable rates.
3.) Gas prices are at a nominal, all-time high -- before the summer driving season. See this post for more detail.
Wal-Mart has some problems that are self-made. But their core customer hasn't seen a meaningful pay increase for the duration of this expansion and is seeing gas and food prices (those annoying non-core elements of inflation) increase at an uncomfortable level. No wonder Wal-Mart had a terrible April.
Housing's Situation in a Nutshell
From the WSJ:
And this at a time when banks have tightened credit standards.
"Overbuilding finally looks to have stopped, but the Herculean task of making any genuine inroads into the record supply overhang ... is only just beginning," BNP Paribas economist Richard Iley said in a note to clients.
And this at a time when banks have tightened credit standards.
Wednesday, May 16, 2007
Gas Prices Continue to Increase; Hit Record High
From This Week in Petroleum:
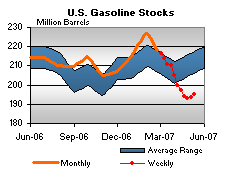
The good news is inventories have turned the corner -- or at least they have stopped dropping like a stone:
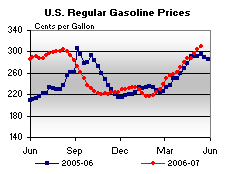
However, here is a chart of prices. Notice they are higher than the same time last year.
There are two issues here.
1.) We are at the beginning of the summer driving season. Will prices continue to increase throughout the summer?
2.) What will be the impact on consumer spending? We saw a terrible retail month in April. Wal-Mart posted their worst decline in 28 years. I have to think high gas prices were partially responsible. If prices continue to increase, will we continue to see a drop in consumer spending?
For the third consecutive week, gasoline prices were up, increasing 4.9 cents to 310.3 cents per gallon as of May 14, 2007. Prices are 15.6 cents per gallon higher than this time last year and have now reached an all-time nominal high. All regions reported price increases. East Coast prices were up 2.3 cents to 298.1 cents per gallon. In the Midwest, prices jumped 9.8 cents to 317.2 cents per gallon, while prices for the Gulf Coast rose 4.5 cents to 291.5 cents per gallon. The largest increase was in the Rocky Mountains, where prices increased 10.3 cents to 319.3 cents per gallon. West Coast prices were up 0.5 cent to 337.8 cents per gallon. The average price for regular grade in California was down 1.1 cents to 345.0 cents per gallon, but remains 12.0 cents per gallon above last year's price.
The good news is inventories have turned the corner -- or at least they have stopped dropping like a stone:

However, here is a chart of prices. Notice they are higher than the same time last year.

There are two issues here.
1.) We are at the beginning of the summer driving season. Will prices continue to increase throughout the summer?
2.) What will be the impact on consumer spending? We saw a terrible retail month in April. Wal-Mart posted their worst decline in 28 years. I have to think high gas prices were partially responsible. If prices continue to increase, will we continue to see a drop in consumer spending?
Industrial Production Increases
From the Federal Reserve:
Final production of consumer goods and business equipment increased .9%.
Manufacturing increased .5%
The report continued with these strong points:
Short version -- this is a damn good report.
Industrial production increased 0.7 percent in April after a decrease of 0.3 percent in March. Output in the manufacturing sector moved up 0.5 percent in April; the increase was led by advances in motor vehicles and parts and in high-technology goods. The output of utilities increased 3.5 percent; temperatures were relatively warm in March but fell below seasonal norms in April. Mining output decreased 0.3 percent in April. At 113.0 percent of its 2002 average, overall industrial production for April was 1.9 percent above its year-earlier level. The rate of capacity utilization for total industry rose 0.4 percentage point, to 81.6 percent, a level 0.6 percentage point above its 1972-2006 average.
Final production of consumer goods and business equipment increased .9%.
Manufacturing increased .5%
The report continued with these strong points:
All major market groups recorded increases in April. The output of consumer goods rebounded 0.9 percent after having fallen 0.8 percent in March. Production of consumer durables expanded 2.1 percent in April. Apart from the strength in automotive products, the output of home electronics climbed 4.8 percent because of gains in computers produced for households and in audio and video equipment. Also within consumer durables, the indexes for appliances, furniture, and carpeting and for miscellaneous goods increased. Within consumer nondurables, the output of non-energy goods edged up 0.2 percent, as a decline in foods and tobacco was more than offset by increases in clothing, in chemical products, and in paper products. Among consumer energy products, an increase in residential sales by utilities outweighed a decline in the output of fuels.
The output of business equipment moved up for a third consecutive month in April; an increase of 0.9 percent was led by gains in transit equipment and in information processing equipment. The rise of 1.9 percent in transit equipment was supported by increases in truck production and continued strength in civilian aircraft. Information processing equipment rose 0.9 percent because of output gains in electromedical equipment and in computers produced for businesses. The output of defense and space equipment rose 1.0 percent after having decreased 2.3 percent in March; this increase reflected a return to work in April at a shipyard affected by a recent strike. The output of construction supplies increased 0.4 percent in April. The output of business supplies advanced 0.7 percent because of strength in the production of medical supplies and in commercial sales of gas and electricity.
The production of materials moved up 0.6 percent in April, as gains in both durable and energy materials outweighed a decline in nondurable materials. Within durables, the output of equipment parts rose 1.3 percent; the output of semiconductors advanced for a second consecutive month. The output of consumer parts also increased 1.3 percent; the rise was boosted by increases in the indexes related to motor vehicle parts and steel. The production of other durables increased 0.5 percent. Within nondurable materials, the production of both textiles and chemicals fell, while the output of paper materials remained unchanged. The production of energy materials recovered 0.8 percent in April after having declined 2.4 percent in March.
Short version -- this is a damn good report.
Federated Earnings Disappoint
Because of Wal-Mart's recent April performance (the worse monthly drop in 28 years), I've started to keep an eye on the retail
From CNBC:
Note the size of the miss -- 11 cents a share. While some of that was expected, analysts watching the company were also expecting it, meaning the difference between expectations and actual is still pretty important.
In addition, note that sales slipped .1%. It's not a big drop, but a nonetheless. It's also important to note Federated is the fourth largest department store by revenue. That makes this pretty important.
Considering the .2% drop in retail sales last month, this shouldn't surprise anyone. However, we need to keep a close eye on retail sales figures going forward.
From CNBC:
For the three months ended May 5, net income was $36 million, or 8 cents a diluted share, compared with a loss of $52 million, or 9 cents a share, a year earlier.
Excluding merger integration costs, profit from continuing operations was 16 cents a share, up from 1 cent a year ago.
These results were lower than analysts were expecting. According to Thomson Financial, Federated was expected to earn 19 cents a share.
Sales slipped 0.1% to $5.92 billion from $5.93 billion last year, missing estimates for $5.99 billion.
...
Federated, which also operates the Bloomingdales' chain, took a charge of $22 million, or 5 cents a share, to cover costs of converting regional department stores gained in the May acquisition to its flagship Macy's brand.
"Sales in the new Macy's locations were disappointing in the quarter," Chief Executive Terry Lundgren said, in a statement. However, he was "pleased" with sales at premerger Macy's and Bloomingdale's locations.
Note the size of the miss -- 11 cents a share. While some of that was expected, analysts watching the company were also expecting it, meaning the difference between expectations and actual is still pretty important.
In addition, note that sales slipped .1%. It's not a big drop, but a nonetheless. It's also important to note Federated is the fourth largest department store by revenue. That makes this pretty important.
Considering the .2% drop in retail sales last month, this shouldn't surprise anyone. However, we need to keep a close eye on retail sales figures going forward.
Housing Starts Increase
From Bloomberg:
Let's break this number down from a couple of different angles.
1.) Last months figure was revised down. That means this months increase is a bit larger in relation. It also means this months number could be revised down as well.
2.) Building permits decreased 8.9%. That means the starts number is a blip on a downward trajectory.
3.) My guess is this number was slightly higher than anticipated because of weather related issues. That is, starts were down a in February because of weather, so March was skewed higher. That is just conjecture on my part.
Here's a link to the report at Census.
The report highlights a few interesting points.
Single units make-up 80% of the number. This number increased 1.6%. However, multiple units -- 5 or more housing units -- increased 6.4%. While this number makes up 17% of the total market, it may be a sign that builders are shifting to larger projects (read rentals).
Housing starts in the U.S. unexpectedly rose last month, while building permits dropped to the lowest in almost a decade, signaling the increase in construction may be short lived.
Builders broke ground on new dwellings at an annual rate of 1.528 million in April, a 2.5 percent increase from a revised 1.491 million rate the prior month that was weaker than previously estimated, the Commerce Department said today in Washington. Building permits slumped 8.9 percent to a 1.429 million pace, the fewest since June 1997.
Some buyers are delaying purchases in anticipation of a drop in home prices as stricter lending guidelines and subprime mortgage defaults add to the glut of unsold properties, economists said. The housing recession remains the biggest threat to Federal Reserve forecasts of ``moderate'' economic growth.
``The drag from housing is going to continue for a while,'' said James O'Sullivan, a senior economist at UBS Securities LLC in Stamford, Connecticut. ``The decline in permits suggests starts will weaken further.''
.....
The decline in permits was the biggest since February 1990. Permits, a sign of future construction, were estimated to drop to 1.52 million from 1.564 million, according to the median forecast.
Let's break this number down from a couple of different angles.
1.) Last months figure was revised down. That means this months increase is a bit larger in relation. It also means this months number could be revised down as well.
2.) Building permits decreased 8.9%. That means the starts number is a blip on a downward trajectory.
3.) My guess is this number was slightly higher than anticipated because of weather related issues. That is, starts were down a in February because of weather, so March was skewed higher. That is just conjecture on my part.
Here's a link to the report at Census.
The report highlights a few interesting points.
Single units make-up 80% of the number. This number increased 1.6%. However, multiple units -- 5 or more housing units -- increased 6.4%. While this number makes up 17% of the total market, it may be a sign that builders are shifting to larger projects (read rentals).
Companies Using Cash For Buybacks Instead of Capital Investment
From IBD:
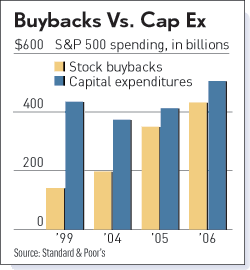
Here's a chart from the same article that shows what's happening here.
According to the Bureau of Economic Analysis, nonresidential investment's seasonally adjusted annual rate for the last 4 quarters was 4.4%, 10.0%, -3.1%, and 2.0%, respectively. In other words, there is a slowdown going on.
So - why would companies use a buyback rather than a capital expenditure?
Here's a simple example. Suppose a company has $100 in earnings and 100 shares outstanding. Their EPS would be $1.00/share. Now suppose there were 50 shares outstanding. The EPS climbs to $2.00 share. In other words, fewer shares = higher EPS and a possible higher stock price.
In addition, the company now has treasury stock to use in buy-outs. Combine increased treasury stock with historically low interest rates and you get an M&A boom.
The article continues:
Here we get into a discussion of wage/production arbitrage. Simply put, developing countries have lower fixed costs making them more attractive for investment from a company's perspective.
This article brings into light a serious question: how much of recent earnings gains are do to actual increases in revenue and how much of these gains are due to fewer shares? I don't have an answer to that, but I would love to find out.
Data from Standard & Poor's show that among S&P 500 firms, the yearly amount spent on buybacks has more than tripled this decade. S&P 500 firms spent $432 billion on buybacks in 2006, up 24% from a year earlier.
Meanwhile, annual capital expenditures have risen only 16% since the start of the decade — and actually fell in 2002 and 2003. S&P 500 firms invested $505 billion on global cap spending in 2006, up 23% from 2005. Spending this year has been sluggish, watchers say.
"The cap ex numbers have been pretty weak year to date, and buybacks are still strong," said Alec Young, an S&P equity strategist.
Here's a chart from the same article that shows what's happening here.

According to the Bureau of Economic Analysis, nonresidential investment's seasonally adjusted annual rate for the last 4 quarters was 4.4%, 10.0%, -3.1%, and 2.0%, respectively. In other words, there is a slowdown going on.
So - why would companies use a buyback rather than a capital expenditure?
Here's a simple example. Suppose a company has $100 in earnings and 100 shares outstanding. Their EPS would be $1.00/share. Now suppose there were 50 shares outstanding. The EPS climbs to $2.00 share. In other words, fewer shares = higher EPS and a possible higher stock price.
In addition, the company now has treasury stock to use in buy-outs. Combine increased treasury stock with historically low interest rates and you get an M&A boom.
The article continues:
Many companies get the bulk of their sales growth from overseas. S&P data show that nearly half of the S&P 500's sales last year — excluding telecoms and utilities — came from foreign markets.
But while firms still invest overseas, it's becoming harder to do so.
"The Chinese really aren't hurting for investment capital — it's not like they need investment dollars from XYZ Corp.," van Dijk said. "The Chinese may very well build their own plants. U.S. companies are extremely useful, but not necessarily in terms of writing checks for a plant."
U.S. firms could build plants here, but fewer are doing so because it's cheaper to make goods elsewhere.
Here we get into a discussion of wage/production arbitrage. Simply put, developing countries have lower fixed costs making them more attractive for investment from a company's perspective.
This article brings into light a serious question: how much of recent earnings gains are do to actual increases in revenue and how much of these gains are due to fewer shares? I don't have an answer to that, but I would love to find out.
Tuesday, May 15, 2007
Markets At the Technical Brink?
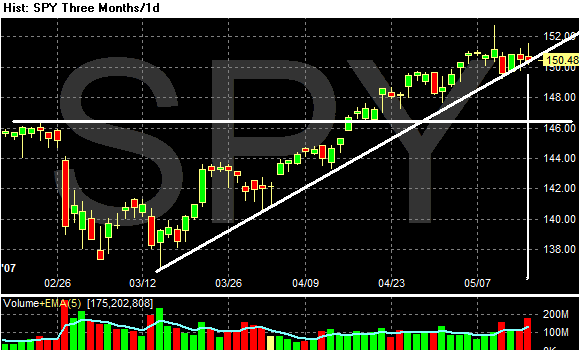
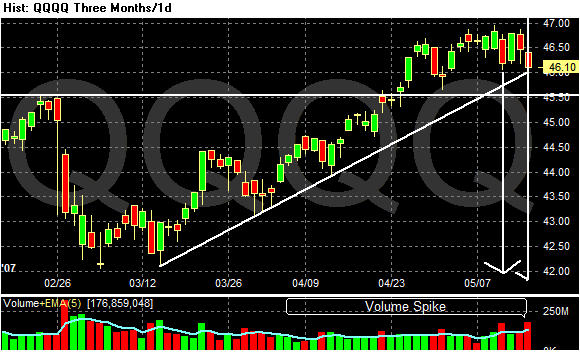
There's a lot of selling pressure over the last few trading sessions on the SPYs and the QQQQs. I've drawn a line from the long down bar days to the corresponding volume to clearly illustrate the situation. Also notice both markets are right at their upward trend lines.
Today the markets were caught between the bulls and the bears. The bulls looked at the inflation report and thought the Fed could lower rates. The bears looked at Home Depot and Wal-Mart earnings and saw a slowing consumer.
The markets could go either way right now. While there's a ton of liquidity in the system right now (see this post), there is also a psychological need for a correction.


Median Home Prices Drop 1.8%; Loan Standards Tighten; Builder Confidence Drops
From Bloomberg:
Let's coordinate this data with some other news from the lending front.
Prices are dropping for two reasons.
1.) There's a ton of supply on the market still. In my neighborhood there are 5 vacant houses that I know of. I realize that's an informal survey of a small neighborhood in Houston, Texas, but it's indicative of what's happening at the macro-level. It's going to take a larger price drop to get things back to normal.
2.) It's harder to get a bank loan now. A small majority of banks tightened lending standards and none loosed standards. This means banks understand they are getting hurt from their looser standards of the last few years. As loans dry-up, demand will drop, which means there is added downward pressure on home prices right now.
The above factors played into another decline in builder confidence:
As I've been saying for about a year now, we're nowhere near the bottom in the real estate market right now.
U.S. home prices tumbled to a two-year low in the first quarter, with declines in almost half of U.S. cities, the National Association of Realtors said.
The median price for houses and condominiums slid 1.8 percent to $212,300 in the first three months of this year, the lowest since the first quarter of 2005 when it was $199,700, the Chicago- based real estate trade group said. The median price for a single- family home fell in 62 of 145 metropolitan areas.
Tumbling prices sparked an increase in sales as bargain shoppers snapped up the cheaper properties. Seasonally adjusted, home sales rose 2.4 percent to an annualized 6.41 million from 6.26 million in the fourth quarter, the association said. Compared with a year earlier, the number of sales fell 6.6 percent.
Let's coordinate this data with some other news from the lending front.
U.S. banks dramatically tightened their standards for approving residential mortgages in the first quarter, the Federal Reserve said Monday
In particular, banks made it harder to get subprime residential mortgage loans and nontraditional loans such as interest-only loans, the Fed reported.
All told, at least 23 of the 53 domestic banks surveyed, or 43%, tightened their mortgage lending standards, up from 16% in the fourth quarter. The latest data are not strictly comparable to previous numbers, because the Fed has changed the wording of its questionnaire. Read the Fed survey.
In its quarterly senior loan officer survey, the Fed said 31% of banks surveyed "considerably" tightened credit standards for subprime loans, while 25% of banks tightened those rules "somewhat." None eased standards.
Prices are dropping for two reasons.
1.) There's a ton of supply on the market still. In my neighborhood there are 5 vacant houses that I know of. I realize that's an informal survey of a small neighborhood in Houston, Texas, but it's indicative of what's happening at the macro-level. It's going to take a larger price drop to get things back to normal.
2.) It's harder to get a bank loan now. A small majority of banks tightened lending standards and none loosed standards. This means banks understand they are getting hurt from their looser standards of the last few years. As loans dry-up, demand will drop, which means there is added downward pressure on home prices right now.
The above factors played into another decline in builder confidence:
Ongoing concerns about subprime-related problems in the mortgage market caused builder confidence about the state of housing demand to decline three more points in May, according to the National Association of Home Builders/Wells Fargo Housing Market Index (HMI), released today. With a current reading of 30, the HMI has now returned to the lowest level in its current cycle, which was previously hit in September of 2006.
“Builders are feeling the impacts of tighter lending standards on current home sales as well as cancellations, and they are bracing for continued challenges ahead,” said NAHB President Brian Catalde, a home builder from El Segundo, Calif.
“The crisis in the subprime sector has infected other parts of the mortgage market as well as consumer psychology, and as a result the housing outlook has deteriorated,” added NAHB Chief Economist David Seiders. “We’re now projecting that home sales and housing production will not begin improving until late this year, and we’re expecting the early stages of the subsequent recovery to be quite sluggish. There still are tremendous uncertainties regarding our baseline forecast going forward, owing largely to the subprime crisis that is having widespread effects throughout the mortgage market.”
.....
All three component indexes declined in May. The index gauging current single-family sales slipped two points to 31, while the index gauging sales expectations for the next six months fell three points to 41 and the index gauging traffic of prospective buyers fell four points to 23.
As I've been saying for about a year now, we're nowhere near the bottom in the real estate market right now.
CPI Up .4%; Core Up .2%
Here's the BLS report:
From Bloomberg:
The 12-month figure for total inflation (for those few of you who actually buy food and gas) came in at 2.6%. This is still above the Fed's preferred comfort zone of 1%-2%, so it's doubtful we'll see a rate cut anytime soon.
This is a good report because it didn't shock to the upside. However, it wasn't so good to warrant speculation the Fed will lower rates anytime soon.
Thanks to NDD in the comments for bringing the following information to my attention.
The BLS report has a chart that shows the seasonally adjusted annual percent change in the overall inflation level for a variety of time periods. For the three months ending 07/06, 10/06, 01/07 and 04/07 we get the following numbers, respectively: 4.9% -2.7%, 2.7% and 5.7%. For the six months ended 10/06 and 04/07 we get the following numbers: 1.0%, 4.2%. In other words, inflation is acceleration over the latest three and six month measures of inflation.
On a seasonally adjusted basis, the CPI-U advanced 0.4 percent in April, following a 0.6 percent increase in March. The index for energy increased 2.4 percent after advancing 5.9 percent in March. In April, the index for petroleum-based energy rose 4.6 percent versus a 10.1 percent increase in March. The food index rose 0.4 percent in April, slightly more than in March. The index for all items less food and energy advanced 0.2 percent in April, following a 0.1 percent rise in March; the index for shelter rose 0.3 percent after advancing 0.1 percent in March, resulting from an upturn in the index for lodging away from home.
From Bloomberg:
The consumer price index increased 0.4 percent after rising 0.6 percent in March, the Labor Department said today in Washington. Core prices, which exclude food and energy, were up 0.2 percent after a 0.1 percent gain.
Core prices in the 12 months ended in April were up 2.3 percent, the smallest gain in year, a sign surging fuel costs aren't filtering through the economy. The report may reassure Federal Reserve policy makers, who are counting on slower growth to stem inflation.
``It is now becoming more apparent that core inflation has peaked and is moving lower in response to anemic economic activity,'' Joseph LaVorgna, chief U.S. economist at Deutsche Bank Securities Inc., said before the report.
Economists forecast consumer prices would rise 0.5 percent, according to the median of 80 projections in a Bloomberg News survey. Estimates ranged from increases of 0.2 percent to 0.8 percent. Core prices were projected to rise 0.2 percent, according to the survey median.
The 12-month figure for total inflation (for those few of you who actually buy food and gas) came in at 2.6%. This is still above the Fed's preferred comfort zone of 1%-2%, so it's doubtful we'll see a rate cut anytime soon.
This is a good report because it didn't shock to the upside. However, it wasn't so good to warrant speculation the Fed will lower rates anytime soon.
Thanks to NDD in the comments for bringing the following information to my attention.
The BLS report has a chart that shows the seasonally adjusted annual percent change in the overall inflation level for a variety of time periods. For the three months ending 07/06, 10/06, 01/07 and 04/07 we get the following numbers, respectively: 4.9% -2.7%, 2.7% and 5.7%. For the six months ended 10/06 and 04/07 we get the following numbers: 1.0%, 4.2%. In other words, inflation is acceleration over the latest three and six month measures of inflation.
Home Depot Profit Down 33%; Wal-Mart Up 8.5%
Home Depot
From CBS Marketwatch:
From Bloomberg:
Wal-Mart
Here's the money points from the WSJ article on Wal-Mart:
Here's what Bloomberg wrote:
Home Depot's basic problem is easy: it's sales are tied to the housing market. That's about all that needs to be said.
Wal-Mart is a bit more complicated. First, they are in the middle of trying to do different things. I have heard interviews with several analysts who are not enamored to current management for a variety of reasons. So, part of this problem is the result of getting away from core business.
However, April's drop was huge. While there are numerous explanations floating around, they don't deal explain the magnitude of April's drop. We had high gas prices last summer and Wal-Mart did fairly well -- or they didn't have a decline of April's magnitude. In addition, Bloomberg noted a drop in traffic. Traffic is the life blood of retailers. If people don't go to the store and browse, they can't buy. This explains why Wal-Mart's stores had a decline in sales.
Also of importance is this point: Sales at older stores rose 0.6 percent, the smallest gain in at least 10 years. That should raise a ton of eyebrows about the health of the US consumer.
From CBS Marketwatch:
Home Depot said that its first-quarter net income dropped 33% to $1.0 billion, or 53 cents a share, from $1.5 billion, or 70 cents a share, a year ago. Sales at the home improvement retailer rose 0.6% to $21.6 billion. Analysts had been expecting the company to produce earnings of 59 cents a share and revenue of $21.83 billion, according to data complied by Thomson Financial. Home Depot said that a challenging housing market and erratic weather across the country hit its Spring selling season. It added that its review of strategic alternatives for its supply operations is ongoing. Home Depot said that the home improvement market is expected to remain soft in 2007 and, based on the first-quarter, it's now expecting earnings at the low end of its guidance range. At the beginning of 2007, the company said that it was expecting earnings per share to decline by between 4% and 9% in the year
From Bloomberg:
First-quarter net income fell 30 percent to $1.05 billion, or 53 cents a share, from $1.48 billion, or 70 cents, a year earlier. Sales rose 0.6 percent to $21.6 billion, the smallest gain in about four years, Home Depot said today in a statement.
Sales at the company's retail stores declined 4.3 percent. Chief Executive Officer Frank Blake, who took over in January after Robert Nardelli was ousted over compensation, tried to boost store sales by adding staff and hiring skilled trades people at about $30 an hour.
``There is not a heck of a lot of upside at this point,'' said Patricia Edwards, a Seattle-based money manager at Wentworth, Hauser & Violich. The firm holds $9.6 billion in assets including Home Depot shares. ``I don't expect sentiment to change until we see the whites of the uptick's eyes. That's going to take a while.''
Wal-Mart
Here's the money points from the WSJ article on Wal-Mart:
U.S. same-store sales rose 0.6%, below expectations for a 1% to 3% increase. Wal-Mart's namesake stores had a 0.1% decline in comparable-store sales, while Sam's Club had a 4.7% gain excluding changes in fuel prices. Before November, Wal-Mart stores had never seen a drop in same-store sales for a single month.
Due to a calendar shift that pushed some Easter sales into the March reporting period, April same-store sales fell 3.5% on a 4.6% drop at Wal-Mart stores. The companywide decline was the just the third since the retailer began reporting monthly sales data in 1979, and was by far the biggest. The other negative months were November, when same-store sales fell 0.1%, and April 1996, when an earlier Easter also skewed year-over-year comparisons and helped result in a 0.6% decline.
Here's what Bloomberg wrote:
Sales at older stores rose 0.6 percent, the smallest gain in at least 10 years, after fewer customers visited stores because of rising gasoline prices and stormy weather in the U.S. Chief Executive Officer H. Lee Scott promoted low prices for groceries and prescriptions after failing to lure consumers with more fashionable clothes and home goods.
Wal-Mart said first-quarter net income rose 8% to $2.83 billion, or 68 cents a share, with revenue up 8.5% to $86.41 billion. Analysts, on average, were expecting the Bentonville, Ark.-based retailer to earn 68 cents a share on revenue of $86.94 billion, according to Thomson Financial. Wal-Mart said the profit rise was driven by the group's Sam's Club and international operations. It's expecting U.S. comparable-store sales to rise between 1% and 2% after a 0.6% first-quarter rise, and second-quarter earnings from continuing operations to be between 75 cents and 79 cents. Analysts were expecting second-quarter earnings of 79 cents a share
Home Depot's basic problem is easy: it's sales are tied to the housing market. That's about all that needs to be said.
Wal-Mart is a bit more complicated. First, they are in the middle of trying to do different things. I have heard interviews with several analysts who are not enamored to current management for a variety of reasons. So, part of this problem is the result of getting away from core business.
However, April's drop was huge. While there are numerous explanations floating around, they don't deal explain the magnitude of April's drop. We had high gas prices last summer and Wal-Mart did fairly well -- or they didn't have a decline of April's magnitude. In addition, Bloomberg noted a drop in traffic. Traffic is the life blood of retailers. If people don't go to the store and browse, they can't buy. This explains why Wal-Mart's stores had a decline in sales.
Also of importance is this point: Sales at older stores rose 0.6 percent, the smallest gain in at least 10 years. That should raise a ton of eyebrows about the health of the US consumer.
Monday, May 14, 2007
There's a lot of Money Floating Around Right Now
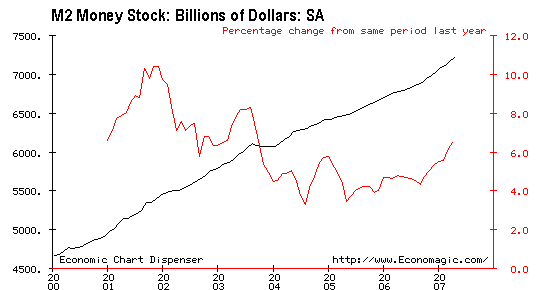
Here's a chart of the year-over-year change in M2 money growth, seasonally adjusted.
Here's a chart of M3 from Shadowstats. I can't comment on the sites methodology, but it's interesting food for thought.


Here's a chart of M3 from Shadowstats. I can't comment on the sites methodology, but it's interesting food for thought.

Markets Update
Let's take a look at the charts of the QQQQ and SPY to see how the markets are looking.
Here's a chart of the SPY
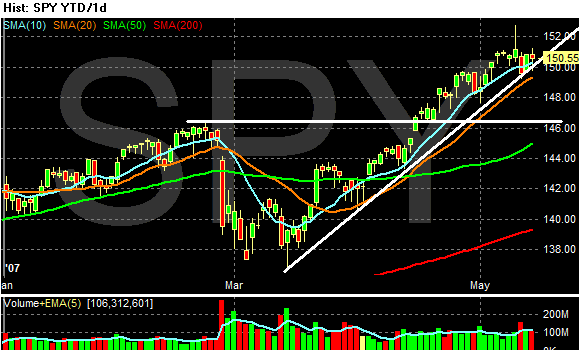
The market has been moving sideways since early may. For the last few trading sessions it's been trading right around the 10 day SMA. It's also approaching the trend line that started after the China sell-off. From a volume perspective, we had fairly aggressive selling on Thursday, but volume has backed-off to more normal levels for the last two sessions. From a technical perspective, the market is at a crossroads.
Here's a chart of the QQQQs
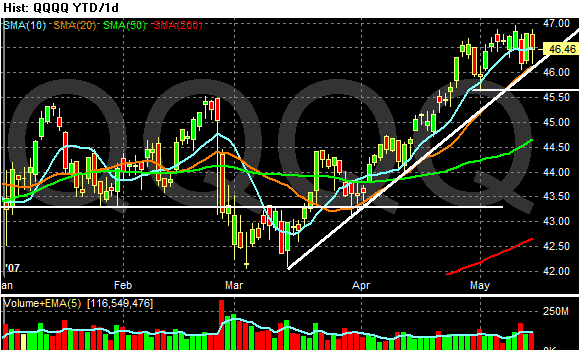
The analysis for the SPYs applies here, save for the volume analysis. Notice volume spiked up on Thursday and has risen a touch since then.
Finally, here are the IWNs
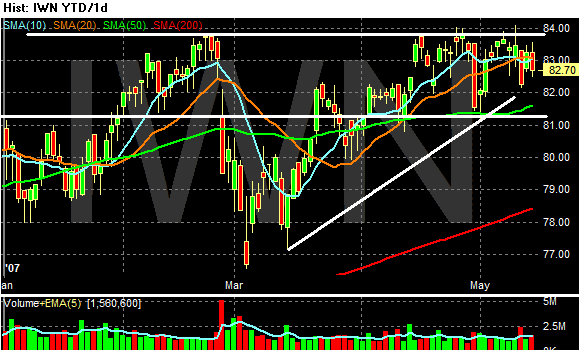
This average hasn't been able to get over the highs it reached before the China sell-off. This may indicate traders are moving into larger more established names during the current rally. This average is also approaching the trend line established at the bottom of the China sell-off.
All of these averages are at or near their trend lines. That makes tomorrow's inflation report that much more important. Traders are looking for a reason for the Fed to lower rates -- or at least give them an argument that the Fed can lower rates. Any number that supports that thesis should rally the markets.
Here's a chart of the SPY

The market has been moving sideways since early may. For the last few trading sessions it's been trading right around the 10 day SMA. It's also approaching the trend line that started after the China sell-off. From a volume perspective, we had fairly aggressive selling on Thursday, but volume has backed-off to more normal levels for the last two sessions. From a technical perspective, the market is at a crossroads.
Here's a chart of the QQQQs

The analysis for the SPYs applies here, save for the volume analysis. Notice volume spiked up on Thursday and has risen a touch since then.
Finally, here are the IWNs

This average hasn't been able to get over the highs it reached before the China sell-off. This may indicate traders are moving into larger more established names during the current rally. This average is also approaching the trend line established at the bottom of the China sell-off.
All of these averages are at or near their trend lines. That makes tomorrow's inflation report that much more important. Traders are looking for a reason for the Fed to lower rates -- or at least give them an argument that the Fed can lower rates. Any number that supports that thesis should rally the markets.
China's Stock Market Bubble
From Bloomberg:
By any valuation method, that's an expensive market. In addition,
This is a classic sign of an end of the rally. In general the institutional money comes in at a market bottom. The small investors get in at the top.
This looks like a liquidity driven rally. Simply put, there are too many yuans chasing too few investments, meaning the money has to end of somewhere regardless of the prudence of the underlying decision.
There are strong, fundamental reasons for people to invest in China. The economy is after all growing at over 10%. However, there is also an issue of valuation -- meaning the actual value of the market relative to the market's underlying fundamentals.
Some analysts expect a share market correction. The benchmark CSI 300 Index is valued at 43 times earnings versus 24 times for India's Sensitive Index and 18 times for the Dow Jones Industrial Average.
By any valuation method, that's an expensive market. In addition,
Central bank Governor Zhou Xiaochuan is concerned about a stock market bust, after the benchmark CSI 300 Index rose more than 80 percent this year. Chinese households have opened share trading accounts at a record pace and reduced bank deposits instead of leaving their money to be eaten up by inflation.
This is a classic sign of an end of the rally. In general the institutional money comes in at a market bottom. The small investors get in at the top.
A wall of cash from China's trade surplus is complicating government efforts to cool investment, lending, the stock market and inflation. The gap from the export boom widened 63 percent in April from a year earlier to $16.9 billion.
This looks like a liquidity driven rally. Simply put, there are too many yuans chasing too few investments, meaning the money has to end of somewhere regardless of the prudence of the underlying decision.
There are strong, fundamental reasons for people to invest in China. The economy is after all growing at over 10%. However, there is also an issue of valuation -- meaning the actual value of the market relative to the market's underlying fundamentals.
Profits Are Still Strong
From Bloomberg:
Let's review a few key points.
1.) Analysts don't like being wrong. So it's fairly possible they low-balled their estimates this quarter, making these gains that much more impressive.
2.) CEOs probably low-balled their estimates as well. Earnings that "surprise" are more likely to lead to a rally in the underlying stock.
3.) How much of the increase in international sales was due to a decreasing dollar and how much was actually due to an increase in sales? The difference is very important. Asia and Europe are expanding which means there should be an actual increase in international sales. However, it's important to qualify the difference.
4.) All that being said, this is a good quarter. And the increase in earnings are a primary reason for the market's increase over the last few months. However, it's also important to ask the important qualifying questions to get the story straight.
Companies in the Standard & Poor's 500 Index through May 11 reported an average earnings gain of 13 percent in the quarter, according to data compiled by Bloomberg. The last time growth was less than 10 percent was the second quarter of 2002.
International sales helped by a weaker U.S. dollar and continued spending by U.S. consumers fueled the earnings advance. Concerns that the U.S. housing slump and rising delinquencies by subprime mortgage holders would damp profits have eased, analysts said.
First-quarter earnings advanced four times faster than analysts had projected as of April 13, as 76 percent of the 444 companies in the S&P 500 that reported through May 11 met or topped projections. Twenty-seven percent beat estimates by at least 10 percent.
Let's review a few key points.
1.) Analysts don't like being wrong. So it's fairly possible they low-balled their estimates this quarter, making these gains that much more impressive.
2.) CEOs probably low-balled their estimates as well. Earnings that "surprise" are more likely to lead to a rally in the underlying stock.
3.) How much of the increase in international sales was due to a decreasing dollar and how much was actually due to an increase in sales? The difference is very important. Asia and Europe are expanding which means there should be an actual increase in international sales. However, it's important to qualify the difference.
4.) All that being said, this is a good quarter. And the increase in earnings are a primary reason for the market's increase over the last few months. However, it's also important to ask the important qualifying questions to get the story straight.
Foreclosure Auctions Are Forcing Low-Priced Sales
From the WSJ:
This shouldn't be surprising to anybody. Housing inventory has been stubbornly high for the past year or so. The only way to get that inventory off the market is for sellers to lower prices. However, prices have been very sticky so far. Some development was necessary to lower prices and it looks like this may be it.
A surge of foreclosures over the past year or so has left lenders struggling to sell a growing backlog of homes. Rather than relying on real-estate agents, the usual practice, some are turning to large-scale auctions to speed up the sale proces
Real Estate Disposition Corp., the Irvine, Calif., company that organized Saturday's auction of lender-owned homes, plans similar sales May 19 in Los Angeles and May 20 in Riverside, Calif.
At the San Diego sale, houses and condos typically sold for about 30% below the previous sale or appraisal prices. In a few cases, the discounts were around 50%.
This shouldn't be surprising to anybody. Housing inventory has been stubbornly high for the past year or so. The only way to get that inventory off the market is for sellers to lower prices. However, prices have been very sticky so far. Some development was necessary to lower prices and it looks like this may be it.
Sunday, May 13, 2007
Happy Mother's Day
For those of you who are mothers and for those of you whose mothers are still alive, please call call your Mom and tell her you love her. You've only got one mom.
Happy mother's day.
Happy mother's day.