Saturday, April 14, 2007

What's Causing Inflationary Pressures? Pt. II

In part one, I showed how oil and gas prices are increasing, which in turn will keep the Fed on the sidelines. Below, I will discuss agricultural prices which are also increasing:

From the blog, Financial Sense

Thanks to Federal mandates and subsidies, corn used for the production of corn ethanol is expected to increase from ~ 700 M Bushels in 2000/2001, to 3.2 B bushels in 2007/2008 – an increase of 357 percent. On December 11, 2006, the USDA estimated 2006-2007 U.S. ending stocks would be 935 million bushels, down from 1.97 billion bushels in 2005-2006. That decreases the ending stocks by more than 50 percent and puts the ending stocks to use ratio at 8%, - the lowest in 11 years. It should be obvious to all, we are going to need a lot more acreage and big yield improvements if corn production is going to keep up to demand. Prices could exceed $4.50 per Bu by the end of 2008. That’s a price increase of 125% over 2005/2006 season prices.


Let's take this one point at a time.

...corn used for the production of corn ethanol is expected to increase from ~ 700 M Bushels in 2000/2001, to 3.2 B bushels in 2007/2008 – an increase of 357 percent.

In other words, demand hasn't just increased; it has spiked off the map. Econ 101: increased demand equals increased price.

On December 11, 2006, the USDA estimated 2006-2007 U.S. ending stocks would be 935 million bushels, down from 1.97 billion bushels in 2005-2006. That decreases the ending stocks by more than 50 percent

Supply is contracting as well, and not by a little. By a lot. Econ 101: decreased supply = increased price.

It should be obvious to all, we are going to need a lot more acreage and big yield improvements if corn production is going to keep up to demand. Prices could exceed $4.50 per Bu by the end of 2008. That’s a price increase of 125% over 2005/2006 season prices.

To respond to the increased demand farmers planted more corn this year. This is why the daily agricultural prices dropped a few weeks ago. But notice prices are right back up to to where they were a few weeks ago.

This situation in the corn market is impacting all other agricultural products as well -- everything is going up in price. Here's the daily chart.
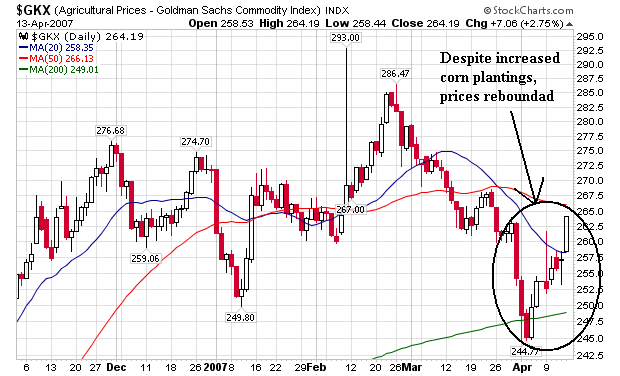
Photo Sharing and Video Hosting at Photobucket

Also notice that on the long-term chart we have a two year bull market. It's hard to stop a trend like this, especially with the above mentioned supply/demand situation. Also note the price rebound from the news of increased corn plantings is apparent on this weeklychart -- that's how strong the rebound was.
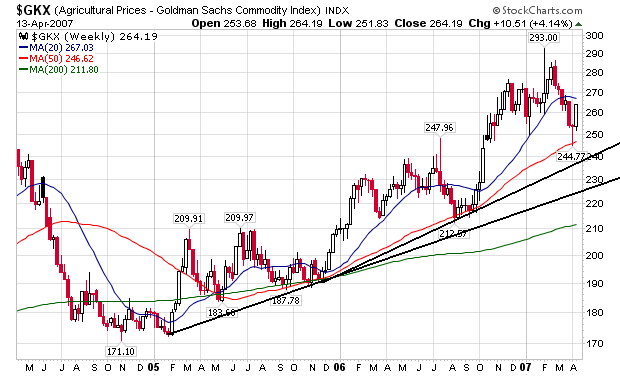
Photo Sharing and Video Hosting at Photobucket

And it's not just corn that's increasing in price. Remember corn is a basic ingredient in a ton of food.

If corn prices increase by ~ 55 percent, year over year, then will the corn used for hog, cattle, chicken, turkey and fish feed go up 55 %? Doesn’t that increase the price of meat, poultry, fish, milk and eggs? If corn is used in corn meal, corn flakes, corn oil, and hundreds of other food items goes up 55%, doesn’t that increase the price of all these foods? Maybe. Since 2000, the price of beef is up 31%, eggs up 50%, corn sweeteners up 33%, wet corn milling up 39%, and corn flakes are up 10%. Chicken prices haven’t changed very much. Yet. Food producers are predicting higher prices.


So, here's the summation. Food prices are going up. The ethanol mandates are increasing demand. Although farmers planted more corn this year, supplies are still dwindling. Econ 101: increased demand plus decreased supply = increasing prices.
What's Causing Inflationary Pressures? Pt. I

From the most recent FOMC statement:

Members agreed the statement also should indicate that inflation pressures seemed likely to moderate over time, but that recent readings on core inflation had been somewhat elevated and the high level of resource utilization had the potential to sustain inflation pressures. A persistence of inflation at recent rates could eventually have adverse consequences for economic performance. All members agreed the statement should indicate that the Committee’s predominant policy concern remains the risk that inflation will fail to moderate as expected. The Committee agreed that further policy firming might prove necessary to foster lower inflation, but in light of the increased uncertainty about the outlook for both growth and inflation, the Committee also agreed that the statement should no longer cite only the possibility of further firming.


Yeah, I know -- this is very much a, "we want our cake and eat it too" kind of statement. However, once you get beyond the Fed double-speak, it's actually pretty obvious what they're saying:

The Committee agreed that further policy firming might prove necessary to foster lower inflation, but in light of the increased uncertainty about the outlook for both growth and inflation, the Committee also agreed that the statement should no longer cite only the possibility of further firming.


Let me explain why. Right now there are two really strong upward trends on prices that aren't going away anytime soon.

Gas Prices

According to the Department of Energy:

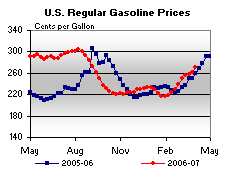
Gasoline prices saw another significant increase for the week of April 2, 2007, jumping 9.7 cents to 270.7 cents per gallon. This is the ninth consecutive week of increases; prices are now 11.9 cents per gallon higher than at this time last year. All regions reported higher prices. East Coast prices were up 9.6 cents to 267.1 cents per gallon, while Midwest prices rose 9.6 cents to 261.4 cents per gallon. The Gulf Coast saw the largest regional increase, with prices up 12.3 cents to 256.5 cents per gallon. In the Rocky Mountains, prices increased 8.1 cents to 261.9 cents per gallon. West Coast prices were up 8.0 cents to 309.6 cents per gallon, with the average price for regular grade in California up 7.6 cents to 322.8 cents per gallon, 48.5 cents per gallon above last year's price.


Here's a chart from the same report. The red line -- which is higher -- represents this years prices.

Photo Sharing and Video Hosting at Photobucket

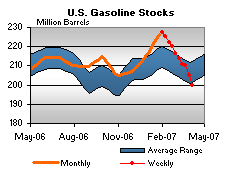
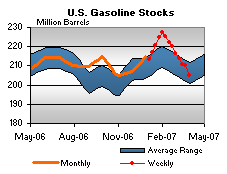
One of the primary reasons for the decease is a declining inventory of gasoline. Here is a chart of gasoline stockpiles represented by the orange line.

Photo Sharing and Video Hosting at Photobucket

Aside from dwindling gas stockpiles, oil supplies are also dropping:

The International Energy Agency warned Thursday that output by the Organization of Petroleum Exporting Countries had hit its lowest level in over two years on production outages and self-imposed cuts, a factor likely to drain global oil stocks in the coming months.

In its monthly oil market report, the agency, the energy security watchdog for the Organization for Economic Cooperation and Development, highlighted unexpected product-led reductions in world oil stocks and what it described as "astonishing" demand growth in China, where it was forced to revise up its growth expectations for this year.

Unexpected production outages in Nigeria and maintenance in Saudi Arabia contributed to OPEC's daily output in March falling to a little over 30 million barrels, the lowest since January, 2005.


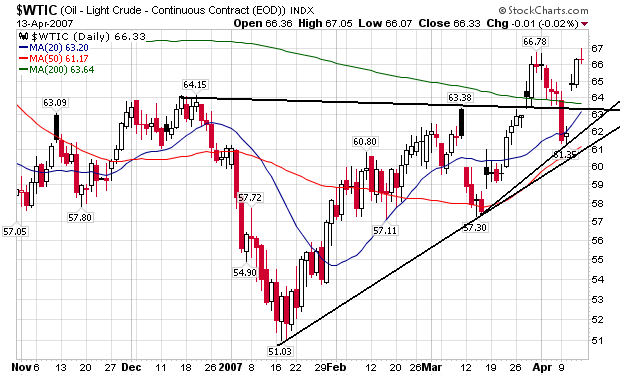
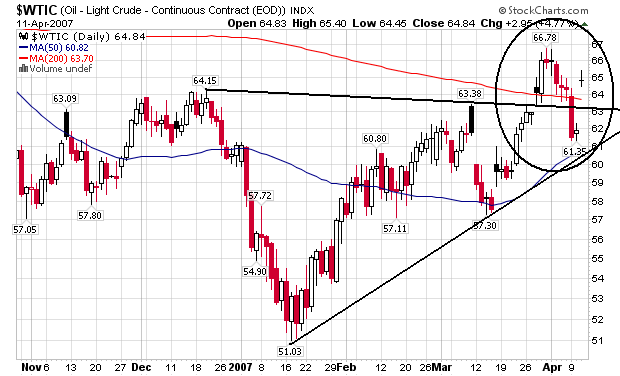
Let's look at the price of oil. First, here's the daily chart. We had a nice dip when the Britain/Iran situation calmed down, but prices spiked back up to the $64 area the next day. In addition, we have two upward slanting trend lines to deal with. Finally, oil prices are using the 20 and 50 day SMAs for technical support.

Photo Sharing and Video Hosting at Photobucket

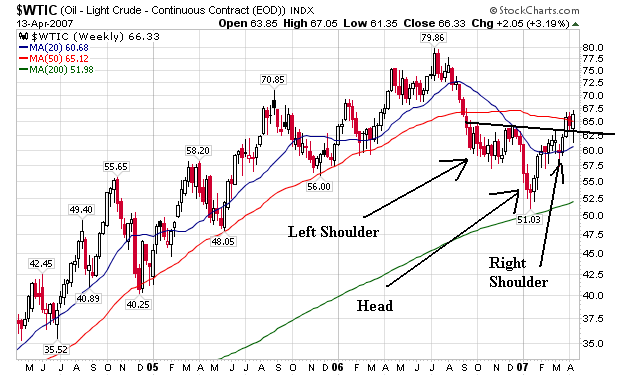
On the weekly chart, we appear to have a head and shoulders formation with prices now moving above the neck line.

Photo Sharing and Video Hosting at Photobucket


So, what does all this mean?

We're probably going to have higher gas prices as the summer progresses. And the higher those prices go, the less likely the Fed will cut interest rates. Remember the Fed has been hoping the economy would do the Fed's job of lowering inflation. But, that's not happening right now.

Friday, April 13, 2007

The Markets Last Week

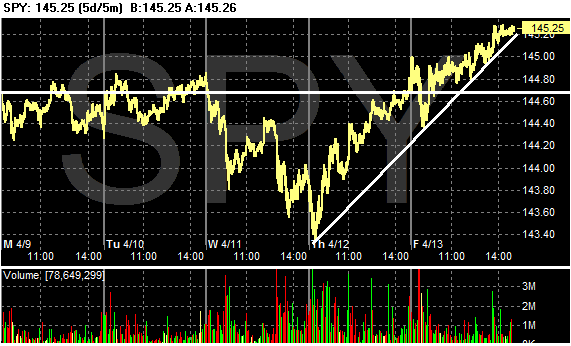
The bottom fell out of the SPYs on the Fed's announcement on Wednesday, but they more than made that up on Thursday and Friday. The SPYs had a strong rally over the last two days. The SPYs also ended up the most of the three averages.

Photo Sharing and Video Hosting at Photobucket

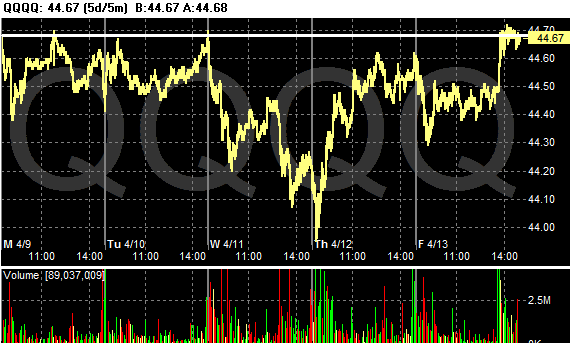
While the QQQQs did end the week on a high note, they didn't get there by the best technical path. While the QQQQs shook off the Fed news on Thursday, they fell a bit on Friday morning, and only closed at decent levels after a sharp spike. My guess is there was a program trading reason for that move.

Photo Sharing and Video Hosting at Photobucket

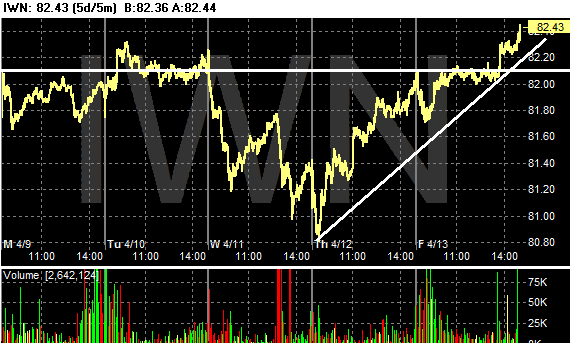
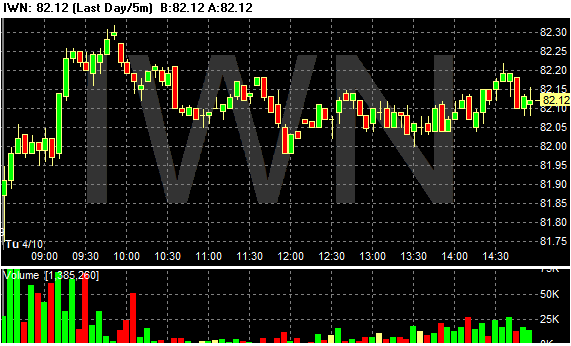
The IWNs chart was similar to the SPYs. They ended the week on a solid note with a strong upswing after the Fed's announcement.

Photo Sharing and Video Hosting at Photobucket

PPI Up 1%

From the BLS:

The Producer Price Index for Finished Goods increased 1.0 percent in March, seasonally adjusted, the Bureau of Labor Statistics of the U.S. Department of Labor reported today. This advance followed a 1.3-percent rise in February and a 0.6-percent decrease in January. The index for finished goods excluding foods and energy was unchanged in March after moving up 0.4 percent in February. At the earlier stages of processing, prices received by producers of intermediate goods increased 1.0 percent in March following a 1.1-percent advance a month earlier, and the crude goods index rose 3.2 percent after climbing 8.9 percent in February.


Once again, agricultural prices were a big reason for the jump; they increased 1.4%. This is the 4th straight month of increases over 1%. Energy was up 3.6%. Outside of food and energy, prices were up 0%. But - is there anybody out there who doesn't consume food or energy?

This is not good news from a Federal Reserve Perspective, as it adds further fuel to the inflation hawk's argument for either keeping rates where they are or possibly raising rates.

Remember this paragraph from the FOMC minutes:

In light of the recent economic data and anecdotal information, the Committee agreed that the statement to be released after the meeting should note that economic indicators had been mixed, that the adjustment in the housing market was ongoing, and that the economy seemed likely to expand at a moderate pace over coming quarters. Members agreed the statement also should indicate that inflation pressures seemed likely to moderate over time, but that recent readings on core inflation had been somewhat elevated and the high level of resource utilization had the potential to sustain inflation pressures. A persistence of inflation at recent rates could eventually have adverse consequences for economic performance. All members agreed the statement should indicate that the Committee’s predominant policy concern remains the risk that inflation will fail to moderate as expected.

Capital Spending -- Not Housing -- Biggest Threat

At least according to a survey of economists:

A new WSJ.com survey found that 20 of 54 economic forecasters responding to a query cited soft capital spending as the chief risk to their forecast that the U.S. economy will grow slowly but avoid recession this year.

Only 11 of the economists cited housing; the rest cited other threats, including inflation and oil prices.

Capital spending "scares me more than anything else because I can't explain the weakness," said Stephen Stanley of RBS Greenwich Capital.

The Federal Reserve has similar worries. "The magnitude of the slowdown [in capital spending] has been somewhat greater than would be expected given the normal evolution of the business cycle," Fed Chairman Ben Bernanke told Congress late last month. And the International Monetary Fund, cataloging the risks to the U.S. economy this week, noted "concerns that the current softness of business investment could be extended."

The softness extends across industries. Semiconductor maker Advanced Micro Devices Inc. said this week that it is reducing planned 2007 capital spending by $500 million to about $2 billion amid sharply lower first-quarter revenue and difficulty in taking market share from rival Intel Corp. That spending would, however, still be up from last year's $1.86 billion.


This is potentially a big issue because a slowdown in capital spending was the reason for the last recession. The general theory as to why this is happening is simple: profits are still positive, but they are falling. Companies are tightening their belt to keep profits up for one or two more quarters.

The problem is if a bunch of companies do this at the same time, we're in trouble -- big trouble. I'm not sure the economy could handle a capital spending slowdown and a housing slowdown.

China's Reserves Increase

From the WSJ:

China reported a massive increase in its huge pile of foreign currency in the first three months of this year, a gain that includes as much as $73.3 billion in unexplained new funds that has confounded experts on the Chinese financial system.

The Chinese central bank, which already controls more financial assets than any other single institution in the world, said that its foreign-exchange reserves rose $135.7 billion in the first quarter -- more than half the increase for all of last year. That raised the total to $1.2 trillion by the end of March.

The rise is far more than economists had expected -- and than can be explained by the flows of money into the country reported already. An increase in foreign reserves shows that more money is flowing into China than out of it, with the excess ending up on account with the central bank. And plenty of money is coming into China, owing in part to its export prowess.


This is getting really interesting -- and a touch scary. First, the sheer size of China's currency reserves is, well, really damn big. They have started their own "money managing" department to handle some of the account, but even then this is a ton of money.

Secondly, when money starts "appearing", I get really suspicious. While I wish that was the case (that money magically appeared), we all know better.

Thursday, April 12, 2007

Bulls v Bears

Donald Luskin and Barry Ritholtz are debating on US News and World Report's Capital Commerce Blog. It's a very good read and is highly recommended.

The Markets Today

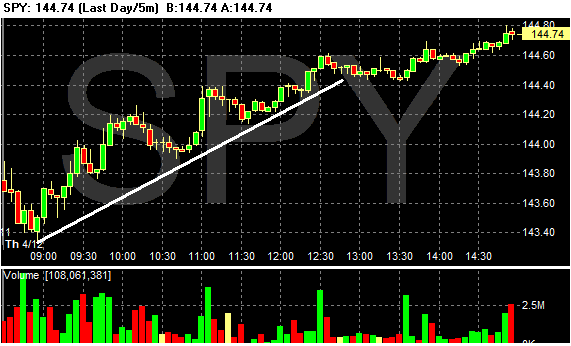
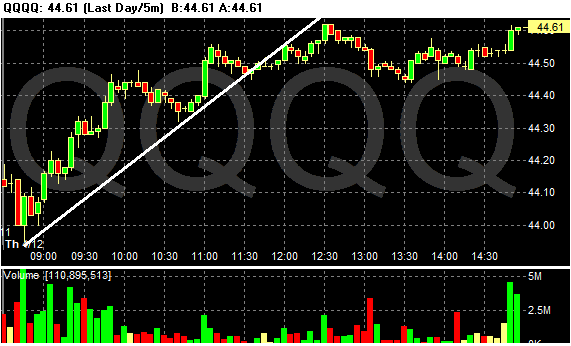
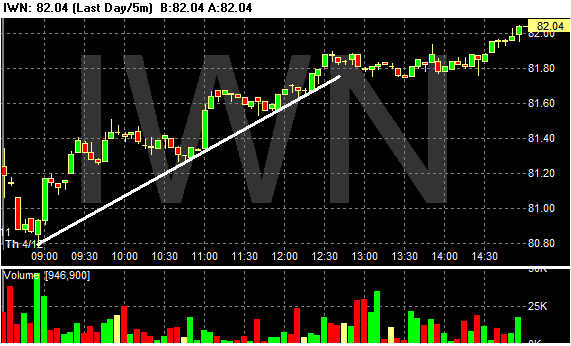
The markets had a nice upward move today, which is especially good considering they started in negative territory. They rallied until 12:30, moved sideways a bit, then added a bit more. My guess is the retail sales numbers were a big reason for the advance. Right now the consumer is the main economic actor moving the economy forward. Any news indicating the consumer is alive and well helps to alleviate recession concerns.


Photo Sharing and Video Hosting at Photobucket

Photo Sharing and Video Hosting at Photobucket

Photo Sharing and Video Hosting at Photobucket

The Fed on the Economy

Here are some bullet points on the economy that come from the FOMC minutes.

1.) Employment gains moderated in early 2007

2.) Industrial production rose strongly in February and was revised up for both December and January.

3.) Real consumer spending appeared on track to rise at a robust pace in the first quarter, buoyed in part by a weather-related surge in spending on energy services and by a jump in sales of light motor vehicles. Outside of these areas, however, real consumer spending moderated

4.) Housing starts declined in January, extending the downward trend that had been in place since early 2006, but bounced back in February. However, adjusted permit issuance in the single-family sector continued to step down, suggesting that builders were still slowing the pace of new construction to work off elevated inventories.

5.) Business fixed investment had been sluggish in recent months.

6.) Businesses accumulated inventories of items other than motor vehicles at a slower pace in January than in the previous two quarter

7.) The U.S. international trade deficit narrowed considerably in the fourth quarter. Exports rose, partly reflecting a robust increase in deliveries of civilian aircraft to foreign buyers, while imports were pushed down by a fall in the volume and price of imported oil

8.) Economic activity in the advanced foreign economies accelerated in the fourth quarter.

So, lets sum up with a "good/bod analysis":

Good: International trade deficit decreasing, other countries economies doing well and industrial production. We'll put consumer spending in this category as well, largely because of today's retail sales report.

Bad: Housing and business investment.

In-between: OK - I added a category. Employment belongs here. Although the BLS has revised the last two months higher and the latest report was a pretty good 180,000, growth is slowing and service sector jobs decreased last month by 7000.

So, according to the Fed, we're running lukewarm right now.

Vizier Vic makes a good point in the comments:

Does anyone believe that foreign buyers have suddenly started snapping up all of the industrial production which is theoretically pouring off American production lines. That's the only thing which might account for the purported rise in industrial production given the rest of this report. Business fixed investment and inventory builds and residential construction are down (and house sales too) which all mean domestic consumption of industrially-produced products are down too. Where's the growth source? Can anybody identify it? Is it restricted solely to light trucks and automotive? It sure looks like it and that's a pretty slender reed on which to base an economy. Or, is it restricted to kilowatt-hours and barrels of oil? That's an even more treacherous sink hole.


According to the BEA's latest GDP report, exports totaled $1.523 trillion in the 4th quarter, up from $1.488.3 trillion in the third quarter. That's about 11% of the US economy.

Import Prices Surprise on the Upside

From the BLS:

The U.S. Import Price Index rose 1.7 percent in March, the Bureau of Labor Statistics of the U.S. Department of Labor reported today. The increase followed a 0.1 percent rise in February and was led by an increase in petroleum prices. The price index for exports increased for the fifth consecutive month, advancing 0.7 percent in March.


Petroleum prices -- which increased 9% -- were the primary reason for the increase. Non-petroleum prices increased .3%.

Short version -- this report is not good, especially in light of the Fed's FOMC minutes released yesterday.

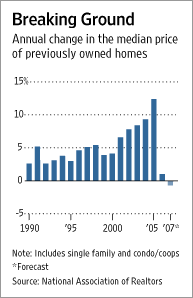
Realtors Predicting Price Drop

From the WSJ:

The National Association of Realtors, which has long proclaimed that U.S. home prices haven't declined on a nationwide basis since the Great Depression, now says they are likely to do just that this year.

The Realtors, which had been projecting as recently as February a 1.9% increase in the median home price this year, now say prices for previously occupied homes will slip 0.7% this year from the 2006 level.

The trade group's revised outlook, which puts it in line with a growing consensus that home prices will fall at least modestly this year, underlines how quickly expectations about the market have changed in light of a recent tightening of credit by mortgage lenders. Before the subprime mortgage problems blew up recently, said Lawrence Yun, an economist for the Realtors, the group expected the housing market to begin recovering by the middle of this year. Now, he says, recovery is unlikely before late this year.


It's important to remember several things about the housing market. First, this is a slow-moving market. There is a fairly large time lag between a seller putting the house on the market, the buyer signing a contract and closing the deal. That means it takes a bit more time for prices to actually respond to the market.

In addition, so far real estate prices have been fairly "sticky" -- not moving is response to the changing market fundamentals. Sellers just aren't willing to accept the reality that asking prices are simply too high given the decrease in demand.

Also note credit standards are tightening. That means demand will drop further by the end of the year.

The WSJ article had a nice graph as well:

Photo Sharing and Video Hosting at Photobucket

OPEC Production at Two Year Low; Oil Market Update

From the WSJ:

The International Energy Agency warned Thursday that output by the Organization of Petroleum Exporting Countries had hit its lowest level in over two years on production outages and self-imposed cuts, a factor likely to drain global oil stocks in the coming months.

In its monthly oil market report, the agency, the energy security watchdog for the Organization for Economic Cooperation and Development, highlighted unexpected product-led reductions in world oil stocks and what it described as "astonishing" demand growth in China, where it was forced to revise up its growth expectations for this year.

Unexpected production outages in Nigeria and maintenance in Saudi Arabia contributed to OPEC's daily output in March falling to a little over 30 million barrels, the lowest since January, 2005.


This is a classic case of deliberately shrinking supply to drive prices up. And this tactic is working.

U.S. gasoline stockpiles fell 5.5 million barrels to 199.7 million barrels in the week to April 6, the biggest drop since Aug. 22, 2003, the U.S. Department of Energy reported yesterday. Supplies fell 12 percent the past nine weeks.


Here's a chart of US gas stockpiles.

Photo Sharing and Video Hosting at Photobucket

Also note that demand is increasing:

Gasoline demand, which peaks between the Memorial Day holiday in late May and Labor Day in early September, was close to 9.5 million barrels in each of the Energy Department's past two reports, a level not usually seen until June.


Here's the result of all these events:

Gasoline prices were up again for the week of April 2, 2007, increasing 9.5 cents to 280.2 cents per gallon. This is the tenth consecutive week of increases; prices are now 11.9 cents per gallon higher than at this time last year. All regions reported higher prices. East Coast prices were up 8.4 cents to 275.5 cents per gallon. The Midwest had the largest regional increase, with prices rising 13.0 cents to 274.4 cents per gallon. Gulf Coast prices were up 11.0 cents to 267.5 cents per gallon, while Rocky Mountain prices increased 10.0 cents to 271.9 cents per gallon. West Coast prices were up 4.2 cents to 313.8 cents per gallon, with the average price for regular grade in California up 2.4 cents to 325.2 cents per gallon, 44.1 cents per gallon above last year's price.


Speaking of prices, here's a chart of oil.

Photo Sharing and Video Hosting at Photobucket

The market dropped after the end of the Iran/Britain situation, but the market is still clearly in an uptrend. Considering the drop in US stockpiles, decreased oil output and increasing demand, we're in for some price pressures this summer.

Wednesday, April 11, 2007

The Markets Today

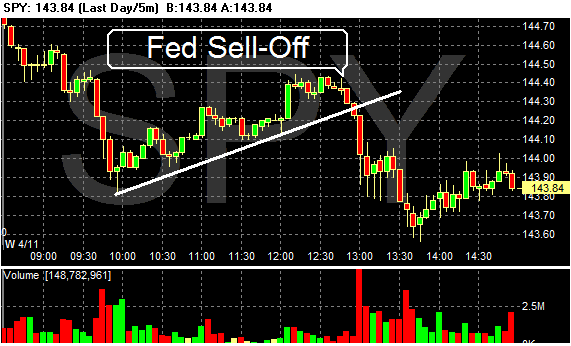
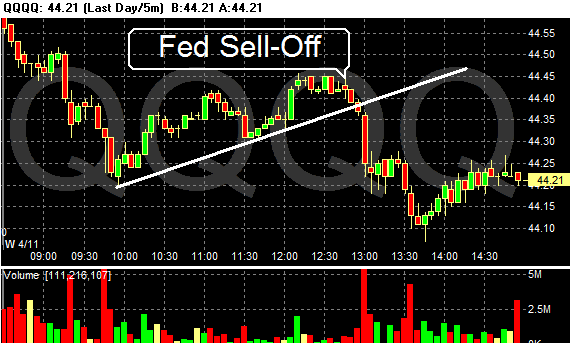
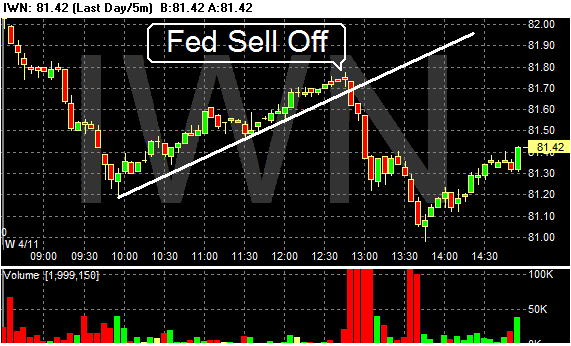
The markets did not like the FOMC minutes. Guess when they sold off?

The Fed basically said inflation was still an issue. Of course, the Fed has been saying that for the last three months but the market has had a wonderful sense of denial going on. So, the Fed clarified again: "No, really, inflation is a big issue for us right now. In fact, we might actually raise rates if the situation gets any worse."

Actually, the Fed was a tough more formal:

Participants agreed that risks around the expected and desired path of a gradual decline in core inflation remained mainly to the upside; some noted that upside risks to inflation appeared to have increased slightly in recent months.


I think the markets finally got the message

Photo Sharing and Video Hosting at Photobucket

Photo Sharing and Video Hosting at Photobucket

Photo Sharing and Video Hosting at Photobucket

Fed Concerned About Inflation

From the FOMC Minutes:

Most participants continued to expect a gradual decline in core inflation over the next year or two, fostered by stable inflation expectations, a likely deceleration in shelter costs, and a slight easing of pressures on resources. Nonetheless, all meeting participants expressed concern about the risks to this outlook. The latest readings on core inflation were higher than expected, and it was difficult to discern whether the apparent downward trend in core inflation during the past few quarters was continuing. Also, the recent increases in prices for energy and some non-energy imports likely would boost overall inflation in the near term and might put upward pressure on prices of some core goods and services. Moreover, rates of resource utilization that were near the high end of historical experience suggested a possibility that inflation pressures could build. Participants agreed that risks around the expected and desired path of a gradual decline in core inflation remained mainly to the upside; some noted that upside risks to inflation appeared to have increased slightly in recent months.


Can we PLEASE stop talking about a rate cut now?

A Look At Homebuilders

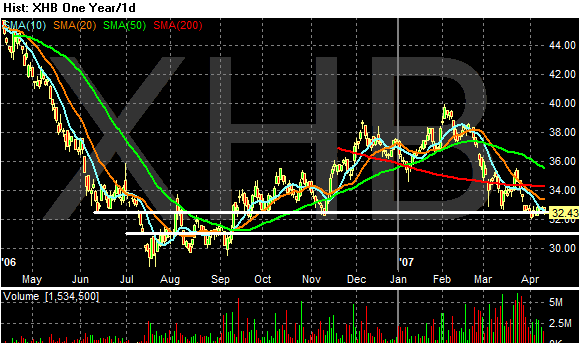
Here is a chart of the homebuilders ETF. Notice the following:

1.) The chart is clearly in a downtrend.

2.) Prices are consolidating around a technical level established 10 months ago.

3.) Prices are trading below all the simple moving averages.

4.) the 10, 20 and 50 day SMA are all heading lower.

The above 4 factors are all bearish. The only positive element on this chart is the decreased volume over the last 5 or so trading days. That indicates the big selling might be over and the average will limp along for awhile.

Photo Sharing and Video Hosting at Photobucket

KB Homes CEO Still Bearish

From Briefing.com

KB Home's (KBH 41.96) chief executive, Jeffrey Mezger, said Tuesday he expects the housing market to get worse before it gets better, even though sales have improved in some areas of the U.S. Shares of the Los Angeles-based builder were indicated more than 2% lower following the announcement, which comes a day after DR Horton (DHI 21.70), the nation's largest homebuilder, warned of a sharp drop in new home orders, and said the spring selling season is off to a slow start as market conditions remain challenging.


When industry insiders are bearish, you know there's a problem. CEOs are paid to put a good spin on news.

Managing Earnings Expectations

From CNBC:

As earnings season got underway Tuesday with better-than-expected quarterly results from Alcoa, analysts said many other companies are likely to exceed their sharply lowered forecasts.


As we move into earnings season, remember we are dealing with sophisticated people; CEOs are very good at figuring out what to say to the press and how to say it. So when a company beats "lowered forecasts" ask yourself, "is it possible there is something deliberate going on here?"

An Overview Of the Markets

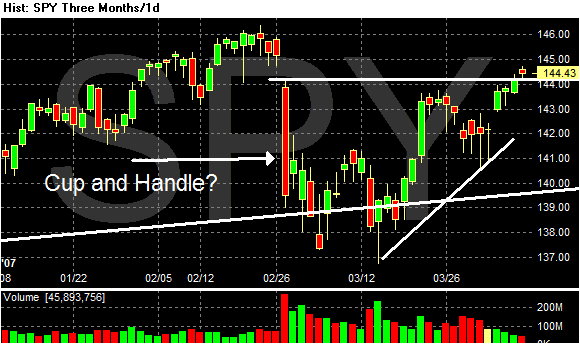
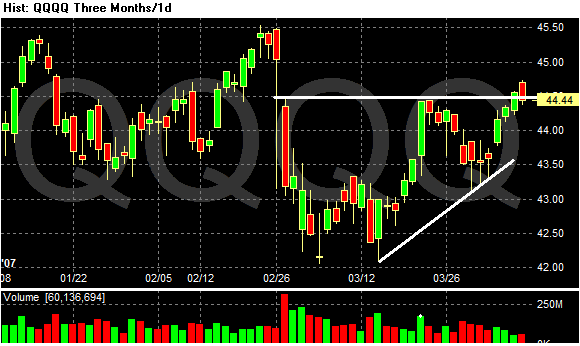
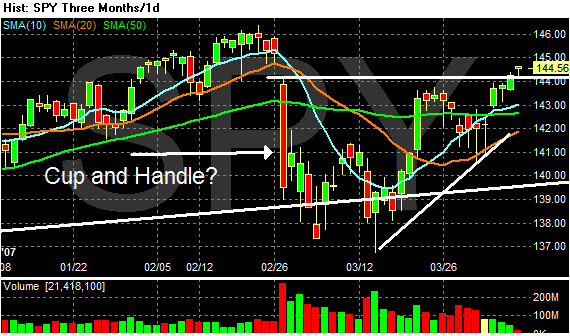
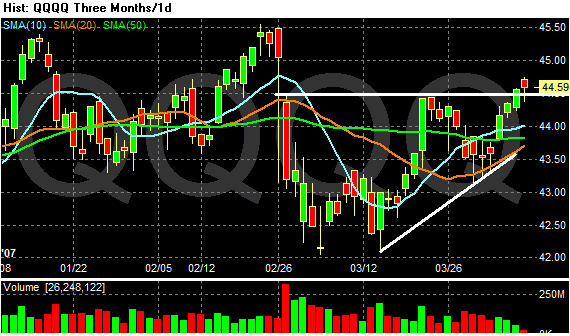
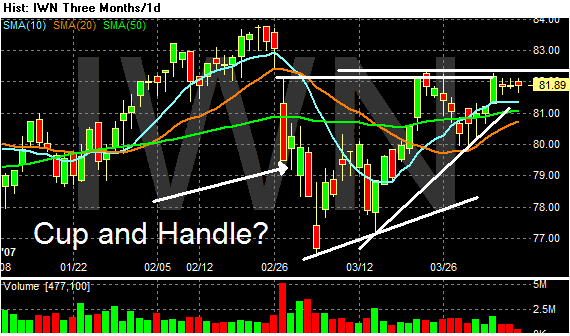
Let's take a look at the 3-month chart for the major ETFs I track -- the SPY (S&P 500), QQQQ (NASDAQ 100), and IWN (Russell 2000).

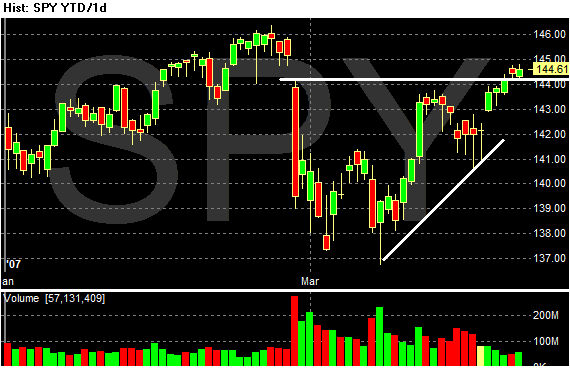
With the SPY we have an upward trending move for the last 5 days, but on lower volume. In addition, notice how the last 5 days bars are pretty narrow, indicating the markets really didn't move that much. Also notice how the market stopped right at resistance, then moved over resistance but still stayed near the level of resistance. Also notice how volume for the last 5 days is lower than previous days. This is a lukewarm chart. While it is technically bullish because of its overall trajectory, the hesitation around resistance, weak bars and lower volume indicate traders are hesitant to strongly bid this market up.

Photo Sharing and Video Hosting at Photobucket

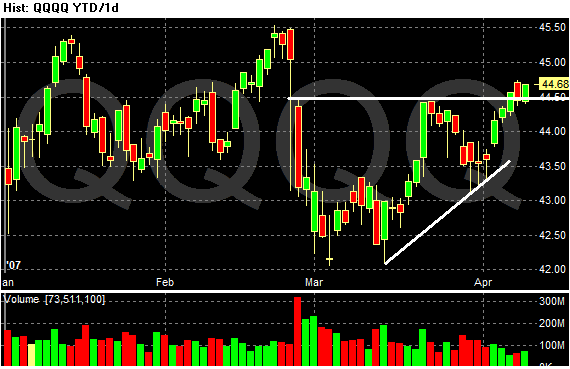
Most of the SPYs analysis applies to the QQQQs. However, the bars here are stronger -- there is more distance between opening and closing prices. This indicates traders are acting a bit more bullishly. However, because prices are still hovering around resistance, this still qualifies as a lukewarm chart.
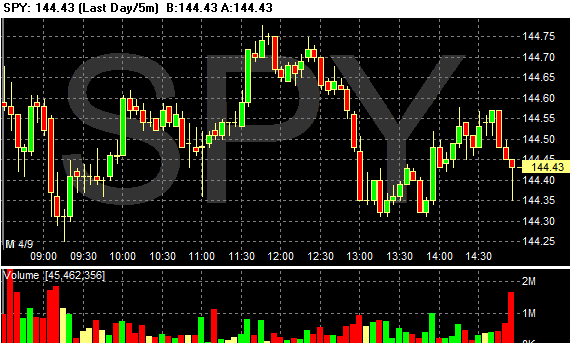
Photo Sharing and Video Hosting at Photobucket

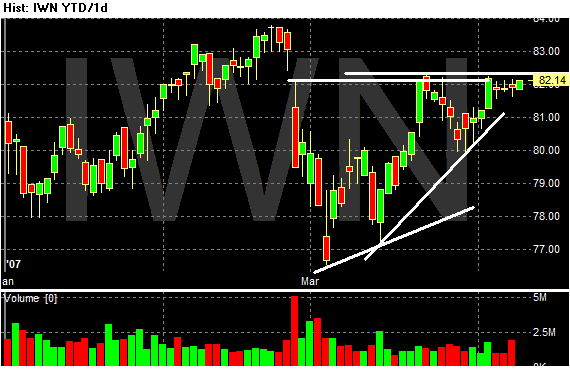
This is the weakest of the three charts, largely because the chart is consolidating below resistance. Anytime a chart does not move above resistance it indicates traders are for some reason hesitant to take the market higher.

Photo Sharing and Video Hosting at Photobucket

Tuesday, April 10, 2007

The Markets Today

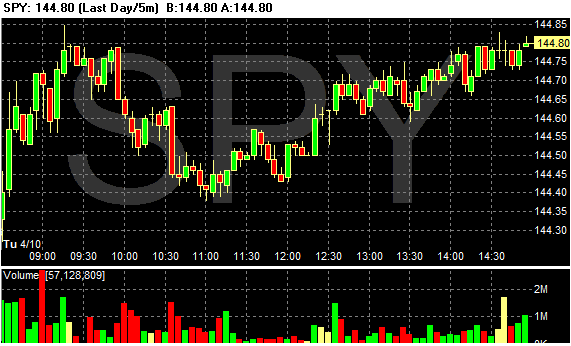
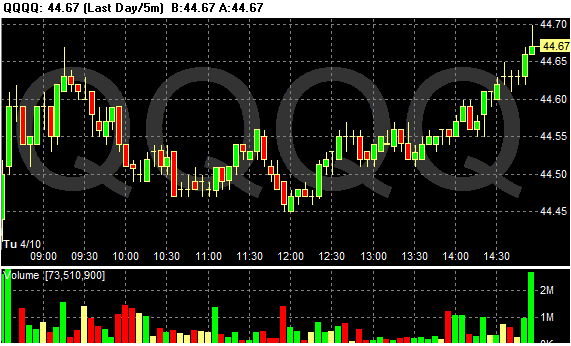
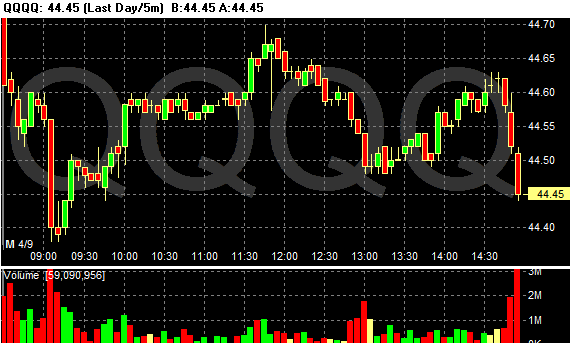
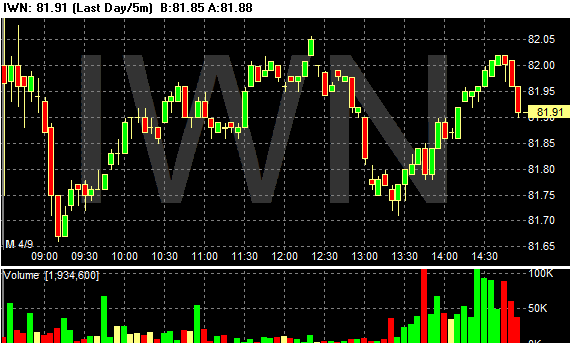
The market were split today. The QQQQs were the best performer with a nice spike at the end of the day on solid volume. The SPYs were the weakest with the IWNs trading a higher but still meandering.

My best guess is the QQQQ spike was a program trading move at the end and not the result of a big rush into the market.

The markets have been lackluster so far this week. The news hasn't been strong enough to move them higher or weak enough to move them lower. It feels like the markets are waiting for an extraneous event to move them.

Photo Sharing and Video Hosting at Photobucket

Photo Sharing and Video Hosting at Photobucket

Photo Sharing and Video Hosting at Photobucket

Foreclosures Still Increasing

From CNBC

During the first quarter, foreclosures have jumped sharply across the nation’s top urban markets, according to a PropertyShark.com report released to CNBC.

In Miami, foreclosures are up nearly 31%, in Los Angeles 24%, and in New York City, up 56%, the website said. Properties in the borough of Queens accounted for the bulk of the New York foreclosures, jumping 91% alone.

Miami experienced the highest quarterly foreclosure rate per household. In Miami-Dade County, there were 987 residential auctions in the first quarter, which translates into 127 foreclosures per 1,000 households. Miami typically has foreclosure rates higher than the national average because it attracts investors that buy into properties before they’re developed with hopes of flipping them later at a profit.


And here's more:

The percentage of mortgages in default rose to 2.87%, surpassing the worst levels following the 2001 recession.

“The news is unremittingly bad,” CNBC's Steve Liesman said Tuesday. “Delinquency rates were up in 44 of the 50 states.”

The only states where delinquencies didn’t increase were Kansas, Kentucky, Montana, North Dakota, South Carolina and Utah.

The states with the highest delinquency rates are:

Mississippi, 4.85%
Texas, 4.09%
Michigan, 4.06%
Georgia, 3.89%
West Virginia, 3.83%


It's important to remember we're on the front end of a recession. That means these numbers are that much worse.

Majority Expect a Recession

From Bloomberg:

Most Americans expect a recession within a year and disapprove of President George W. Bush's handling of the economy even though the unemployment rate is at a five-year low, a new Bloomberg/Los Angeles Times poll found.

Six in 10 who were surveyed predicted a recession, similar to the 64 percent who anticipated the economy would contract in a December 2000 poll by the Los Angeles Times three months before the last decline. In the current survey, 71 percent of those earning less than $40,000 said they expect a recession compared with about half for those making more than $100,000.

``We're living on borrowed time,'' said Andrew Herring, 43, a chemical engineering professor at the Colorado School of Mines in Golden, Colorado, who took part in the survey. ``We spend ridiculous amounts of money on the war and now we have issues with the subprime housing market,'' said Herring, a Democrat.


1.) This really brings consumer sentiment polls/readings under serious doubt.

2.) This shouldn't be too surprising. People are aware the government is spending a ton of money on everything under the sun, the subprime mortgage market has problems and the economy is slowing.

3.) I forgot to add increasing gas prices.
DR Horton's Sales Orders Drop 37%

From the AP:

D.R. Horton Inc., the nation's largest homebuilder by deliveries, said Tuesday its second-quarter sales orders fell 37 percent, led by even steeper declines in California and the Southwest.

We continue to sell more homes than any other builder, even though the spring selling season has not gotten off to its usual strong start," Chairman Donald R. Horton said in a statement.

Net sales orders for the quarter ended March 31 totaled 9,983 homes, down from 15,771 homes during the prior-year quarter. The value of the orders dropped to $2.6 billion from $4.4 billion in the previous year.

Net sales orders for the first six months fell to $4.9 billion, or 18,754 homes, from $7.5 billion, or 27,234 homes during the same period in fiscal 2006.


These are some very substantial drops in sales -- as in, "we're not even close to seeing a bottom in the housing market" kind of drop.

Also note the Spring selling season is not going as well as anticipated. This indicates demand is decreasing.

The CEO made no mention of tightening credit standards in his statements. If tighter standards aren't included, then we have a problem -- a big problem -- going forward.

More Subprime Problems

From IBD:

[American Home Mortgage] The lender slashed Q1 profit targets to 40-60 cents a share, below views of $1.01. It struggled to sell mortgages and will stop making some "alt-A" loans due to losses. M&T Bank, which also makes many "liar loans," cut views last week, citing trouble selling mortgages. These warnings raise concerns that lending woes are spreading beyond subprime. American Home fell 15%.


That's two more companies that are having problems thanks to the mortgage market. Interest rate roundup had a nice take on the M&T Bank situation in a post titled, "So much for the lack of Alt-A spillover ..."

Buffet Buys Railroads

From the WSJ:

Warren Buffett is taking a ride on the rails.

Railroad operators have benefited in recent years from a boom in overseas demand for commodities, U.S. hunger for foreign goods and restrained competition from their big rival, trucking. And thanks to earlier waves of consolidation that left only a handful of public U.S. railroad companies, their earnings and their stocks have attracted investor attention.

So, the billionaire investor's bet on Burlington Northern Santa Fe Corp. is the latest sign that the resurgence in railway stocks has some strength over the long haul.

.......

"The business model is a good value at this price, with not much substitute product out there in terms of competition, and it has pricing power," says David Carr, co-manager of the Oak Value Fund, part of Oak Value Capital Management, which has net assets of $148 million. Berkshire makes up 9% of the fund.


The bold sections in the last paragraph are key to Buffet's thinking on this move. He likes companies that have near-monopolies on key products. This is why he purchased the Washington Post a long time ago -- it was the only paper in the nation's capital and it had a strong brand name. The same is true of the remaining publicly traded railroads.

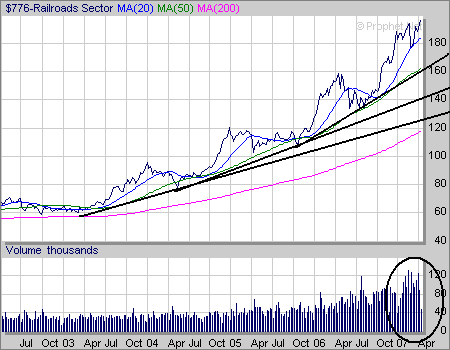
Here is a chart of the railroad sector from Prophet.net:

Photo Sharing and Video Hosting at Photobucket

This is an interesting time to buy, at least according to the chart above. Technically, it appears the railroad sector may by topping out. We've had a long bull run of at least 4 years. The recent high-volume activity at what appears to be a top could be classified as a buying climax -- a market period where there is a ton of selling at a a top, but prices don't move considerably higher. Notice the chart could be forming a double-top, or it could be moving through resistance to achieve higher prices.
China's Trade Surplus Doubles in First Quarter

From Bloomberg:

China's trade surplus almost doubled in the first quarter, adding to friction as the U.S. takes complaints against its second-largest trading partner to the World Trade Organization.

The surplus widened to $46.4 billion from $23.3 billion a year earlier, the customs bureau said on its Web site today. The March gap was $6.87 billion, smaller than economists expected.

.....

Chinese businesses rushed to sell products overseas in January and February in anticipation of government measures to slow exports and because of protectionist sentiment abroad, said Wang Qing, an economist at Bank of America Corp. in Hong Kong.


WOW -- just, wow.

That is one powerful headline. This will do an awful lot to increase protectionist sentiment in the US. Some of this is warranted, especially in light of China's $1 trillion in dollar reserves held by its central bank. That is a pretty good indication the yuan is a touch undervalued in the marketplace.

Monday, April 9, 2007

Oil Drops; Markets Not Impressed

From Bloomberg:

Crude oil plunged $2.77 a barrel in New York, the biggest decline in three months, on speculation that an Energy Department report will show U.S. inventories jumped last week as refiners unexpectedly shut units.

Crude-oil supplies in Cushing, Oklahoma, where oil traded in New York is delivered, surged 12 percent in the week ended March 30, Energy Department figures show. Fires and power outages have forced refiners to shut units, reducing crude-oil demand. Oil prices also fell because release of British naval personnel on April 5 eased concern of a supply disruption in the Persian Gulf.

``Crude oil is pulling everything lower,'' said James Ritterbusch, president of Ritterbusch & Associates in Galena, Illinois. ``It looks like we will see record inventories in Cushing this week because of all of the refinery outages.''


This makes today's lackluster stock market that much more questionable. Stocks should have loved oil going lower, especially in conjunction with the jobs report from Friday. But the markets obviously weren't impressed enough to rally.

Markets Looking A Bit Weaker

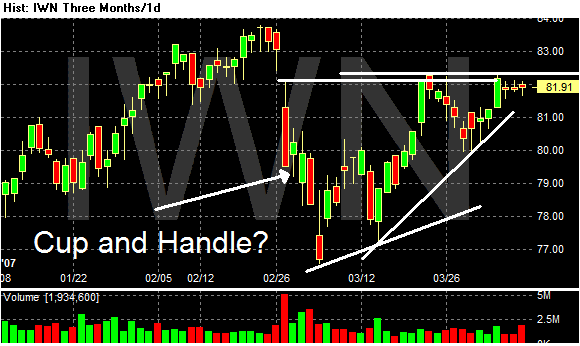
All three markets formed a cup and handle formation over the last few weeks. This pattern is usually considered bullish. However, all three markets have failed to break-out in a strong rally.

While there is a gap in the SPY and QQQQ charts, notice the volume has continually declined for the last four days. This indicates people are less and less excited about this rally, which is a bearish signal.

Photo Sharing and Video Hosting at Photobucket

Photo Sharing and Video Hosting at Photobucket

The IWNs never broke our over resistance. Instead we see three very narrow trading days right below resistance. This could mean a consolidation below resistance before a more up. However, the weakness of the rallies in the other two indexes does not help that theory out.

Photo Sharing and Video Hosting at Photobucket

The Markets Today

The markets see-sawed today. But -- notice the late day sell off on heavy volume. That is a bearish signal.

Photo Sharing and Video Hosting at Photobucket

Photo Sharing and Video Hosting at Photobucket

Photo Sharing and Video Hosting at Photobucket

AMD Earnings Announcement Creates Concern

From Briefing.com

We heard last month from semiconductor company Advanced Micro Devices (AMD 13.40, +0.54) that it expected to fall short of its previous first quarter revenue forecast of $1.6 billion to $1.7 billion. AMD didn't provide any specific guidance at the time, but today, it has offered some granularity saying it expects revenues to be approximately $1.225 billion.

The updated guidance is nearly 25% below the mid-point of its original guidance range and marks a 31% decline form the fourth quarter. In turn, it falls well below the current Reuters Estimates consensus estimate of $1.54 billion.

.....

This isn't good news, yet shares of AMD are trading higher in response to the additional announcement from the company that it will be restructuring to increase operational efficiencies and to lower its operating cost structure. As part of this plan, AMD will reduce 2007 capital expenditures by roughly $500 million, significantly reduce discretionary expenses, and limit hiring to critical positions.


AMD's market capitalization is 7.4 billion. This places it in the top 25 of semi-conductor based companies according to Google Finance. In other words, AMD is a pretty important company.

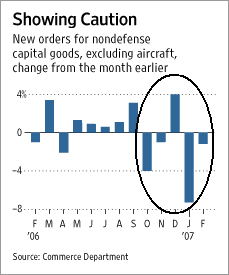
Notice the train of events. Earnings are decreasing, so the company is cutting back on capital spending. According to the latest BEA GDP numbers, nonresidential investment decreased 3.1% in the 4th quarter of 2006. Investment in equipment and software decreased 4.8%. Also remember durable goods orders have decreased 4 of the last 5 months.

Photo Sharing and Video Hosting at Photobucket

AMDs announcement confirms businesses are decreasing their investment spending because of the slowing earnings picture. That may in turn further hinder GDP growth going forward.

More on the Great Utilities Rally

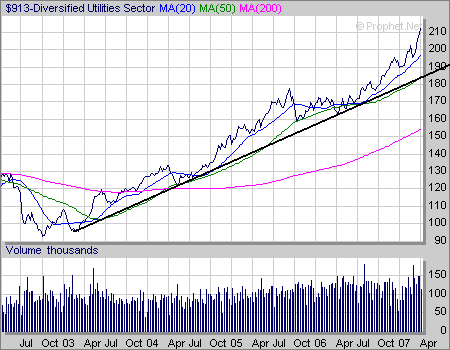
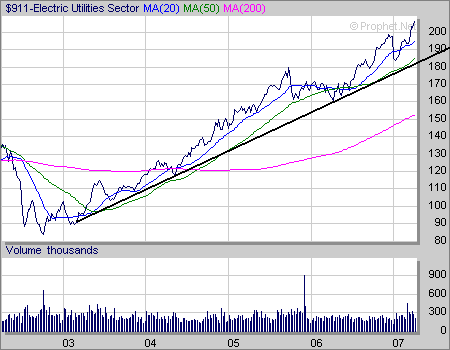
Here are three charts from Prophet.net that break the utilities sector down into smaller sub-parts. Notice that all three sectors have very nice 5-year charts. Also notice that according to Market Gauge utilities are the second best performing sector year to date and over the last 6 months and are the best performing sector over the last 52 weeks.

Also consider the following. According to S&P, earnings increases are slowing down. Durable goods orders are down as is domestic investment. Consumer spending is the only economic area keep the economy afloat. In other words, there is a reason for people to move into more conservative investments. And on that topic, utilities already have strong upward momentum.

Diversified Utilities:

Photo Sharing and Video Hosting at Photobucket

Electric Utilities

Photo Sharing and Video Hosting at Photobucket

Water Utilities

Photo Sharing and Video Hosting at Photobucket

Jobs Report Rally Doesn't Materialize -- At Least Not Yet

Below are three month charts for the SPY, QQQQ and IWN. Notice that after the jobs report on Friday the markets have failed to rally.

This could change sometime in the trading day.

Photo Sharing and Video Hosting at Photobucket

Photo Sharing and Video Hosting at Photobucket

Photo Sharing and Video Hosting at Photobucket

Oil Market Sectors Looking Interesting From a Technical Perspective

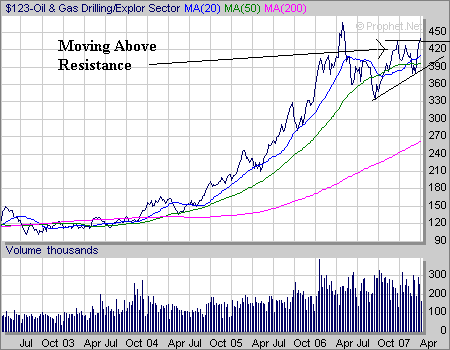
The following charts are from Prophet.net. They are 5-year charts.

I've been watching various sectors of the oil market for the last few months. Three sectors are technically interesting right now.

Drillers and Explorers have moved above the upper trend-line of a consolidation move.

Photo Sharing and Video Hosting at Photobucket

Refiners have made a nice move above an upper-line of a consolidation move.

Photo Sharing and Video Hosting at Photobucket

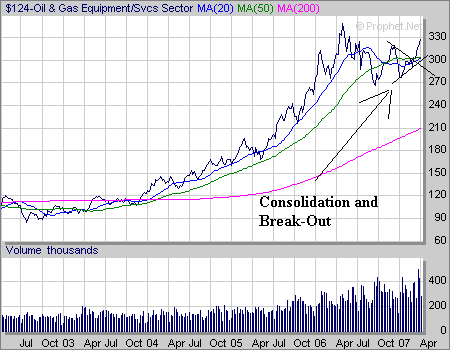
Equipment stocks have broken out from a consolidation move as well

Photo Sharing and Video Hosting at Photobucket

Agricultural Prices Rising Around the Globe

From the WSJ:

Soaring prices for farm goods, driven in part by demand for crop-based fuels, are pushing up the price of food world-wide and unleashing a new source of inflationary pressure.

The rise in food prices is already causing distress among consumers in some parts of the world -- especially relatively poor nations like India and China. If the trend gathers momentum, it could contribute to slower global growth by forcing consumers to spend less on other items or spurring central banks to fight inflation by raising interest rates.

Politicians in markets where food costs are a particularly sensitive matter are moving to counter rising prices before they take a bigger economic toll or fuel unrest. But it remains unclear whether those policies will be enough to contain the current pressures, or whether a longer-term bout of food-price inflation -- similar in ways to the recent climb in prices for oil and other commodities -- is in the offing.


The last three months the US has seen larger than normal increases in the food components of the CPI and PPI. One of the main reasons is the change to ethanol based fuel in the US. This has greatly increased US demand for corn, which in turn has increased corn prices etc...

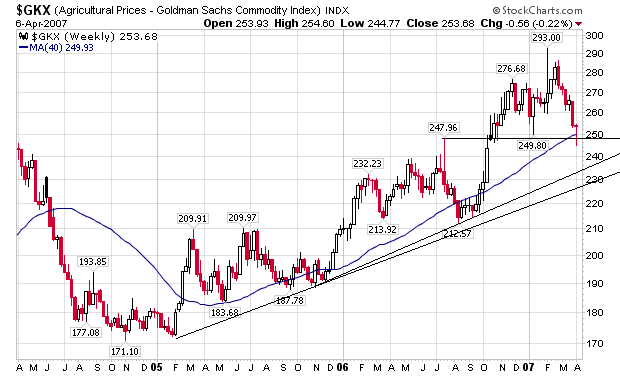
Here is a chart of the agricultural futures. It shows the two year increase in agricultural prices. This is another area of inflationary pressure the Fed is probably concerned about.
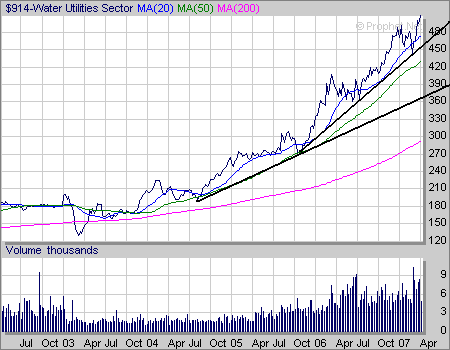
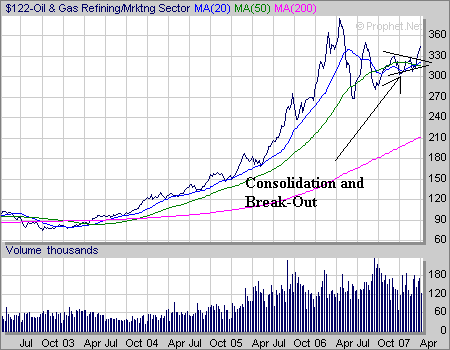
Photo Sharing and Video Hosting at Photobucket

Sunday, April 8, 2007

Happy Easter

It's Easter Sunday. Go spend time with friends and family.

I'll return tomorrow morning.