Saturday, April 7, 2007

Will Export Growth Prevent Recession?

From Barron's (subscription required)

There will be a lot of statistics going in both directions amid weak economic growth, says Bob Doll, global chief investment officer of equities at BlackRock. But Doll continues to expect 5% earnings growth and 7% gains in the S&P 500 this year as booming exports more than offset the housing slowdown.


The devalued dollar -- which makes US goods cheaper abroad -- obviously helps exports.

However, according to the latest GDP report from the BEA, exports accounted for 11.66% of US GDP in chained 2000 dollars in the 4th quarter of 2006. That compares to 16.37% for gross private domestic investment. That means exports have to increase a bit more than the decrease in investment to effectively negate the effect of declining domestic investment. While exports increased 10.6% from the 3rd to 4th quarter of 2006, gross private investment decreased 15.2%. In other words, gross private domestic investment -- which is a larger percentage of GDP -- won the 4th quarter round.

In addition, exports of goods accounted for 85% of that total. Considering the latest ISM numbers indicate the manufacturing sector is just above recessionary levels, it doesn't look as though exports are going to grow fast enough, at least at current levels. Also in that ISM report was a 1.5% increase in exports from 54 to 55.5. Those levels just don't look like they are strong enough to warrant that analysts optimism about exports.

Friday, April 6, 2007

More Subprime Problems

From CBS Marketwatch

American Home Mortgage Investment Corp. cut its first-quarter and full-year profit forecast by more than 25% Friday after being hit by problems in the secondary market for home loans and mortgage-backed securities.

The company also said that it's stopped offering some types of so-called Alt-A mortgages because of the high cost of delinquencies on those loans.

The warning suggests that problems in the subprime-mortgage business have begun spreading to other parts of the home-loan industry.


And the hits just keep on a-comin.....

Earnings Slowing

From IBD:

Analysts see S&P 500 firms posting mid-single-digit gains for the first quarter, ending a run of 18 straight quarters of double-digit growth. Alec Young, equity strategist with Standard & Poor's, projects 5% average quarterly growth. He sees 7% for the full year, down from 14.9% in 2006.

Zacks Investment Research, which tracks median growth, estimates a 7.2% quarterly profit gain for the S&P 500 — well below the fourth quarter's 12.5% increase.

The actual results probably will be higher because upside surprises typically far outweigh misses. Just don't expect the final gain to top 10%.


This is more evidence the economy is slowing.

Dallas Fed Report On the Economy

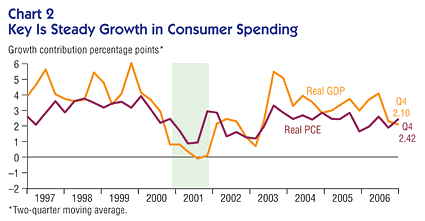
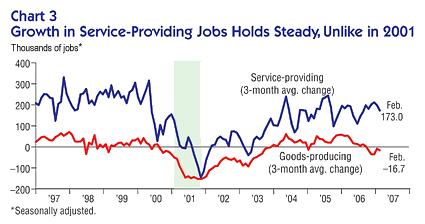
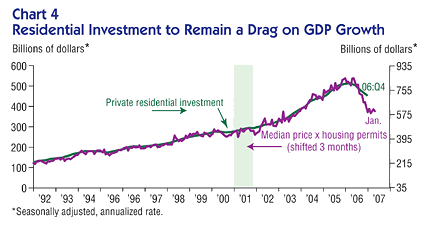
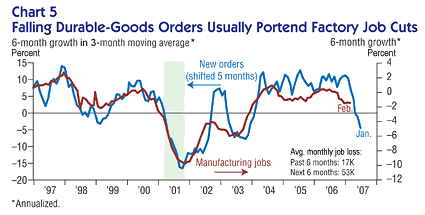
The Dallas Fed has released a report called National Economic Update. I think it's a very good piece on the economy's current status.

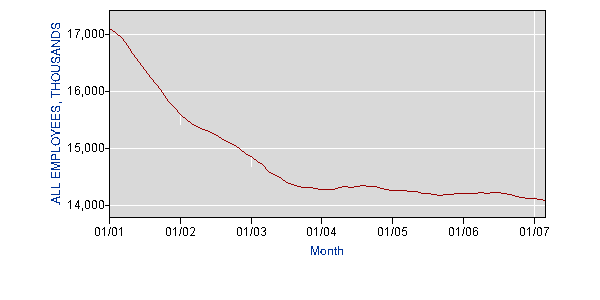
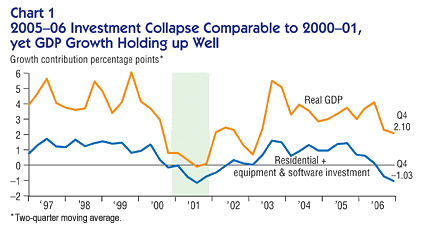
Here's the short version. Overall investment is down. Yet job growth in service industries is providing the consumer with enough money to continue spending. So long as job growth and wages continue to increase, the chances of a recession are low.

However, we don't know if the drop in investment and mortgage market problems will spill over into the larger economy.

The last chart deals with manufacturing jobs and whether the drop in durable goods orders will lead to cuts in manufacturing jobs. Here is a counter-argument. Manufacturing employment hasn't grown during this expansion. That could mean there just isn't that much fat to cut from manufacturing payrolls. Here's a chart of seasonally adjusted manufacturing employment for the last 7 years.

Photo Sharing and Video Hosting at Photobucket

The following charts detail the Dallas Feds report.

Photo Sharing and Video Hosting at Photobucket

Photo Sharing and Video Hosting at Photobucket

Photo Sharing and Video Hosting at Photobucket

Photo Sharing and Video Hosting at Photobucket

Photo Sharing and Video Hosting at Photobucket

Payrolls + 180,000

From Bloomberg:

Hiring in the U.S. rose more than forecast and the jobless rate unexpectedly dropped, giving the economy a spark as it struggles to overcome slumps in housing and manufacturing.

The 180,000 increase in employment followed a 113,000 gain in February that was larger than previously estimated, the Labor Department reported today in Washington. The jobless rate fell to 4.4 percent, matching October's five-year low.

New jobs and bigger paychecks are giving more Americans the means to spend, preventing the housing recession from spreading to the rest of the economy. The drop in the jobless rate may concern Federal Reserve policy makers who've said the threat of inflation is a bigger risk for the expansion.


Here's a link to the report

First, The BLS revised February's number up. This has been a standard pattern for this expansion. The BLS added 800,000 or so jobs in an annual revision a few months ago.

Now, the internals are pretty solid.

Construction jobs increased 56,000. The means all the construction workers laid-off in January were essentially rehired. My guess is non-residential construction is doing most of the hiring at this point.

Oddly, professional services lost 7,000. That area of job growth has been pretty consistent for most of this expansion.

Education and health added 54,000 and leisure/hospitality added 21,000. The health area employment has been solid for the last 4 years as has leisure and hospitality.

Average hourly earnings increase 6 cents, and hours worked increased .1 hours.

This is a good report.

Thursday, April 5, 2007

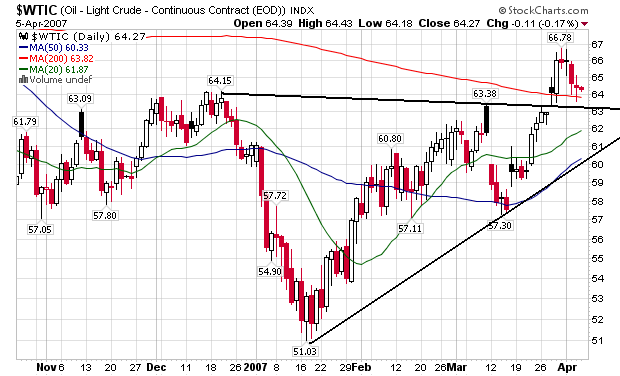
Oil Prices Holding Above Support

The British prisoner deal is over. Oil prices are now above resistance.

Photo Sharing and Video Hosting at Photobucket

The Markets Today

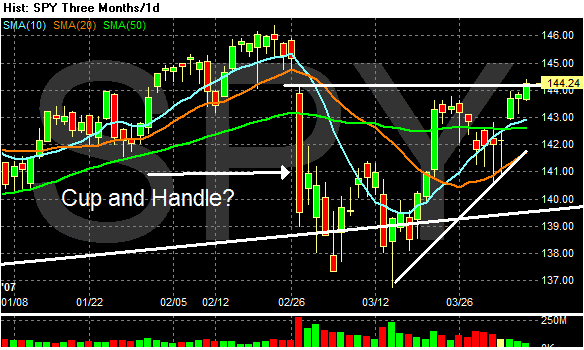
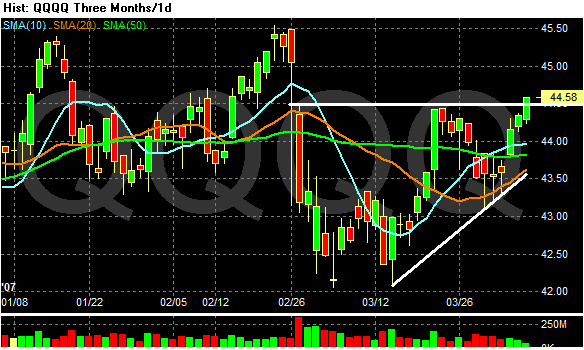
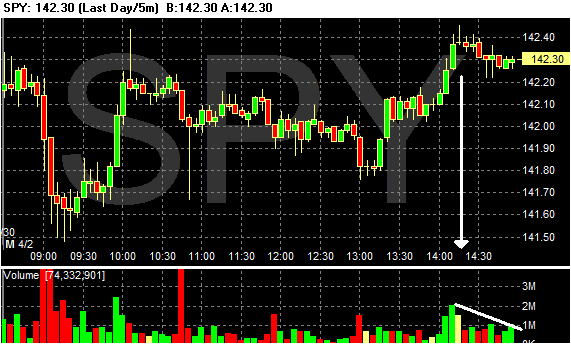
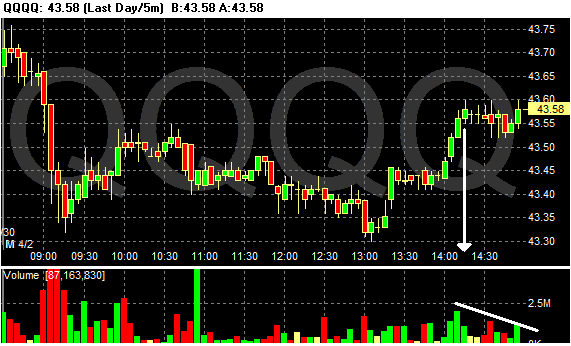
Today is technically Friday because the markets are closed tomorrow. The markets are trying to break through resistance. The QQQQs and SPYs are just over the line. But the volume is really weak on the break-out which makes it really technically suspect.

Photo Sharing and Video Hosting at Photobucket

Photo Sharing and Video Hosting at Photobucket

Photo Sharing and Video Hosting at Photobucket

Gas Prices Heading Higher?

From CBS Marketwatch:

"Just as the market was trying to digest exactly what this love-fest meant for the energy complex, the Department of Energy blindsided us with a wildly bullish 5-million-barrel drop in gasoline supply," said Phil Flynn, a senior analyst at Alaron Trading.

"For gas consumers, the DOE report can best be described as disturbing at the very least," he said in an e-mailed note to clients. "Gasoline supplies are tightening at a disturbing rate and that could mean only bad news for the consumer as we get ready to start a new summer-driving season."

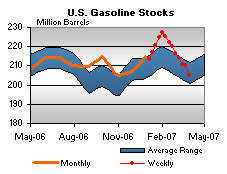
On Wednesday, Energy Department data showed a 5 million barrel decline in supplies of motor gasoline for the week ended March 30 -- much bigger than the market was expecting. Crude supplies rose a bigger-than-expected 4.3 million barrels while distillates were unchanged in the latest week.


Here's a chart of gasoline inventories from This Week in Petroleum:

Photo Sharing and Video Hosting at Photobucket

This has lead to continued price increases:

Gasoline prices saw another significant increase for the week of April 2, 2007, jumping 9.7 cents to 270.7 cents per gallon. This is the ninth consecutive week of increases; prices are now 11.9 cents per gallon higher than at this time last year. All regions reported higher prices.


This is not a good sign at all.

Inflation May Increase

From Ticker Sense:

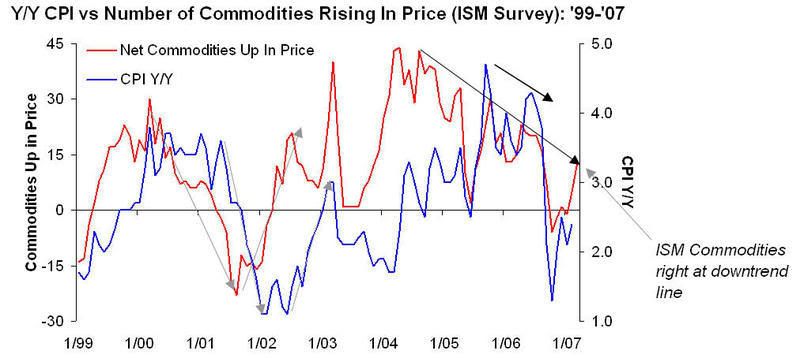
Besides the higher than expected prices paid index in this morning's ISM report, another aspect of the report shows that we could be in store for another up tick in inflation. Each month, in the Commodities survey, respondents are asked about the pricing conditions for the commodities they deal with. Namely, are they up in price, down in price, in short supply, or none of the above. As we have highlighted in the past, increases in inflation are often preceded by increases in the number of commodities rising in price, while decreases in the rate of inflation are preceded by respondents noting that more commodities are falling in price than rising.

In this month's survey, respondents noted increases in thirteen different commodities, with no commodities showing a decline in prices. This marks the highest reading since August of last Summer, and puts the current reading right on the downtrend line from 2004.


The provided chart indicates a very high correlation between this index and inflation.

Photo Sharing and Video Hosting at Photobucket

Dollar Update

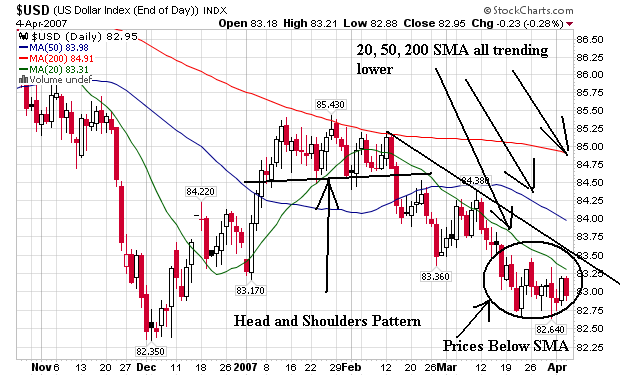
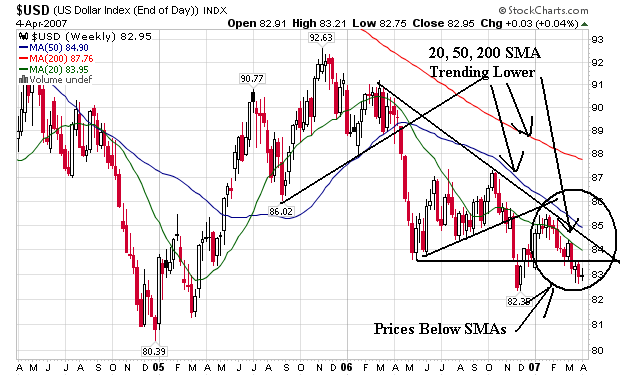
The daily and weekly dollar charts are still weak. Both have the same common bearish indicators:

1.) All the simple moving averages are trending down.

2.) The prices on both charts are below the simple moving averages

3.) Both charts are below a downward sloping trendline.

The daily chart

Photo Sharing and Video Hosting at Photobucket


The Weekly Chart


Photo Sharing and Video Hosting at Photobucket

Iran Releases Britons; Watch Oil Prices

It appears the Iranian hostage crisis is over. This event led to a spike in oil prices, which rose above the technically important $64/bbl. Keep an eye on oil prices to see if the retest $64 and rebound or fall through.

Consumer Spending One Economic Bright Spot

From Bloomberg:

Housing is in recession, a factory downturn lingers and companies are cutting investment. Even so, buoyant American consumers propelled the economy into its 65th month of expansion this week.

Rising wages and a jobless rate that's close to a five-year low are giving consumers the means to keep spending and maintain economic growth, albeit at a slower pace. More people consider jobs abundant, according to the Conference Board, whose March survey showed consumer confidence above the 2006 average.


The official unemployment rate is 4.5%. This has led to an increase in wages:

Personal income increased $65.4 billion, or 0.6 percent, and disposable personal income (DPI) increased $53.8 billion, or 0.5 percent, in February, according to the Bureau of Economic Analysis.
Personal consumption expenditures (PCE) increased $55.5 billion, or 0.6 percent. In January, personal income increased $110.5 billion, or 1.0 percent, DPI increased $74.2 billion, or 0.8 percent, and PCE increased $50.2 billion, or 0.5 percent, based on revised estimates.


Bernanke noted this trend in his latest Congressional testimony:

Employment has continued to expand as job losses in manufacturing and residential construction have been more than offset by gains in other sectors, notably health care, leisure and hospitality, and professional and technical services, and unemployment remains low by historical standards. The continuing increases in employment, together with some pickup in real wages, have helped sustain consumer spending, which increased at a brisk pace during the second half of last year and has continued to be well maintained so far this year. Growth in consumer spending should continue to support the economic expansion in coming quarters. In addition, fiscal policy at both the federal and the state and local levels should impart a small stimulus to economic activity this year.


This makes Friday's employment report that much more important because it is one bright spot in the economy. Also pay attention to the "inside numbers" -- population growth, job growth related to population and the labor participation rate. Those figures will tell us the depth of the labor market.

Natural Gas Cartel Forming?

From the WSJ:

Western leaders have long had to contend with OPEC, which leveraged control of a large share of world oil trade into geopolitical punch. Now, the West may begin facing a new energy nemesis: a potential natural-gas cartel.

The Gas Exporting Countries Forum, an assembly of 14 of the world's largest gas producers, will meet Monday and Tuesday in the Qatar capital of Doha. Major members such as Iran are openly talking of someday creating a version of the Organization of Petroleum Exporting Countries for gas, an increasingly important energy source and raw material for consumers and companies around the globe.

A group with OPEC's market-swaying might is highly unlikely to emerge anytime soon. But the forum's effort to lay the foundation for greater collaboration as the gas trade expands and grows more critical to global energy needs is ringing alarm bells in Western capitals. The group's long-term goals -- more influence over gas markets and greater political clout over clients in the U.S., Europe and Asia -- face tall hurdles but may be achievable nonetheless.


This is just the kind of news the Fed wants to hear right now.

European Inflation Still Around

From the WSJ:

Euro-zone inflation risks "have not diminished" in recent months and the European Central Bank hasn't signaled that interest rates are close to peaking, European Central Bank Governing Council member Klaus Liebscher said.

The comments arrived as surveys of purchasing managers working for service providers and manufacturers showed the euro-zone economy continued to expand at a rapid pace in March, and the remarks implied that the central bank is likely to raise interest rates at least one more time this year.

"We will say that [rates are close to a peak] when the time comes," Mr. Liebscher, who is also the governor of Austria's central bank, said in an interview. He reiterated that interest rates are moderate and monetary policy is still supporting economic growth.


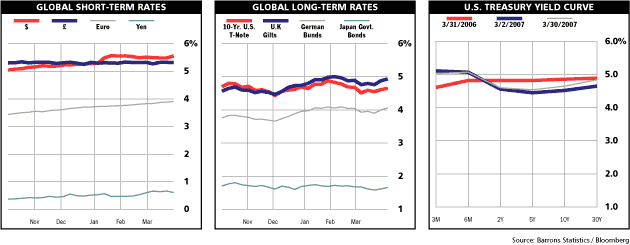
There are two reasons why the levels of various regions interest rates are important. The first is the carry trade. A "carry-trade" is an eco-geek way of saying, "borrow money in a region where interest rates are low and lend in regions where interest rates are high." Secondly, interest rates are important for currency traders. If a currency has a higher interest rate, traders will consider that currency more valuable. Some traders invest their currency holdings in that currencies interest rate investments.

Higher inflationary pressures mean higher interest rates. Higher interest rates mean a more valuable currency.

Also remember, there is slow global move to diversify currency reserves from dollars, primarily in euros. As European interest rates increase to stave off inflationary pressures expect this move to continue.

The following graph is from Barron's "The Current Yield", a weekly column on the bond market.

Photo Sharing and Video Hosting at Photobucket

Houing Inventories Increase In 20 Cities

From the WSJ:

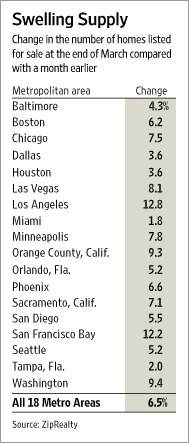
The number of homes listed for sale in 18 major U.S. metropolitan areas at the end of March increased 6.5% from a month earlier, according to data compiled by ZipRealty Inc., a national real-estate brokerage firm in Emeryville, Calif. The data cover listings of single-family homes, condominiums and town houses on local multiple-listing services.

Over the past 22 years, home inventories nationwide have increased an average of 1.7% in March from February, according to Credit Suisse Group. Supplies typically rise modestly in March as sellers pursue the many families with children who seek new homes in the spring, so they can move during summer vacations.


Inventories are already at high levels. News like this does not help to alleviate that problem.

In addition, this is another signal that housing prices are probably headed lower for a long time.

Here's a list of the cities and the percentage change in inventory.

Photo Sharing and Video Hosting at Photobucket

Wednesday, April 4, 2007

Daily Roundup

I was in court all day, so I'm a bit behind on the news.

Here are the highlights:

Gas prices increase again:

Gasoline prices saw another significant increase for the week of April 2, 2007, jumping 9.7 cents to 270.7 cents per gallon. This is the ninth consecutive week of increases; prices are now 11.9 cents per gallon higher than at this time last year. All regions reported higher prices. East Coast prices were up 9.6 cents to 267.1 cents per gallon, while Midwest prices rose 9.6 cents to 261.4 cents per gallon. The Gulf Coast saw the largest regional increase, with prices up 12.3 cents to 256.5 cents per gallon. In the Rocky Mountains, prices increased 8.1 cents to 261.9 cents per gallon. West Coast prices were up 8.0 cents to 309.6 cents per gallon, with the average price for regular grade in California up 7.6 cents to 322.8 cents per gallon, 48.5 cents per gallon above last year's price.


Last year we saw gas prices over $3.00 gallon. If prices stay on the same trajectory, we're in for an ugly summer.

This also increases pressure on the Fed not to lower interest rates.

I am also wondering how CPI will look next month with all of these increases.

ISM is increasing, albeit at a slower pace:

"Non-manufacturing business activity increased for the 48th consecutive month in March," Nieves said. He added, "Business Activity, New Orders and Employment increased at a slower rate in March than in February. The Prices Index increased 9.5 percentage points this month to 63.3 percent

Here's the anecdotal evidence:

* "Overall core business activity is slightly slower." (Finance & Insurance)
* "Constant increases in fuel costs seem to be causing an economic downturn. Outlook remains cautiously optimistic." (Professional, Scientific & Technical Services)
* "Business activity seems to have slowed with some brightness on the horizon." (Wholesale Trade)
* "Market remains stable." (Information)
* "Business is OK but not great. We will not get the price in the market. Making our year depends upon cost control." (Agriculture, Forestry, Fishing & Hunting)


The prices component is troubling:

Prices paid by non-manufacturing organizations for purchased materials and services increased in March for the 46th consecutive month (following the recent seasonal adjustments). ISM's Non-Manufacturing Prices Index for March is 63.3 percent, 9.5 percentage points higher than February's seasonally adjusted index of 53.8 percent. In March, the percentage of respondents reporting higher prices increased by 21 percentage points to 38 percent as compared to February. The percentage indicating no change decreased from 74 percent in February to 58 percent in March. The percentage of respondents noting lower prices decreased from 9 percent in February to 4 percent in March.


Again, like gas prices, this type of news may prevent the Fed from lowering interest rates unless there is a really big slowdown.

Copper and Gold Moving Up

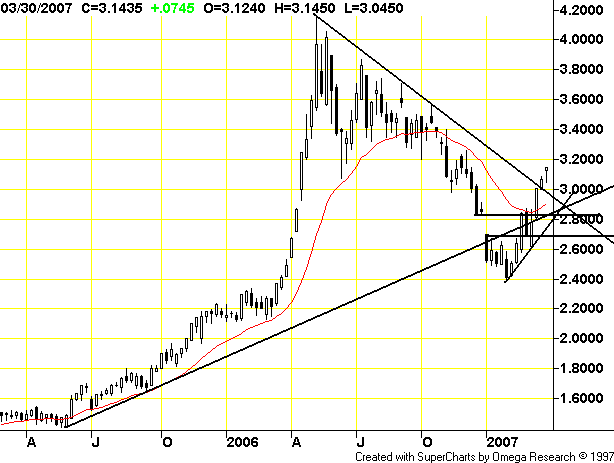
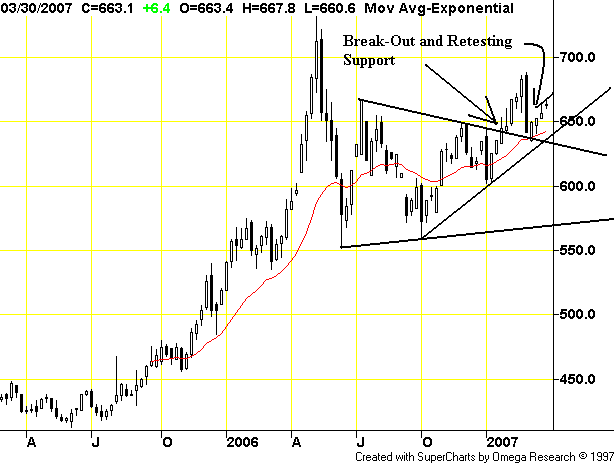
Here are the copper and gold charts, respectively.

Photo Sharing and Video Hosting at Photobucket

Photo Sharing and Video Hosting at Photobucket

Oil Drops; Will Support Hold?

From IBD:

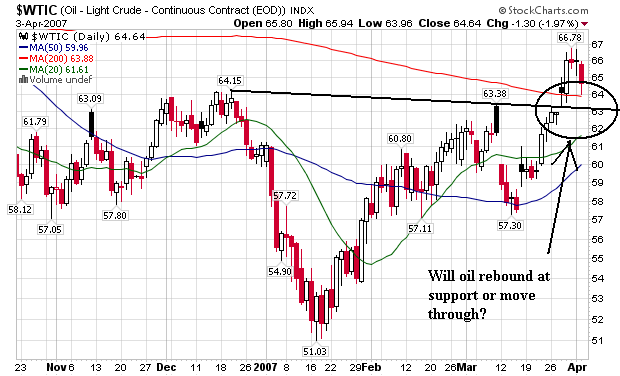
May crude fell $1.30 to $64.64 a barrel on easing U.K.-Iran tensions. That's still up $2.95 from March 22, the day before Iran captured 15 British sailors. RBOB gasoline futures fell by $2.51 cents to $2.0177 a gallon. Heating oil futures lost 2.38 cents to close at $1.8387. The Energy Dept. releases U.S. petroleum stockpile data on Wed.


Photo Sharing and Video Hosting at Photobucket

We have three support lines here.

1.) The line drawn on the chart. This is a neckline of a reverse/upside down head and shoulders formation.

2.) The 20 day SMA

3.) The 50 day SMA.

SubPrime Delinquencies Increase

From the WSJ (subscription required):

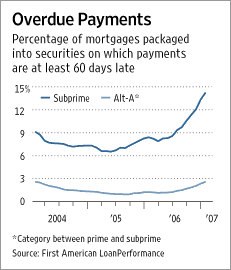
The First American data show that in January payments were at least 60 days late on 14.3% of "subprime" loans that had been packaged into securities, up from 13.4% in December and 8.4% in January 2006. Subprime loans are those made to borrowers with weak credit records or large debts in relation to their incomes.

For Alt-A loans -- a category between prime and subprime that includes many loans that don't require full documentation of the borrower's income or assets -- the late-payment figure rose to 2.6% in January from 2.3% in December and 1.3% in January 2006.


Here's the graph from the article:

Photo Sharing and Video Hosting at Photobucket

The news from housing continues to deteriorate. Inventories are very high, especially by historical standards. Household debt levels are high by historical and GDP/disposable income measures. Now we have delinquencies increasing -- again.

Tuesday, April 3, 2007

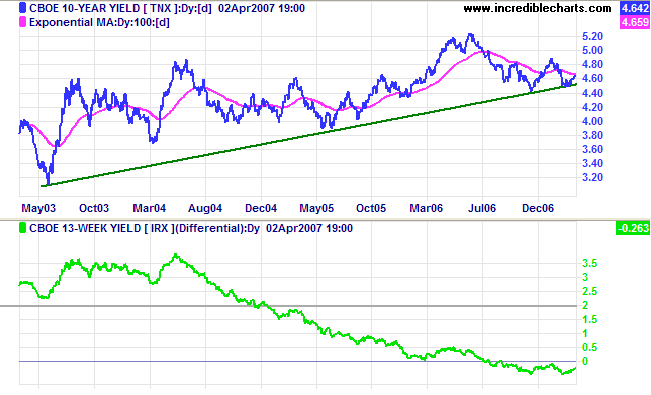
Treasury Yields -- The Long View

Here is a 4 year chart of Treasury Yields from Incredible Charts

Photo Sharing and Video Hosting at Photobucket

Here is some interesting commentary from last week's Barron's (subscription required):

In a replay of tariffs slapped on steel imports in 2002, the Commerce Department said it would impose tariffs of 10.9% to 20.4% on Chinese coated papers in retaliation for subsidies Beijing provides. The dollar reacted negatively to the protectionist measure, which recalls the currency's drop in the wake of the steel tariffs. Although later reversed by the World Trade Organization, those levies helped set off a 35% decline in the dollar against the euro in the following year, writes Ashraf Laidi, CMC Markets' chief foreign-exchange analyst.

Whether or not these new tariffs also are reversed by the WTO, the U.S. actions could trigger retaliation by China, notably further diversification of its currency reserves, the vast majority of which are held in dollars in the form of U.S. bonds. As noted here several weeks ago, one academic study estimated that foreign-capital inflows have lowered long-term U.S. interest rates by 90 basis points (0.9%). All else being equal, less buying of U.S. assets would tend to boost yields.

These higher rates would pile onto the already staggering housing market. Higher inflation resulting from the tariffs and the weaker dollar would add to pressure on the Federal Reserve not to lower rates to offset the effect of a housing slide on the economy, according to T.J. Marta, fixed-income strategist for RBC Capital Markets.


China and the US are in a mutually beneficial relationship; we buy their products, they loan us money.

In addition, China and the US are involved in a currency version of Mutual Assured Destruction. While I have expressed concern about the US/China relationship many times -- and am still concerned -- a move by the Chinese to dump dollars would devalue about $1 trillion in assets held by the central Chinese Bank. In short -- it would hurt them as well.

That does not mean we should not be concerned about China's international reserves. the trade deficit is indicative of a massively imbalanced international trading system. However, calls for monetary collapse based in this situation aren't 100% on the money.

Housing Problems Will Lead to Lower Growth

From Reuters:

A credit crunch stemming from turmoil in the subprime mortgage market will trigger further weakness in housing and keep U.S. economic growth "below trend" most of this year, a UCLA Anderson Forecast unit said in a report on Monday.

The sluggish growth will help clear the way for the Federal Reserve to ease monetary policy at the end of the second quarter despite a historically low 4.5 percent unemployment rate, the economic forecasting unit said in its report.

Citing Fed Chairman Ben Bernanke's recent comments about the link between inflation and employment levels appearing "looser" than in past decades, the unit projected three cuts to the Fed Funds rate by the end of the year, taking it to 4.5 percent from 5.25 percent currently.


While I agree completely that the mortgage problems will hold growth below "full potential", I don't see the Fed lowering rates anytime soon.

The Fed has been consistent in its inflation pronouncements. Bernanke has highlighted that recent lower inflation was the result of lower energy prices. Since that statement, oil spiked over the technically important $64 price level. Gas prices are higher this year than the same time last year, and gas and oil inventories are lower than the same time last year.

In addition, we now have agricultural prices to deal with. For the last three months, the food price component of the PPI and CPI have shown strong increases. While a record corn planting helped to lower corn prices recently, I seriously doubt that increased supply will be sufficient to adequately supply increased ethanol demand. In short, I don't see agricultural prices playing into the Fed's hands right now.

US Car Companies Market Share Continue to Decline

From the San Jose Mercury News:

Toyota's U.S. sales jumped 11.7 percent last month, boosted by record hybrid sales and strong overall car sales, while Ford's sales dropped 9 percent, DaimlerChrysler sank 4.1 percent and General Motors slid 4 percent.

The numbers Tuesday come as the domestic automakers have seen Asian rivals led by Toyota Motor Corp. capture a growing share of the U.S. market. But despite its decline, Ford still held off Toyota for the No. 2 U.S. sales spot for the month.

In all, Toyota sold 242,675 light vehicles in the U.S., including 140,009 cars, up 19.4 percent from the same month a year ago, and 102,666 trucks, a 2.7 percent increase. So far this year, Toyota has sold 61,635 hybrids in the U.S., up 68 percent from the first three months of last year. That includes 28,453 hybrids last month.


I've been at a loss to explain people who are bullish on Detroit. Until we know that gas prices will drop to say $2.00/gallon for a long time SUVs and truck sales will continue to decline. Considering oil's supply and demand are very tight -- and will only get tighter -- that's not going to happen.

In addition, Toyota has now aligned itself with the hybrid. That means Detroit will have to play catch-up. Again

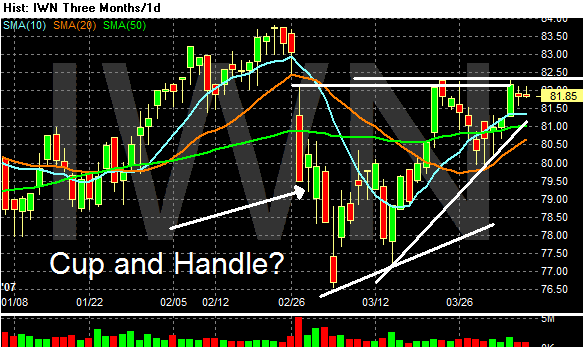
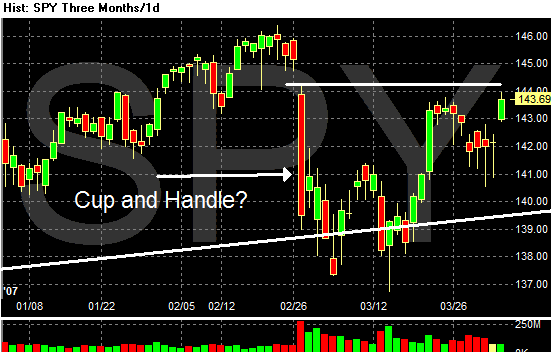
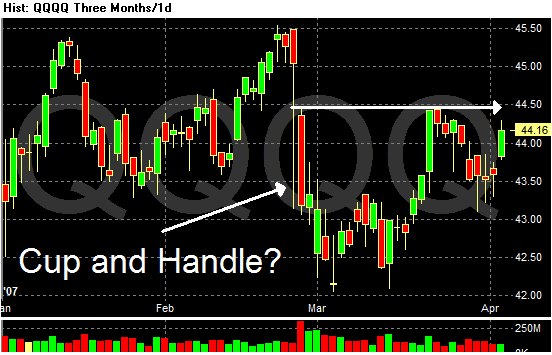
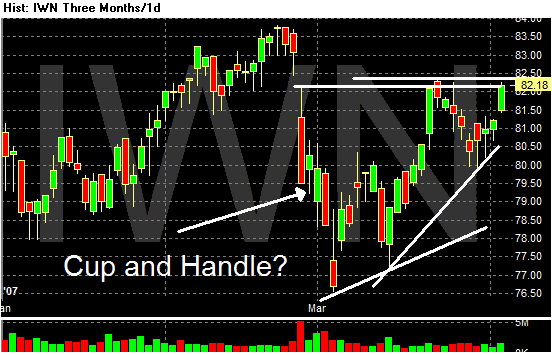
The Indexes Are Forming Lots of Cup and Handles

A Cup and handle formation is a moderately common chart pattern. It's a combination of a rounding bottom and an ascending triangle pattern.

The SPYs, QQQQs and IWNs have all formed a cup and handle pattern since the China sell-off a few weeks ago.

In addition, all of the averages are still trading below the technically important price level from the start of the China sell-off.

Photo Sharing and Video Hosting at Photobucket

Photo Sharing and Video Hosting at Photobucket

Photo Sharing and Video Hosting at Photobucket

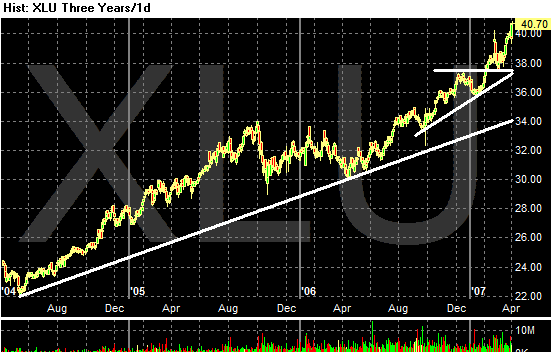
The Great .....Utilities Rally?

Something I have not seen anything on.

The Utilities ETF has almost doubled in price over the last three years. Remember when utilities were boring?


Photo Sharing and Video Hosting at Photobucket

The Markets Today

From the Street.com

U.S. stocks jumped Tuesday as a slump in oil prices and an upbeat report on the housing sector woke up buyers.

The Dow Jones Industrial Average was adding 145 points, or 1.2%, to 12,527, putting the blue-chip index back in to positive territory for the year. The S&P 500 was gaining 15.5 points, or 1.1%, at 1440, and the Nasdaq Composite was rising 33.5 points, or 1.4%, to 2455.

Helping the market's mood was a drop of $1.29 in oil futures to $64.65 a barrel. Most other commodities fell, as well, including a decline of 17 cents in the price of natural gas to $7.50 per million British thermal units.


I think the easing of Mid-east tensions was the primary reason for the rally. Oil prices are a big contributor to inflationary pressure. As oil prices come down, inflationary pressures back-off which in turn gives the Fed more leeway with interest rate policy.

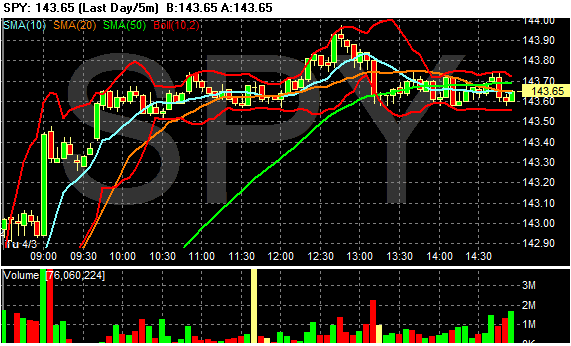
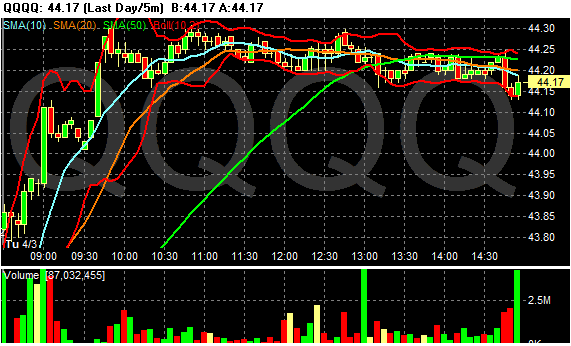
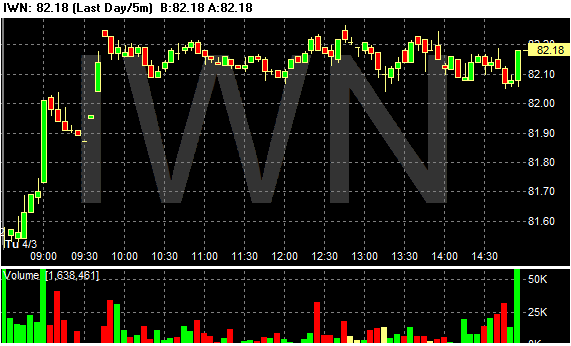
Here are the charts. Notice the initial jump followed by a really narrow trading range.

Photo Sharing and Video Hosting at Photobucket

Photo Sharing and Video Hosting at Photobucket

Photo Sharing and Video Hosting at Photobucket

Business Investment Weakening

From Business Week:

Business outlays for new equipment and facilities have slowed sharply over the past year. That's important because when businesses expand their operations they also add to their payrolls. Job growth over the past couple of years has been the primary support under consumer spending, so any sharp slowdown in capital spending would most likely have an even broader impact on consumers than the weakness in housing.

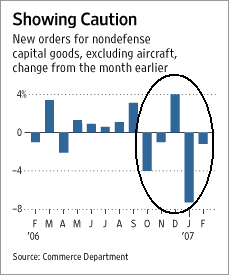
Inflation-adjusted expenditures for things like computers, heavy machinery, factories, and warehouses grew only 3.9% per quarter during the final three quarters of 2006, after increases averaging 8.2% in the previous three quarters. Spending in the final quarter of 2006 dropped for the first time in almost four years, and there's more weakness to come. In January and February, orders for capital equipment have fallen sharply, putting them far below their fourth-quarter level and suggesting the economy will struggle to reach a 2% growth rate in the first quarter.


Here is a chart of durable goods orders.

Photo Sharing and Video Hosting at Photobucket

This is not welcome news.

Pending Home Sales Surprise on the Upside

From Bloomberg:

More Americans signed contracts to buy previously owned homes in February, easing concern the real- estate market will worsen.

The index of signed purchase agreements, or pending home resales, rose 0.7 percent to 109.3, after a revised 4.2 percent drop in January, the National Association of Realtors said today in Washington. The index was down 8.5 percent from February 2006.

Rising incomes and lower prices are making homes more affordable, offsetting concern that subprime mortgage defaults will add to the glut of properties already on the market. Federal Reserve policy makers forecast the damage to the economy from the housing slump will be contained, allowing the expansion to proceed at a ``moderate'' pace.


From CBS MarketWatch:

Pending sales of U.S. homes rose by 0.7% in February, although the gain may have been held in check by bad weather during the month and possible negative impacts from the shakeout in the subprime lending market, the National Association of Realtors said Tuesday.

.....


"If it wasn't for the unusually bad weather in February, we'd be seeing a better performance in pending home sales," said NAR chief economist David Lereah. "We also may be seeing some fallout from a decline in subprime lending."

......

Pending homes sales rose in the South and Midwest but fell in the Northeast and the West, the Realtors said. Sales rose by 4.5% in the South and by 2.9% in the Midwest. In the Northeast, sales dipped by 1.3%. In the West, pending sales fell by 6.0%.


From the National Association of Realtors Press Release:

The Pending Home Sales Index,* based on contracts signed in February, stood at 109.3 – down 8.5 percent from February 2006 when it reached 119.4, but is 0.7 percent higher than a downwardly revised reading of 108.5 in January. Earlier, mild weather caused the index to spike at 113.3 in December.

.......

The index is a leading indicator for the housing sector, based on pending sales of existing homes. A sale is listed as pending when the contract has been signed but the transaction has not closed, though the sale usually is finalized within one or two months of signing.


Let's go back through these releases.

1.) January was revised downward. That's not a good sign.

2.) This is not a very large increase.

3.) The chief cheerleader economist says weather kept the numbers in check. However, sales dropped 6% in the West -- a region not hit by bad weather.

4.) People can still cancel the contract for a variety of reasons after signing the contract.

5.) "We also may be seeing some fallout from a decline in subprime lending." Ya think?

6.) Pending numbers are still down year-over-year in a big way. That's also not good.

My guess is one or both of the following:

1.) This is a statistical blip on a downward trajectory and/or

2.) This number will come down in the coming months.

Oil Falls $1 On Diplomacy Comments

From Reuters:

U.S. oil fell more than $1 on Tuesday as Britain and Iran said they were willing to use diplomacy to end a row over 15 British sailors and marines seized in the Gulf on March 23.

"We're not looking for a confrontation over this and actually the most important thing is to get people back safe and sound. And if they want to resolve this in a diplomatic way the door is open," British Prime Minister Tony Blair told a radio station in Scotland.

Investors interpreted the comments as a favorable response to apparently conciliatory remarks by Iran, the world's fourth biggest oil exporter, late on Monday.


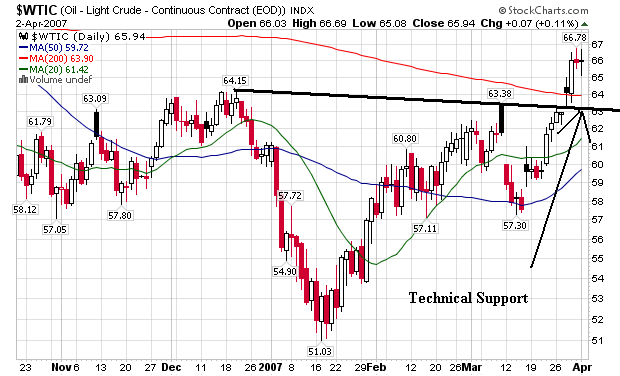
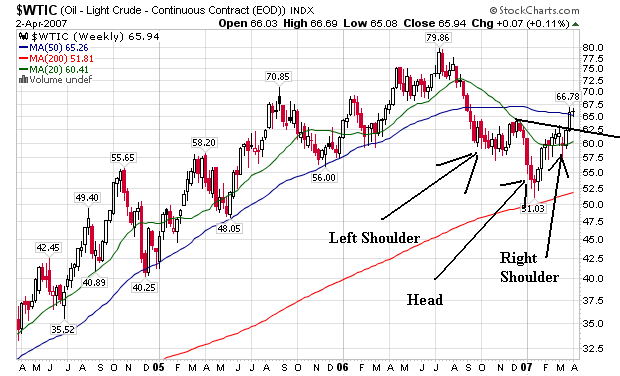
As the daily chart shows, oil broke through resistance courtesy of the latest Mid-east diplomatic crisis. With the prospects of a peaceful settlement developing, it appears prices are falling. Now we have to see if previous resistance becomes support or not.

Photo Sharing and Video Hosting at Photobucket

At the end of last week, I wrote the weekly oil market may be forming a reverse head and shoulders bottom. If that was the case, then we should expect the markets to retest support at the neckline and then rally again. If we see a break of the trendline, we'll know I was wrong.

Photo Sharing and Video Hosting at Photobucket

Always remember: Technical analysis is not a science. It should be used in conjunction with fundamental analysis.

FA = What to buy

TA = When to buy.

Semiconductor Sales Post Low Year Over Year Totals

From IBD:

Worldwide semiconductor sales rose 4.2% in Feb. to $20.09 bil, but were down from Jan.'s $21.48 bil mark, according to the Semiconductor Industry Association. The SIA's president said that a lower average-selling price and fewer unit shipments were key factors in the slip. The growth was the smallest year-over-year increase since Aug. '05, when it grew 1.7%. UBS said the sales numbers were weaker than expected, but predicted they would rebound for the rest of the year.


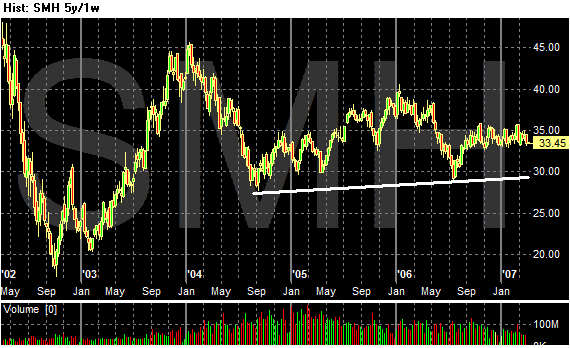
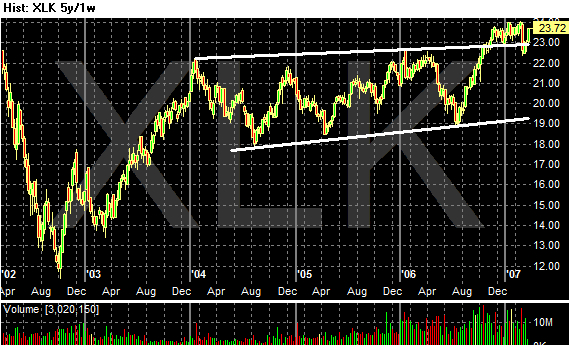
Maybe it's the old "I came of age during a tech rally", but I still keep expecting the semiconductor and technology shares overall to break-out in this rally. However, the 5-year charts are less than inspiring. Both the semis and tech shares have been range bound.

Here's the ETF for the SMH (semis) and tech shares, respectively.

Photo Sharing and Video Hosting at Photobucket

Photo Sharing and Video Hosting at Photobucket

St. Louis Fed's Poole On Inflation

From Bloomberg:

St. Louis Federal Reserve Bank President William Poole said he would have a ``high hurdle'' for favoring interest-rate cuts if inflation stays near the current pace.

``There would have to be a high hurdle for me to want to be cutting rates if the economy is only marginally and tentatively on the weak side'' and inflation isn't slowing toward 2 percent, Poole said after a speech in New York today.

Poole's comments on inflation differed from the text of his remarks distributed to reporters by the St. Louis Fed beforehand. In that version, Poole said ``inflation is retreating as energy prices stabilize.'' The St. Louis Fed chief told reporters later that that was a previous draft.


My guess is there is some back door political maneuvering going on. Last week, Bernanke clarified the Fed's policy in his Congressional testimony. Bernanke once again focused on inflation. Now Ben wants the Fed to be consistent in its policy orientation.

Reading between the lines, one has to wonder why the speech's text wasn't altered.

Monday, April 2, 2007

Long-Term P&F Charts

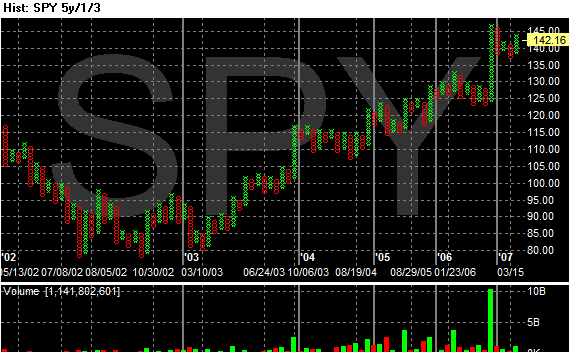
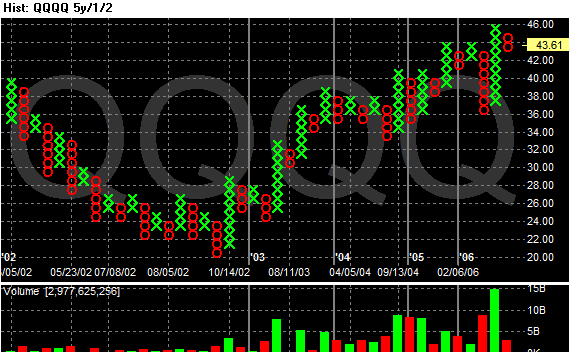
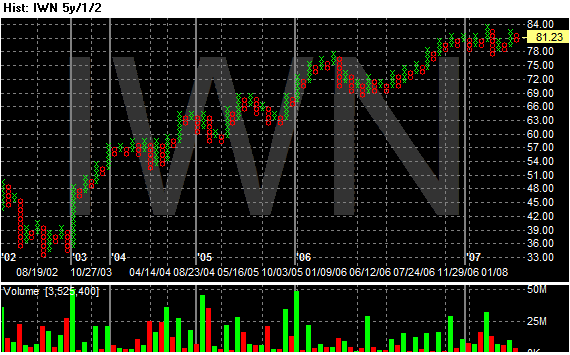
Here is a look at the SPYs, QQQQs and IWNs from a P&F chart perspective. Pay particular attention to the volume totals underneath the green moves up. Think of these as a really, really rough on balance volume indicator. What these charts indicate is on the SPYs and IWNs there are still a lot of people who are still in the market -- the recent moves haven't scared them out.

The QQQQs are a different story. They indicate that aside from the last rally that began at the end of last summer, traders have in general been getting out of the QQQQs. Think of this as something similar to a long-term tech hangover from the 1990s.

Photo Sharing and Video Hosting at Photobucket

Photo Sharing and Video Hosting at Photobucket

Photo Sharing and Video Hosting at Photobucket

The Markets Today

First, the good news: The SPYs and QQQQs rallied into positive territory to end the session. The bad news is the charts do not inspire confidence. Notice how both got to just above the positive line and then petered out. These charts indicate there just wasn't enough enthusiasm to drive the markets higher.

Photo Sharing and Video Hosting at Photobucket

Photo Sharing and Video Hosting at Photobucket

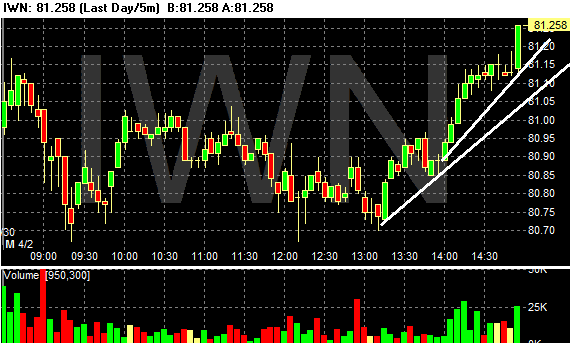
The IWNS rallied strongly in the last half hour. They also closed on a large spike in activity -- a very good sign going forward.

Photo Sharing and Video Hosting at Photobucket

New Century Files Bankruptcy

From Bloomberg


New Century Financial Corp., overwhelmed by rising defaults from borrowers with poor credit records, became the largest subprime mortgage lender ever to fail as it filed for bankruptcy today.

New Century plans to sell most of its assets within 45 days, said the Chapter 11 filing in federal court in Wilmington, Delaware. About 3,200 people, more than half the workforce at the Irvine, California-based company, will be fired. New Century said it already agreed to sell its mortgage billing and collections unit to Carrington Capital Management LLC for $139 million.

The company rode the U.S. housing boom to become the largest independent mortgage lender to subprime borrowers, only to collapse as interest rates rose and home prices fell. New Century's market value soared to more than $3.5 billion in December 2004, and last year it made about $60 billion in loans. Like rival firms, the company lowered its lending standards to keep business flowing after demand slumped.


This was the second largest subprime lender in the country. Not any more.

This won't be the last of this. Not by a long shot.

National ISM Drops Slightly

From the ISM:

"Manufacturing improved slightly in March as the PMI reflected growth for the second consecutive month. The New Orders and Production Indexes advanced while the Employment and Inventories Indexes declined. A positive for March is the Customers' Inventories Index (falling below 50 percent after five consecutive months above the breakeven line), which is a possible indication that manufacturers' inventories are nearing satisfactory levels. On the negative side, prices appear to be surging for certain commodities in the face of slower growth."


Here is an important section from the report, titled "What respondent's are saying:

* "Slowdown evident, could be based on inventory in the channel." (Computer & Electronic Products)
* "Industry preparing customers for price increases related to corn/grain cost increases." (Food, Beverage & Tobacco Products)
* "Raw material cost soared due to the largest one-month price increase for ferrous scrap since September of 2005." (Primary Metals)
* "General business conditions show significant signs of slowing in the manufacturing sector." (Transportation Equipment)
* "Business is slowing, but we are slightly ahead of last year's sales. We are projecting a flat year in sales for 2007." (Furniture & Related Products)


First of all, this report casts serious doubt on the large increase in the NAPM Chicago last week. This report indicates that number was probably off and will be revised downward.

Also notice the anecdotal evidence from the report. The general consensus is business is slowing. And the fact that agricultural prices are increasing at a time when gas is already higher that year-ago levels does not bode well for inflation and interest rate policy.

Here's how Bloomberg reported the news:

Manufacturing growth in the U.S. slowed in March and an index of costs rose to the highest since August as weakness in auto demand and a slump in housing restrained production, an industry report said.

The Institute for Supply Management's manufacturing index fell to 50.9 from 52.3 in February. Readings of more than 50 signal expansion.

Businesses are holding back on investment in capital equipment and are sitting on stockpiles of unsold goods, government reports last week indicated. That's keeping a lid on production growth at companies such as Siemens Energy & Automation, a Georgia-based supplier of equipment to builders and manufacturers


Rising inventories are also a growing concern. As businesses have more stuff on hand, they will decrease their purchases of more raw materials to make stuff. Increasing inventories were a prime reason for the upward revision for 4th quarter GDP, which signals slower growth ahead.

Reuters adds the following:

An index of U.S. manufacturing grew at a slower pace in March than in February, with the inflation component showing a jump and employment contracting, according to a survey published on Monday.


Now we add contracting employment to the mix of slower growth and higher prices.

Subprime Market "In the Process of Shutting Down"

From Yahoo Finance:

The subprime mortgage implosion will take even more steam out of the already slowing real estate market this year and beyond, according to a new economic report.

More than two dozen subprime lenders have shut down in recent months and others are scrambling to stay in business as a spike in defaults caused by borrowers unable to make payments has rocked the mortgage industry.

Now, as lenders tighten credit standards, the housing market will likely see further declines in price and output, senior economist David Shulman wrote in the quarterly Anderson Report to be released Monday by the University of California, Los Angeles.

"We suspect the problem in the subprime area is just the tip of the iceberg for the mortgage market as a whole," Shulman wrote. "For all practical purposes, the subprime market is in the process of shutting down."


This ties in nicely with an article from CBS Marketwatch from last week:

Trillions of dollars worth of adjustable-rate mortgages will reset in the next few years. That could dent consumer spending, but the wave of resets may end up being a ripple for the U.S. economy.

More than $2.28 trillion worth of ARMs were originated in 2004, 2005 and 2006, at the peak of the recent housing boom, according to a study released this week by a unit of real estate data company First American.

Some of these loans have already reset at higher interest rates, but a lot more have yet to reset.

This year, almost $370 billion worth of first ARMs are resetting. More than $250 billion worth will reset in 2008 and 2009 and another $700 billion will do so in 2010 and beyond, the First American study estimates.


Let's tie all of these strands of thought together.

Over the last 5 years, the subprime and Alt-A mortgage market have progressively increased in importance.
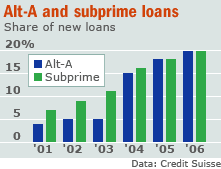
Photo Sharing and Video Hosting at Photobucket

Let's assume that tightening credit standards disproportionately hit the subprime and Alt-A markets. Let's also assume that tightening standards effectively remove 30% of all subprime and Alt-A borrowers. That means a little more than 10% of all borrowers in last years mortgage market go away, at least for the time being.

This is at a time when new and existing home inventory are at incredibly high historical levels.

Decreased demand = lower prices.

Increased inventory = lower prices.

So far, consumer sales haven't taken a major hit from the subprime shake-out. But there are two important caveats to that statement.

1.) This just started. The subprime market has only started to fall apart over the last 4 months or so. It's going to be awhile for that to move it's way through the economy.

2.) Notice the number of mortgage resets that will occur over the next 3+ years. That's more resets than we are currently experiencing.

That means this problem of people having escalating house payments will be with us for longer than we would like.
New Century May Seek Bankruptcy

From the WSJ:

New Century Financial Corp. is expected to make an announcement early Monday about the home-mortgage company's efforts to cope with a cutoff of credit from its lenders, people familiar with the situation said.

The company is widely expected to seek relief from creditors through a bankruptcy filing.

New Century ranked second last year among lenders to subprime borrowers, those with weak credit records or large debts in relation to their income. The Irvine, Calif.-based company has become an emblem of the recent turmoil in the subprime market caused by a loss of confidence among investors who buy loans from such lenders. A rash of defaults has scared away investors and forced New Century and many other lenders to repurchase soured loans they had sold to Wall Street packagers of securities backed by mortgages.

Notice has quickly this has happened. New Century's problems first surfaced within the last three months; now the 2nd largest subprime lender in the country will probably declare bankruptcy.

The speed with which this has happened should concern everybody.

Sunday, April 1, 2007

Increase In Corn Crops Hits Ag Prices

From Barron's (subscription required):

U.S. FARMERS INTEND TO CARPET the country with corn this spring, chasing the dollars being printed at the local ethanol plant. The U.S. Department of Agriculture on Friday estimated prospective plantings of corn at 90.45 million acres, the highest since 1944. This is roughly a 12-million-acre jump over last year's planted acreage, as the exponential growth in ethanol demand has pushed corn prices above 10-year highs. The jump in prices has been widely followed outside the agriculture markets; indeed, not since the movie Trading Places, in 1983, have people been so interested in farm data.

The grain industry was expecting a hike in corn acreage this spring, but this was about 2 million acres more than expected. Chicago Board of Trade corn prices swooned Friday, falling to their daily exchange-imposed price limit of 20 cents. The May contract ended the session at $3.7450 a bushel, a drop of 28.75 cents on the week.

The sharp fall in prices doesn't mean the bull market for corn is over, however. Prices could decline for several sessions, but they already are off their February highs -- by 16.6% for the May contract and 10.8% for the December contract (which represents the fall harvest).


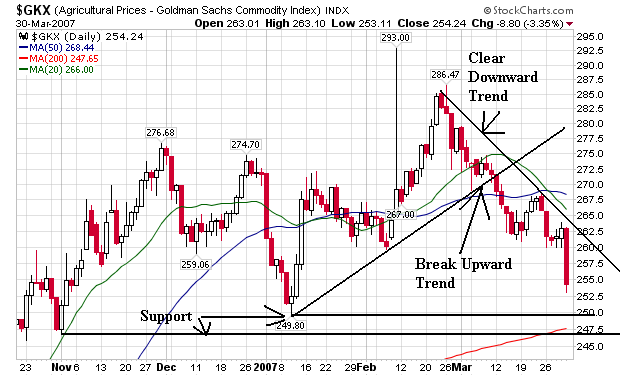
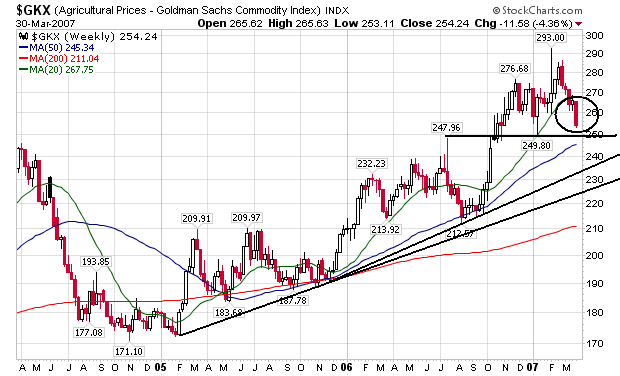
I've been following agricultural prices since the latest CPI and PPI release. In the last three reports, food prices increased at a faster rate. Here is a daily chart of the agricultural price index:

Photo Sharing and Video Hosting at Photobucket

While the chart broke the uptrend in early March, we still have support at two levels before prices break from their current trading range.

Here's a weekly chart of prices.

Photo Sharing and Video Hosting at Photobucket

Notice the uptrend is still firmly intact.