Here is a list of the top 5 stocks in the S&P 500 stock index in order of the largest percentage of the index to the smallest percentage of the index.
Exxon (XOM),
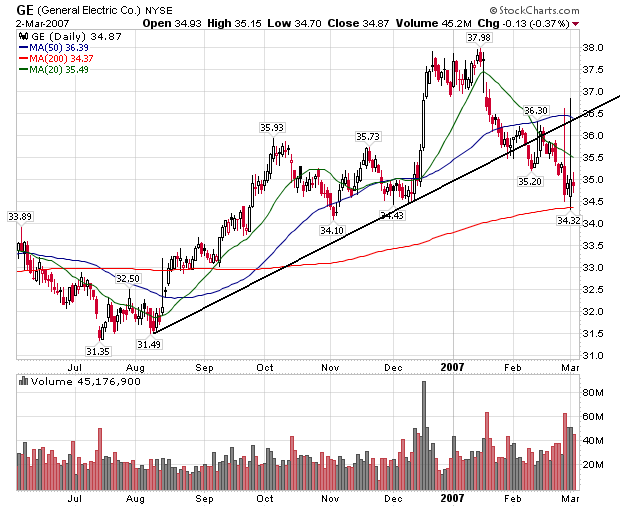
GE,
Citigroup (C),
Microsoft (MSFT)
Bank of America (BAC),
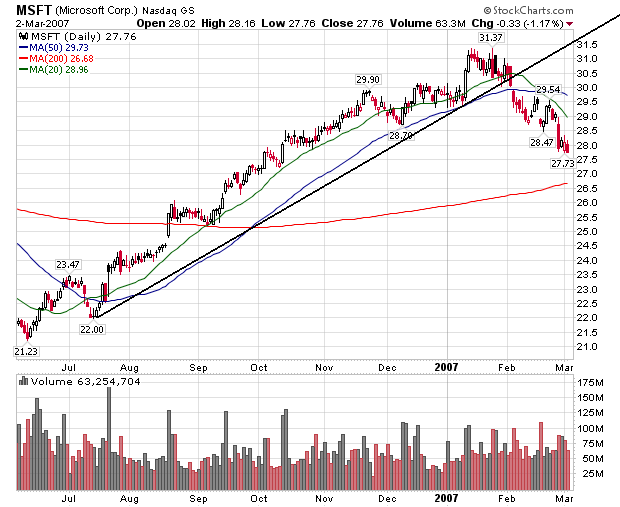
These stocks are a little over 10% of the index. That means their charts are pretty important to the index. Let's see what their charts look like.
Exxon
GE
Citigroup
Microsoft
Bank of America
With the exception of Citigroup, the top four market cap stocks have clearly broken their upward trend.
Saturday, March 3, 2007
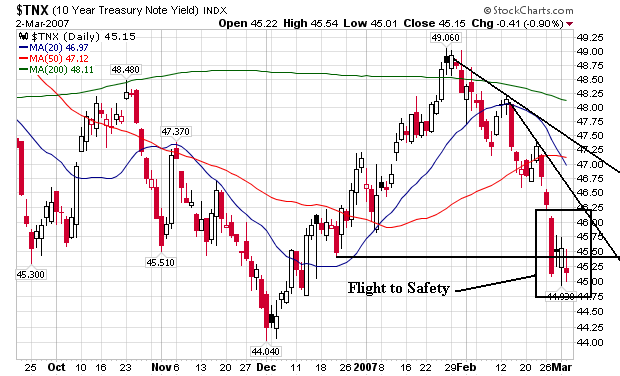
Treasury Market: Let the Flight to Quality Begin
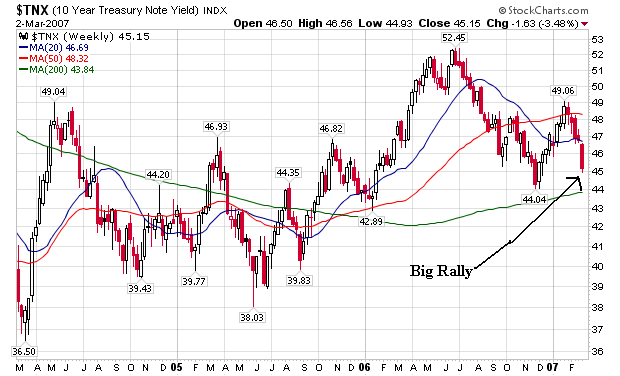
Last week the Treasury market rallied. Treasuries are usually the beneficiary of a market sell-off as Treasuries are considered safe investments.
The weekly chart is a bit more difficult to interpret. We've had a more meandering chart for the last several years as traders have tried to ascertain inflation and Fed intentions.
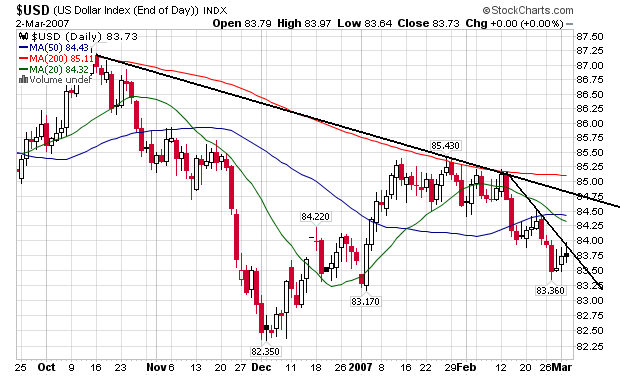
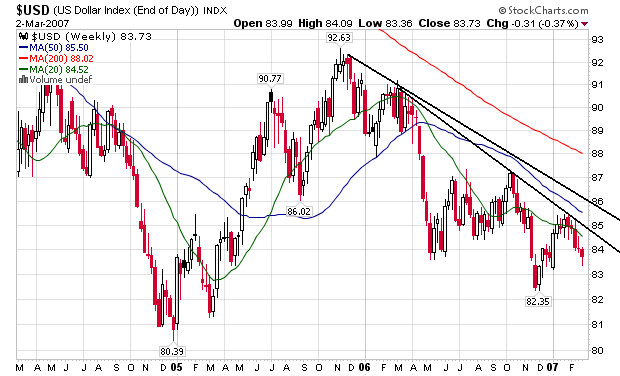
The Dollar
Here's a daily chart
We're still firmly in a short-term down trend. The 20 day SMA is now below the 50-day SMA, adding another bearish point to the chart. Next week we'll be looking to see if the dollar moves about the short-term trend line or rebounds lower.
Here's the weekly chart:
Two clear downward sloping trendlines and all three moving averages heading lower. This is a good example of a bear market chart.
The Bullish Argument Going Forward
This is the Barron's cover story this week (subscription required). The article makes some good points.
There are some very solid technical arguments here. First, the market isn't cheap but certainly not expensive by historical standards. While corporate profit growth is expected to slow, it is still pretty healthy. And traders are conditioned to buy on dips, meaning there could be some buying nibbles at attractive technical levels over the next few weeks.
The article does state overall slowing economic growth is the primary reason the markets may not advance. This is a strong counter-argument. As I wrote below, there was a ton of bad economic news last week that provided the fundamental reason for the continued market weakness throughout the week.
I still think housing is the main wild card going forward. There is still a ton of inventory to clear and last week's numbers indicate it will take lower priced to do it. Housing starts are slowing, which means we will probably have a large amount of construction lay-offs in the coming months. However, the business construction sector may absorb some of these displaced workers if non-residential construction levels continue at current levels.
I wouldn't be surprised to see the market far more sensitive to bad economic news over the next few weeks. Up until last week, the market was able to shrug off some bad news, basically arguing that problems were contained within specific market sectors -- especially housing problems. However, I think we'll start to see some of housing issues -- especially in the mortgage area -- start to spread-out to other market sectors like financials (mortgage related issues) and consumer durables (furniture/appliances).
Food for thought
Before Tuesday, every major stock market in the world -- and nearly all the smaller markets -- were near 52-week highs. Most markets also were near record levels, with the notable exceptions of the Nasdaq Composite and Standard & Poor's 500, a reflection of the absurd valuations they had reached in the tech boom of 2000.
.....
A bullish Wien thinks the S&P 500 could hit 1,600 by year end, a 15% gain. He says U.S. stocks look attractive with the S&P valued at 15 times projected 2007 operating earnings. The Dow Jones Industrial Average trades at 14.4 times estimated "07 profits. Both the Dow and the S&P 500 are in negative territory for the year, with the industrials off 2.8% and the S&P 500 down 2.2%. The so-called earnings yield on both the S&P 500 and the Dow is close to 7%, which compares favorably with the 4.5% yield on 10-year Treasuries. The earnings yield is the inverse of the market's price-earnings ratio.
Companies continue to lift dividends and repurchase record amounts of stock in order to reward shareholders -- and stay out of the sights of private-equity shops on the prowl for new leveraged buyouts.
.....
HISTORY SUGGESTS THAT STOCKS MAY DO WELL in the next two months. There have been 38 days since 1979 when the S&P 500 has suffered a single-session loss of 3% or more. The average gain in the ensuing 60 days has been 6.9%, with the index rising in 31 of the 38 cases, according to Citigroup research.
There are some very solid technical arguments here. First, the market isn't cheap but certainly not expensive by historical standards. While corporate profit growth is expected to slow, it is still pretty healthy. And traders are conditioned to buy on dips, meaning there could be some buying nibbles at attractive technical levels over the next few weeks.
The article does state overall slowing economic growth is the primary reason the markets may not advance. This is a strong counter-argument. As I wrote below, there was a ton of bad economic news last week that provided the fundamental reason for the continued market weakness throughout the week.
I still think housing is the main wild card going forward. There is still a ton of inventory to clear and last week's numbers indicate it will take lower priced to do it. Housing starts are slowing, which means we will probably have a large amount of construction lay-offs in the coming months. However, the business construction sector may absorb some of these displaced workers if non-residential construction levels continue at current levels.
I wouldn't be surprised to see the market far more sensitive to bad economic news over the next few weeks. Up until last week, the market was able to shrug off some bad news, basically arguing that problems were contained within specific market sectors -- especially housing problems. However, I think we'll start to see some of housing issues -- especially in the mortgage area -- start to spread-out to other market sectors like financials (mortgage related issues) and consumer durables (furniture/appliances).
Food for thought
Fundamental Reasons For Last Week's Sell-Off
Here are some of the fundamental reasons for last week's sell-off. As you will see, there were plenty of strong reasons for traders to start taking profits.
1.) The BEA lowered GDP estimates from 3.5% to 2.2%. First, this is a large revision. People will make entirely different economic assumptions about an economy growing at a 3.5% growth rate than an economy at a 2.2% growth rate. Secondly, this is the third quarter of sub-par growth, indicating we are definitely in the cooling off stages.
2.) New Home sales dropped 16%. There is a high margin of error with this number, so it can be revised upwards. However, the initial reading put the "the housing market has bottomed" people out to pasture.
3.) Durable goods orders dropped 7.1%. Even without transportation, this number dropped 3.1%.
4.) Weekly unemployment claims are ticking up. The 4-week moving average increased from 327,000 on February 10 to 335,000 in the latest report. However, bear in mind this is a noisy report and is subject to revisions etc...
5.)While personal income increased (a net positive) the core PCE inflation level increased .2%. This takes away fuel to the "Fed will lower interest rates soon" argument.
6.) Construction spending dropped .8% in January. This adds further fuel to the slowing housing market story.
7.) While existing home sales increase last month they did so because of a 5% December to January price decrease, a 3.1% year-over-year price decrease, a 3% increase in the month-to-month inventory and a 23% yeare-to-year inventory. In other words, the high inventory figures are starting to hit prices.
8.) Countrywide Financial announced 20% of the subprime loans they service are late with payments. This indicates there is probably more trouble ahead for an already troubled part of the economy.
To sum up, the overall economy is slowing, housing has not bottomed, and inflation will keep the fed from lowering rates.
This is the kind of news that leads to sell-offs.
Friday, March 2, 2007
The Worst Week Since January 2003
From Bloomberg:
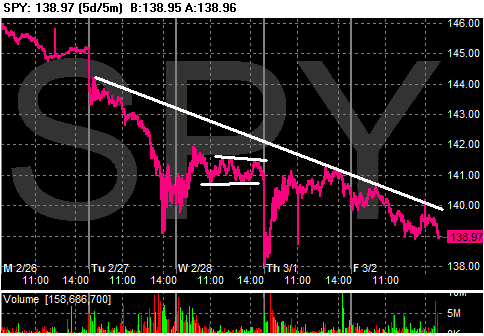
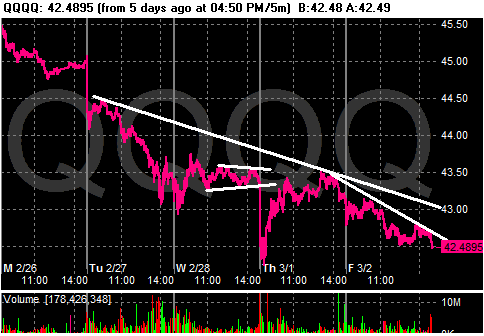
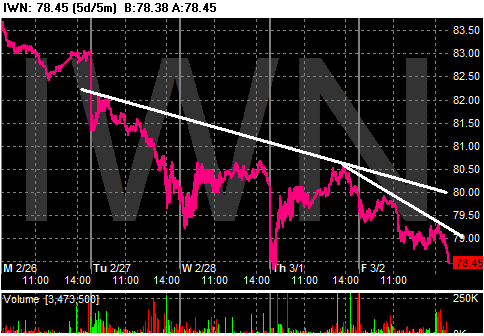
Let's go to the charts in the following order: SPY, QQQQ, IWN
These charts highlight four points.
1.) Tuesday was the big day of losses with a sudden drop at the open and continued weakness throughout the day.
2.) Friday we drifted downward and closed on a low-point.
3.) The overall trend for the week is down.
4.) You can literally draw a line from the upper left to the lower right of each chart and have the line represent the week's trend.
Let's go the the daily charts, courtesy of stockcharts.
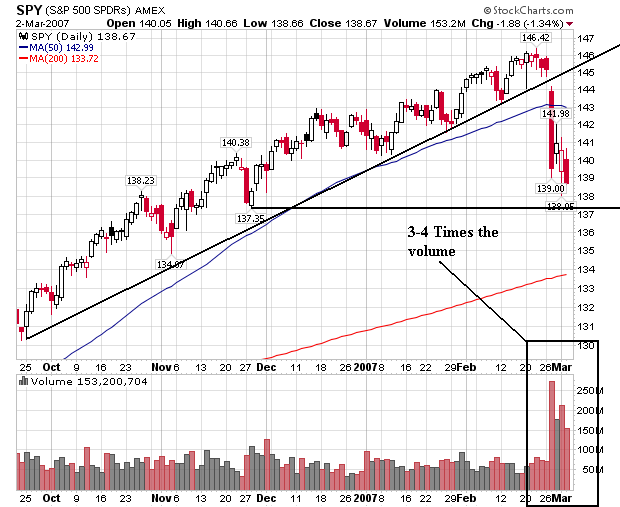
Here's the SPY:
1.) There is a big jump in volume above the preceding 3-4 months. This indicates sellers were looking to get out.
2.) The index closed below the 50-day SMA.
3.) The index clearly broke the 6-month uptrend and broke through previous support levels.
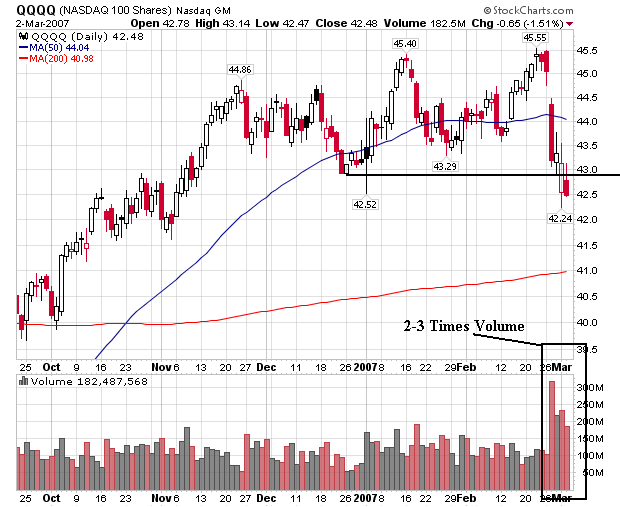
Here's a chart for the QQQQs
1.) There are 4 days of heavy selling on between 2-3 times the normal volume for the preceding 3-4 months.
2.) The index closed below the 50 day SMA.
3.) The QQQQs have traded in a range between (roughly) 42.50 and 45.50 for the last three months. We closed below that range on Friday.
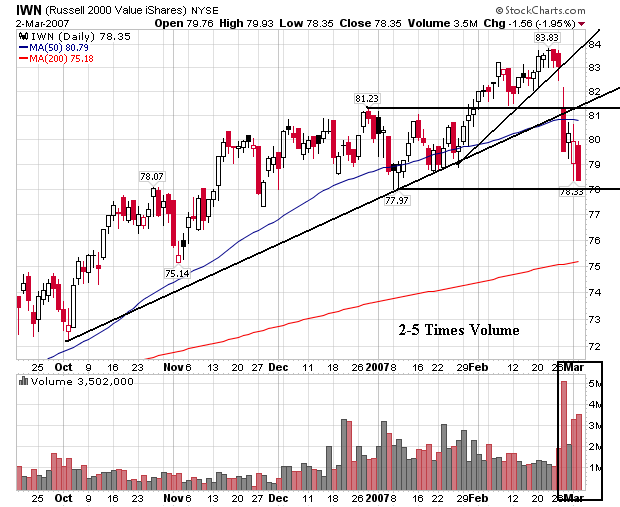
Here's a chart for the IWNs
1.) We had the heaviest selling of the indexes here -- up to 5 times the norm for the last 3-4 months.
2.) The index closed below the 50-day SMA.
3.) The index broke through two uptrends -- one that started at the beginning of October and one that started at the end of January.
All of these indexes had long red bars with large volume. This means sellers are in control and looking to book profits.
I'll be updating this information as the weekend progresses.
U.S. stocks dropped to a three-month low, completing their worst week since January 2003, after a decline in consumer confidence magnified the risk profit growth will be wiped out by a recession.
Let's go to the charts in the following order: SPY, QQQQ, IWN
These charts highlight four points.
1.) Tuesday was the big day of losses with a sudden drop at the open and continued weakness throughout the day.
2.) Friday we drifted downward and closed on a low-point.
3.) The overall trend for the week is down.
4.) You can literally draw a line from the upper left to the lower right of each chart and have the line represent the week's trend.
Let's go the the daily charts, courtesy of stockcharts.
Here's the SPY:
1.) There is a big jump in volume above the preceding 3-4 months. This indicates sellers were looking to get out.
2.) The index closed below the 50-day SMA.
3.) The index clearly broke the 6-month uptrend and broke through previous support levels.
Here's a chart for the QQQQs
1.) There are 4 days of heavy selling on between 2-3 times the normal volume for the preceding 3-4 months.
2.) The index closed below the 50 day SMA.
3.) The QQQQs have traded in a range between (roughly) 42.50 and 45.50 for the last three months. We closed below that range on Friday.
Here's a chart for the IWNs
1.) We had the heaviest selling of the indexes here -- up to 5 times the norm for the last 3-4 months.
2.) The index closed below the 50-day SMA.
3.) The index broke through two uptrends -- one that started at the beginning of October and one that started at the end of January.
All of these indexes had long red bars with large volume. This means sellers are in control and looking to book profits.
I'll be updating this information as the weekend progresses.
Markets Close on Low Note
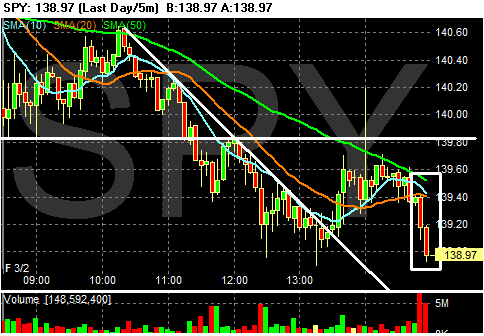
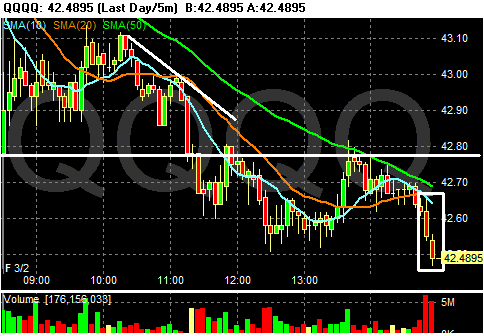
Traders don't want to hold anything over the weekend in this market. Take a look at the last two bars of both the SPYs and QQQQs -- there's a ton of volume and a strong downtrend. In addition, the markets closed near their lowest point of the day. This indicates there is some pretty strong bearishness in the market right now.
SPY:
QQQQ:
SPY:
QQQQ:
Sub-Prime Update
From the AP
Three quarters of restatements -- that is not a good sign.
Then there's GM:
Just what Detroit needs right now -- financial headaches. The phrase "substantial hit" indicates analysts are pretty concerned about the situation.
Subprime mortgage lender New Century Financial Corp. said Friday it won't be able to file its 2006 annual report on time, and plans to request an extension from the Securities and Exchange Commission.
In early February, New Century announced it would restate financial results for the quarters ending March 31, June 30 and Sept. 30, 2006, to correct accounting errors for losses to too to buy back bad loans.
Three quarters of restatements -- that is not a good sign.
Then there's GM:
The cratering of the subprime mortgage industry could present more than just a pothole for General Motors Corp.
The world's largest auto maker disclosed Thursday that it will need more time to file its 2006 annual report with the Securities and Exchange Commission, marking the second year in a row the company has postponed the key filing.
Many analysts attribute this year's delay to a substantial hit the Detroit-based automaker might take from the exposure its part-owned finance unit -- GMAC Financial Services -- has to the business of making mortgage loans to people with weak credit or heavy debt burdens.
Just what Detroit needs right now -- financial headaches. The phrase "substantial hit" indicates analysts are pretty concerned about the situation.
Big Trading Day Today
Keep your eye on how the market trades today and especially keep an eye on the close. Traders are more inclined to keep positions over the weekend if they don't think there will be bad news that will lead to a big drop on Monday. We've had a big spike in volatility this week, so traders' will vote their confidence/lack-of-confidence of possible weekend news with their over-the-weekend positions.
Also, watch to see if we have any solid trends develop or whether the market meanders with no direction for most/part of the day. These intra-day trends will help to determine if there is any prevailing mood among traders about the market.
Auto Sales Figures
From Seeking Alpha:
This news combined with Ford's press release that restructuring would cost $11 billion makes that company very suspect. GMs increase is good news, but I still have a problem with a bullish perspective for that company.
It looks as though the US consumer is clearly moving toward Japanese cars in a big way. I am guessing some of this has to do with fuel efficiency. However, the Japanese car makers also have lines of trucks and SUVs, so there are probably other factors in these numbers.
Right now car makers are competing for the same size economic market -- at least on a seasonally adjusted basis. With US GDP growth slowing, I have to wonder how long that will last.
There's been a slow war of attrition going on between Japan and Detroit for the better part of 25 years. Japan obviously has a better long-term strategy at this point -- largely because they have a long-term strategy.
Yesterday marked the release of February light vehicle sales figures and the results again showed a loss of market share among the 'Big 3' U.S. automakers, particularly to Japanese carmakers. Ford and DaimlerChrysler reported declines in sales, 13% and 7.7% respectively, versus a year ago's sales. Reversing its own downward trend, GM said its sales rose 3.4% from the year earlier period.
This news combined with Ford's press release that restructuring would cost $11 billion makes that company very suspect. GMs increase is good news, but I still have a problem with a bullish perspective for that company.
All three of Japan's 'Big 3' reported YoY sales increases, paced by Toyota at 12%, while Honda (3.2%) and Nissan (1.2%) also registered gains.
It looks as though the US consumer is clearly moving toward Japanese cars in a big way. I am guessing some of this has to do with fuel efficiency. However, the Japanese car makers also have lines of trucks and SUVs, so there are probably other factors in these numbers.
Despite an industry-wide YoY sales drop of 0.5%, the seasonally adjusted annual sales rate held steady at 16.6 million; Bloomberg consensus estimates were for an annual rate of 16.1 million sales.
Right now car makers are competing for the same size economic market -- at least on a seasonally adjusted basis. With US GDP growth slowing, I have to wonder how long that will last.
The total market share of the U.S. 'Big 3' fell to 54% from 56.6% in February 2006. GM managed to increase its market share 1% to 24.6% total. Asian automakers up their share from 37% to 39.4%.
There's been a slow war of attrition going on between Japan and Detroit for the better part of 25 years. Japan obviously has a better long-term strategy at this point -- largely because they have a long-term strategy.
On the Market Correction....
OK -- let's look at this from the bullish and bearish perspective.
Bull: Corrections are healthy and represent buying opportunities. That's all this week's drop-off was. The economy is slowing into a perfect Goldilocks soft-landing. While GDP growth has slowed, it is nowhere near recessionary levels. Incomes are rising. Manufacturing is showing signs of improvement. Unemployment is low. Housing damage has been contained to the housing sector. Consumer spending is showing signs of continued strength.
Bear: This is just the beginning. GDP was revised down. New home sales plunged. The inventory of new and existing homes increased on a months available basis. This will eventually hit consumer spending. The sub-prime market problems are just beginning. We still have historically high debt levels at the federal and household level and debt payments/disposable incomes are at records. The rally is long in the tooth.
I think housing continues to be the main wild card in both scenarios. Housing damage is still largely contained to the housing sector. I have no idea if that will continue, but the record so far says it can be.
Thursday, March 1, 2007
Markets Rally and Hold On -- Barely
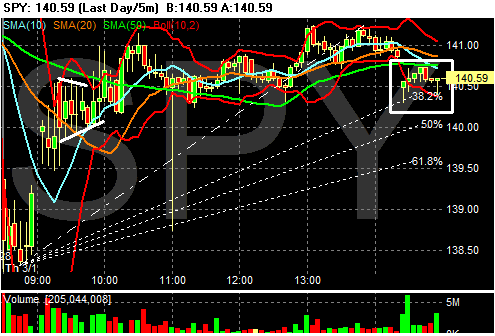
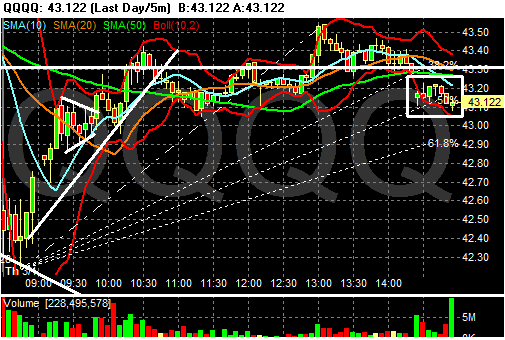
Wow -- what a day. The markets started out way off, then rallied on the ISM news. They traded in a range until the last half-hour when they gapped down. It was looking as though the markets wanted to head lower, but didn't.
The QQQQs closed down .44% and the SPYs closed down .22%. It could have been a whole lot worse.
Notice and the SPYs and the QQQQs both had a small island form in the last half hour.
The QQQQs closed down .44% and the SPYs closed down .22%. It could have been a whole lot worse.
Notice and the SPYs and the QQQQs both had a small island form in the last half hour.
Income and PCE Up
From the BEA
These are good numbers and probably partially explain the increase in spending we are seeing.
However, core PCE -- a measure of inflation -- increased .3% and core PCE incresed 2.3% year-over-year. These numbers add further fuel to the argument the Fed won't be lowering rates anytime soon.
Personal income increased $108.1 billion, or 1.0 percent, and disposable personal income (DPI)increased $73.0 billion, or 0.8 percent, in January, according to the Bureau of Economic Analysis.
Personal consumption expenditures (PCE) increased $51.9 billion, or 0.5 percent. In December,personal income increased $55.7 billion, or 0.5 percent, DPI increased $46.0 billion, or 0.5 percent, and PCE increased $69.4 billion, or 0.7 percent, based on revised estimates.
These are good numbers and probably partially explain the increase in spending we are seeing.
However, core PCE -- a measure of inflation -- increased .3% and core PCE incresed 2.3% year-over-year. These numbers add further fuel to the argument the Fed won't be lowering rates anytime soon.
ISM Increases
From the Institute for Supply Management:
Looking at the numbers, new orders were up 4.6% and production was up 4.5%. These are good numbers and they have helped the market rally from a big drop at the opening.
However --
The number of executives who reported paying higher prices increased from 24% to 32%. This is a number that bears watching.
Economic activity in the manufacturing sector expanded in February following a decline in January, while the overall economy grew for the 64th consecutive month, say the nation's supply executives in the latest Manufacturing ISM Report On Business®.
The report was issued today by Norbert J. Ore, C.P.M., chair of the Institute for Supply Management™ Manufacturing Business Survey Committee. "February proved to be a good month in the manufacturing sector as New Orders, Production and Employment contributed to a solid growth scenario. The Inventories Index showed significant reduction in manufacturers' inventories for the second consecutive month, and the Backlog of Orders Index is growing once again. While the prices manufacturers pay reached their highest level in five months, concern about prices is still minimal due to the small number of commodities indicated as up in price. The trend in manufacturing, as well as the overall economy, is for slow but continuing growth."
Looking at the numbers, new orders were up 4.6% and production was up 4.5%. These are good numbers and they have helped the market rally from a big drop at the opening.
However --
In February, the ISM Prices Index registered 59 percent, indicating manufacturers are paying higher prices on average when compared to January. While 32 percent of respondents reported paying higher prices and 14 percent reported paying lower prices, 54 percent of supply executives reported paying the same prices as the preceding month. A Prices Index above 47.2 percent, over time, is generally consistent with an increase in the Bureau of Labor Statistics (BLS) Index of Manufacturers Price
The number of executives who reported paying higher prices increased from 24% to 32%. This is a number that bears watching.
Construction Spending Drops .8%
From Bloomberg:
Here's a link to the Census report
Residential construction dropped 1.7%. Considering the housing numbers we are seeing right now, this is to be expected. However, nonresidential construction increased .2%. Residential and nonresidential are each roughly 50% of the construction numbers. Lodging increased 3.2% and office construction increased 3.1%. Transportation and communication were also up.
Right now, business construction is helping to lessen the negative impact of the residential decline. The real question is will this trend continue.
Construction spending in the U.S. fell by the most in three months in January, pulled lower by the biggest decline in homebuilding since July.
Spending on residential and non-residential projects dropped 0.8 percent after a revised 0.6 percent increase in December, the Commerce Department said today in Washington. The government previously estimated a drop in December spending.
Homebuilders are reluctant to start work on new projects as buyers cancel contracts and inventories of unsold homes swell. A report yesterday showing new-home sales fell by the most in 13 years suggests that construction will continue to falter, weighing on economic growth.
``Residential construction spending has been steadily declining since spring 2006, and we expect this trend to continue,'' Drew Matus, a senior economist at Lehman Brothers Holdings Inc. in New York, said before the report.
Here's a link to the Census report
Residential construction dropped 1.7%. Considering the housing numbers we are seeing right now, this is to be expected. However, nonresidential construction increased .2%. Residential and nonresidential are each roughly 50% of the construction numbers. Lodging increased 3.2% and office construction increased 3.1%. Transportation and communication were also up.
Right now, business construction is helping to lessen the negative impact of the residential decline. The real question is will this trend continue.
Ford Restructuring -- $11 Billion
From AOL Money News
I've been watching the stock of GM and Ford rise for the last few months and scratching my head. Traders are obviously playing the turnaround story, hoping today's efforts to improve their respective positions will pan out. But I haven't seen any encouraging results yet. Ford is in hoc up to its eyebrows -- it has pledged all of its assets against its credit line. Both Ford and GM have a ton of costs coming up and declining market share. I just don't see the turnaround happening yet.
Of course, I've been wrong before so take this with a grain of salt.
Ford Motor Co. said Wednesday that its restructuring plan would likely cost $11.18 billion, with more than half of the expenses devoted to programs for laid-off workers.
In a filing with the Securities and Exchange Commission, the No. 2 U.S. automaker estimated spending $5.96 billion on a jobs bank and other "personnel-reduction programs," $2.74 billion to scale back its pensions, $2.2 billion for fixed asset impairment charges and $281 million to idle plants.
Ford said in the filing that it had already accrued $9.9 billion in 2006 and the balance, mostly related to salaried personnel-reduction programs, would be accrued during the first three months of 2007.
The company also disclosed that it has pledged all its buildings, trademarks, intellectual property, shares in the main company, and shares in Volvo, Jaguar, Aston Martin, Ford Motor Credit Co. and other operations as collateral for a $23.4 billion line of credit to fund its restructuring plan and cover losses expected until 2009.
I've been watching the stock of GM and Ford rise for the last few months and scratching my head. Traders are obviously playing the turnaround story, hoping today's efforts to improve their respective positions will pan out. But I haven't seen any encouraging results yet. Ford is in hoc up to its eyebrows -- it has pledged all of its assets against its credit line. Both Ford and GM have a ton of costs coming up and declining market share. I just don't see the turnaround happening yet.
Of course, I've been wrong before so take this with a grain of salt.
Tightening Credit Spreads. Is This a Good Thing?
This is from today's WSJ:
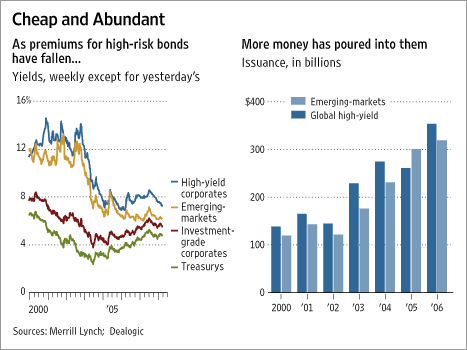
Credit risk is usually measured against a baseline interest rate. For example, the US Treasury market is considered the safest fixed-income investment. Therefore, the yield of other fixed income investments is compared to US Treasuries. The difference between the yields is called the spread, and it is measure of the amount of risk in the markets.
Notice how high-yield US corporates (junk bonds) were trading about 500 basis points above US Treasuries at the end of the last expansion in 2000. Now that spread is far less. This indicates investors are far more willing to buy higher-yielding junk debt. Now, it's important to remember default rates on high-yield debt are at very low levels right now, so investors may be making a prudent decision. However, this tightening of spreads indicates people are far more comfortable with higher-risk assets.
This in turn makes borrowing far cheaper for higher-risk entities. Compare the 2000 interest rates of roughly 12% with the roughly 8% currently. That's 4% or 400 basis points cheaper. Companies with poorer credit can get very cheap financing right now. If investors start to shy away from risk, the cost of credit will increase, making borrowing more expensive, which in turn slows business expansion.
The exact same arguments could be made for developing countries debt which are also on the graph.
Auto Sales Could Slow
From the WSJ:
The US auto industry has many problems. First, they are tied to selling large autos in a rising gas environment. At some point consumers will become more interested in MPG than horsepower and size. That shift may already be taking place.
Secondly, they are all looking at serious cost issues that they most negotiate around. Health costs especially are a big issue.
Finally, there is the US consumer's position. Consumer spending as increased continually since 1996. At the same time, household debt outstanding has increased as have household debt payments. At some point the consumer will reign in his spending and start to focus more on paying down debt.
an automotive outlook report this week, IRN Inc., a Michigan market-research firm, predicted an economic slowdown in 2007 and says "sufficient evidence" supports a recession sometime this year. "Look for other analysts and the Big Three auto makers to make some significant reductions by the second quarter regarding their outlooks for 2007," it said.
"The automotive outlook is too high" on Wall Street, said Erich Merkle, IRN's forecasting director, in an interview. Citing a drop in housing starts and rising durable-goods inventories, he added, "I think that there are a lot of folks out there that have yet to account for the possibility of a significant slowdown in economic performance as 2007 unfolds."
IRN reduced its 2007 sales forecast in December to 16.1 million cars and trucks from 16.3 million. That number could go lower, Mr. Merkle said. Last year's sales totaled 16.6 million, according to Autodata Corp. Analysts and economists who forecast car sales are considering economic indicators, but most have stuck with their predictions.
The US auto industry has many problems. First, they are tied to selling large autos in a rising gas environment. At some point consumers will become more interested in MPG than horsepower and size. That shift may already be taking place.
Secondly, they are all looking at serious cost issues that they most negotiate around. Health costs especially are a big issue.
Finally, there is the US consumer's position. Consumer spending as increased continually since 1996. At the same time, household debt outstanding has increased as have household debt payments. At some point the consumer will reign in his spending and start to focus more on paying down debt.
Mortgage Defaults Increasing Among Better Credit Risk
From the WSJ:
Let's look at those totals. Notice the four-fold increase in the totla dollar amount of alt-A loans in 4 years. Simply put, that's a ton of new debt in the system. Although these people had better credit, the large increase makes me wonder whether credit standards were relaxed a bit too much to make all those loans.
In addition, notice that subprime and alt-A loans comprise 40% of the mortgage loans. That means trouble with both of these tiers of loans could lead to problems outside of the housing market.
OK -- we're far away from serious danger levels in the Alt-A market. however, the recent vintage of subprime loans went bad very quickly. So this situation should be closely monitored.
Easy credit has defined this expansion. Now the bill may be coming due -- and it may not be pretty.
At issue are mortgages made to people who fall in the gray area between "prime" (borrowers considered the best credit risks) and "subprime" (borrowers considered the greatest credit risks). A record $400 billion of these midlevel loans -- which are known in the industry as "Alt-A" mortgages -- were originated last year, up from $85 billion in 2003, according to Inside Mortgage Finance, a trade publication. Alt-A loans accounted for roughly 16% of mortgage originations last year and subprime loans an additional 24%.
The catch-all Alt-A category includes many of the innovative products that helped fuel the housing boom, such as mortgages that carry little, if any, documentation of income or assets, and so-called option adjustable-rate mortgages, which give borrowers multiple payment choices but can lead to a rising loan balance. Loans taken by investors buying homes they don't plan to occupy themselves can also fall into the Alt-A category.
Let's look at those totals. Notice the four-fold increase in the totla dollar amount of alt-A loans in 4 years. Simply put, that's a ton of new debt in the system. Although these people had better credit, the large increase makes me wonder whether credit standards were relaxed a bit too much to make all those loans.
In addition, notice that subprime and alt-A loans comprise 40% of the mortgage loans. That means trouble with both of these tiers of loans could lead to problems outside of the housing market.
Data from UBS AG show that the default rate for Alt-A mortgages has doubled in the past 14 months. "The credit deterioration has been almost parallel to what's been happening in the subprime market," says UBS mortgage analyst David Liu. The UBS report contrasts with testimony Federal Reserve Board Chairman Ben Bernanke gave to Congress yesterday. "Our assessment is that there's not much indication that subprime issues have spread into the broader mortgage market," Mr. Bernanke said.
To be sure, defaults have remained very low in the prime market -- and despite the uptick in bad loans, the problems in the Alt-A sector aren't as severe as those that have roiled the subprime market. Some 2.4% of Alt-A loans are at least 60 days past due, according to UBS, which looked at mortgages that were packaged into securities and sold to investors. That is well below the 10.5% delinquency rate for subprime mortgages. (During the housing boom, delinquencies were low for all types of loans because borrowers who wound up in trouble could refinance or sell.)
OK -- we're far away from serious danger levels in the Alt-A market. however, the recent vintage of subprime loans went bad very quickly. So this situation should be closely monitored.
Thomas Gorman, a bankruptcy attorney in Alexandria, Va., says he is seeing more financially strapped borrowers who "probably bought more house than they could afford and then took on more credit-card debt" to furnish the house and pay for the move. When the housing market cooled, they were "caught in the middle," unable to sell their home or refinance and make their debt load more manageable.
Easy credit has defined this expansion. Now the bill may be coming due -- and it may not be pretty.
Wednesday, February 28, 2007
Dollar Update
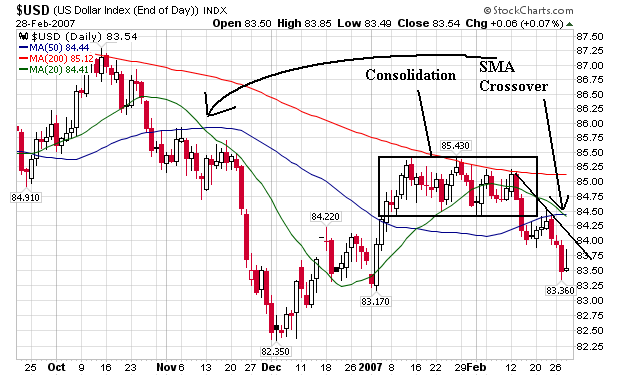
Here's a chart from Stockcharts for the US Dollar Index:
The dollar consolidated from the beginning of January to mid-February. Then it started losing value in a clearly defined downtrend.
Notice the 20 day SMA is crossing over the 50-day SMA. The last time this happened in early November the dollar dropped 3,5%
The dollar consolidated from the beginning of January to mid-February. Then it started losing value in a clearly defined downtrend.
Notice the 20 day SMA is crossing over the 50-day SMA. The last time this happened in early November the dollar dropped 3,5%
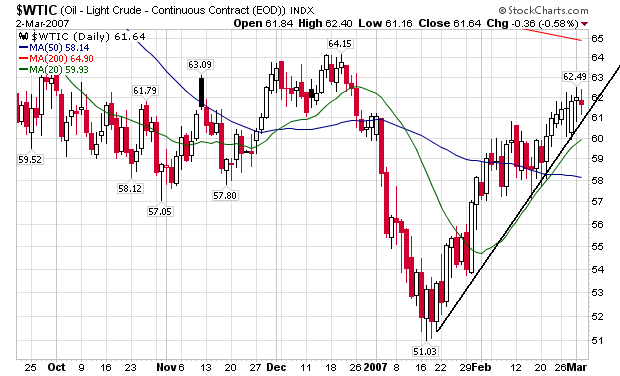
Oil Market Update
Oil is one of the primary commodities that is driving -- or not driving -- inflation. Therefore, it's important to keep on top of where oil is and where it might be heading.
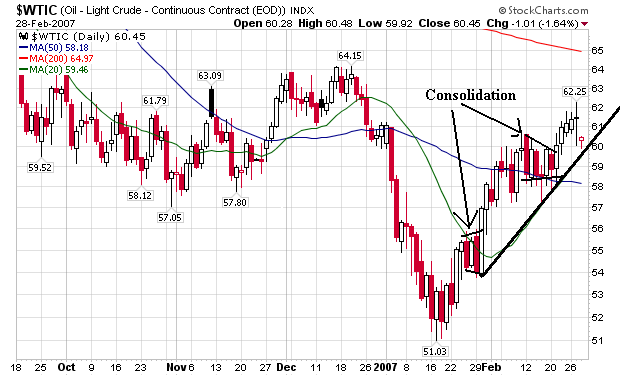
Here's a chart from Stockcharts:
Since the price low in mid-January, oil has been steadily moving up. It consolidated gains twice -- once in late January and once in mid-February. While it's still in an uptrend, today's drop to near the trend line (which is masking the 20-day simple moving average) indicates possible weakness. This means the next few trading days are pretty important to this particular uptrend -- at least from a technical view.
Remember oil's fundamental underpinnings have tons of risk and volatility. Any change their will greatly impact the chart.
Market Recap
The markets closed up today. The SPYs were up 1.04%, the QQQQs were up .3% and the IWNs were up .94%. Starting at about 11AM, all three markets traded in a sideways pattern, indicating supply and demand were in equilibrium. This looks like mostly a technical bounce, nothing more. This makes more sense especially considering
1.) New home starts dropped 16%,
2.) The PMI was recessionary for a second month in a row and
3.) GDP was revised down to 2.2%.
The bottom line is the economy appears to be slowing and the housing market hasn't hit bottom in any meaningful way. We still have to wade through some basic problems.
1.) New home starts dropped 16%,
2.) The PMI was recessionary for a second month in a row and
3.) GDP was revised down to 2.2%.
The bottom line is the economy appears to be slowing and the housing market hasn't hit bottom in any meaningful way. We still have to wade through some basic problems.
Market Update
The markets have rebounded from yesterday's loss. As of this writing, the QQQQs are up .8%, the IWNs are up 1.1% and the SPYs are up 1.3%. All of the markets are establishing some strong intra-day support levels.
We may be seeing two technical patterns right now.
1.) An inside day -- think of this like a triangle pattern.
2.) A dead-cat bounce. Prices drop hard, then rebound slightly. It's akin to dropping a, well, dead cat from a high height (sorry for the visual).
As with all technical analysis -- it's about probabilities not certainties.
New Home Sales Plunge
From Bloomberg:
OK -- the housing market has not bottomed in any significant way.
Here are some other thoughts.
1.) Mortgage rates are low right now. In addition, the 10-year Treasury has rallied, further lowering rates. Interest rates aren't the issue.
2.) Are sub-prime mortgage problems and increasing credit standards starting to filter through the market? We saw the first wave of sub-prime mortgage problems later last year, and a second wave recently. If these two events are related (but remember we have a correlated not causation related events) we could have further drops in the next few months.
3.) Are household debt levels starting to hamper further debt acquisition? Household debt is now over 90% of GDP and 120% of overall national disposable income. Debt payments as a percentage of disposable income are are record highs. Are these factors starting to restrain the housing market?
New-home sales in the U.S. fell last month by the most in 13 years, pointing to more weakness in the real-estate market that limited economic growth last year.
The 16.6 percent decrease to an annual rate of 937,000 in January, less than any economist had forecast in a Bloomberg News survey, Commerce Department figures showed today. The pace of sales was the slowest since February 2003. A measure of housing inventory rose to the highest in three months.
The figures show home construction will remain a drag on the economy even with lower borrowing costs and more incentives from builders. More cuts in home prices may be needed to stir buyer interest as builders keep reporting increased rates of canceled orders.
OK -- the housing market has not bottomed in any significant way.
Here are some other thoughts.
1.) Mortgage rates are low right now. In addition, the 10-year Treasury has rallied, further lowering rates. Interest rates aren't the issue.
2.) Are sub-prime mortgage problems and increasing credit standards starting to filter through the market? We saw the first wave of sub-prime mortgage problems later last year, and a second wave recently. If these two events are related (but remember we have a correlated not causation related events) we could have further drops in the next few months.
3.) Are household debt levels starting to hamper further debt acquisition? Household debt is now over 90% of GDP and 120% of overall national disposable income. Debt payments as a percentage of disposable income are are record highs. Are these factors starting to restrain the housing market?
Chicago PMI Drops Slightly
Here is a link to the full report.
The overall index dropped from 48.8 to 47.9.
Production decreased slightly, but new orders increased slightly.
Inventories increased in a big way from 38.5 to 56.5 -- the largest gain in 30 years.
Here's a big phrase from the report: overall demand down 28% - 30% and sales incentives are high. When you have to pay people to buy your products you have problems.
While this report isn't completely recessionary, it is leaning in that direction. In addition, we have two downward trends in the overall business barometer number. The first started at the beginning of 2005, and the second started in mid-2006. Things still appear to be moving down, although I wouldn't call this a recessionary stage yet. But we're pretty close.
GDP Increases 2.2%
From the BEA:
Let's look a little deeper into the numbers:
Personal Consumption Expenditures increased 4.4% -- a strong number. However, domestic investment decreased 11%. Residential investment decreased 19% -- by far the biggest reason for the overall drop. Nonresidential investment decreased .4%. While nonresidential fixed investment (buildings etc...) increased 2.8%, equipment and software investment decreased 1.8%.
Personal consumption expenditures added 3.05% to the 2.2% number. Purchases for non-durable goods added 1.38% to the 2.2% number with food purchases responsible for .69. Services added 1.2% to the 2.2% growth. Durable goods purchases added .47. This is the third quarter in a row when durable goods purchases have been weak.
Gross private domestic investment subtracted 1.92% from growth. That means if housing had been neutral (0% growth), overall growth would have been 4.1% - 4.2%. That should give you some idea of how important the housing slump is to the current economy.
Short version -- this number is weak but not cataclysmic. In addition, a downward revision has been expected.
Real gross domestic product -- the output of goods and services produced by labor and property located in the United States -- increased at an annual rate of 2.2 percent in the fourth quarter of 2006, according to preliminary estimates released by the Bureau of Economic Analysis. In the third quarter, real GDP increased 2.0 percent.
The GDP estimates released today are based on more complete source data than were available for the advance estimates issued last month. In the advance estimates, the increase in real GDP was 3.5 percent (see "Revisions" on page 3).
The increase in real GDP in the fourth quarter primarily reflected positive contributions from personal consumption expenditures (PCE), exports, state and local government spending, and federal government spending that were partly offset by negative contributions from private inventory investment and residential fixed investment. Imports, which are a subtraction in the calculation of GDP, decreased.
Let's look a little deeper into the numbers:
Personal Consumption Expenditures increased 4.4% -- a strong number. However, domestic investment decreased 11%. Residential investment decreased 19% -- by far the biggest reason for the overall drop. Nonresidential investment decreased .4%. While nonresidential fixed investment (buildings etc...) increased 2.8%, equipment and software investment decreased 1.8%.
Personal consumption expenditures added 3.05% to the 2.2% number. Purchases for non-durable goods added 1.38% to the 2.2% number with food purchases responsible for .69. Services added 1.2% to the 2.2% growth. Durable goods purchases added .47. This is the third quarter in a row when durable goods purchases have been weak.
Gross private domestic investment subtracted 1.92% from growth. That means if housing had been neutral (0% growth), overall growth would have been 4.1% - 4.2%. That should give you some idea of how important the housing slump is to the current economy.
Short version -- this number is weak but not cataclysmic. In addition, a downward revision has been expected.
Asian Market Recap
From the WSJ:
Australia * -2.70%
Hong Kong * -2.46%
India * -4.01%
Indonesia * -1.31%
Japan * -2.85%
Malaysia * -3.91%
Pakistan * -1.74%
Philippines * -7.92%
Singapore * -3.72%
S.Korea * -2.56%
Sri Lanka * -0.45%
Taiwan * 0.02%
Thailand * -1.0
nvestors in Shanghai-listed stocks Wednesday bucked the very trend they'd begun a day earlier, bidding shares well into positive territory, even as other Asian benchmark indexes plunged for a second straight session.
Shanghai's Composite Index gained 3.94% to close at 2881.07, reversing a negative performance in the early part of the morning session. The Shanghai index, which tracks shares listed on the bigger of China's two stock markets, fell 8.8% Tuesday, triggering a global selloff that led to the biggest one-day losses in the U.S. since the wake of the Sept. 11, 2001, terrorist attacks.
The decline in Shanghai Tuesday followed concerns that the government may introduce additional macro-economic tightening measures to cool speculative activity. On Monday, the Shanghai benchmark ended at an all-time high.
In Tokyo, stocks plunged in the wake of the overnight dive on Wall Street, where the Dow Jones industrials fell more than 400 points. (See related article.)
The Nikkei 225 stock index fell 515.80 points, or 2.85%, to finish at 17604.12 on the Tokyo Stock Exchange. Around Asia, Hong Kong's Hang Seng Index ended down 2.46% at 19651.51. Australia's S&P/ASX 200 closed 2.69% lower at 5832.50. Shares of BHP Billiton fell 5.1%.
South Korea's Kospi Index ended down 2.56% to 1417.34. Singapore's Straits Times Index finished down 3.72% to 3111.94 and New Zealand's NZSX-50 ended 1.5% lower to 4037.12. Markets in Taiwan were closed for a public holiday.
Australia * -2.70%
Hong Kong * -2.46%
India * -4.01%
Indonesia * -1.31%
Japan * -2.85%
Malaysia * -3.91%
Pakistan * -1.74%
Philippines * -7.92%
Singapore * -3.72%
S.Korea * -2.56%
Sri Lanka * -0.45%
Taiwan * 0.02%
Thailand * -1.0
Tuesday, February 27, 2007
Nikkei Opens 700 Points Lower
From the WSJ:
Not good.
Japan's Nikkei 225 index tumbled more than 700 points at Wednesday's open in Tokyo, falling below 18000 for the first time in nearly a week, as investors sold stocks across the board in the wake of steep losses on Wall Street.
Not good.
What Will Happen Tomorrow
Let's look ahead.
1.) Today has a huge down day on record volume. None of the daily charts found a meaningful technical bottom.
2.) The markets have rallied for the better part of 6 months without a major correction.
So before we get to tomorrow's economic news we already have a strong bearish bias.
Tomorrow we have GDP, new home sales and the Chicago PMI.
There's been a lot of talk about a large downward revision to this number -- a revision in the range of about 1% in GDP growth. If this happens the US economy will have three straight quarters of sub-par growth.
The PMI has been hovering around 50 for the last few months. While there was a big upward move in the NY Fed index this month, the Philly index was mediocre.
New homes sales are also important, especially with the problems in the sub-prime mortgage market right now.
Each of these numbers is important, although I think the GDP revision -- if it's large -- will be the big number of the day.
What the Hell Happened Today
OK. The markets are closed. Let's take a breath and look at what happened.
A big drop in China started it off:
Here's more from Bloomberg:
I can't speak to the practices these proposed regulations are supposed to curb. However, I would assume they are a problem for the Chinese market.
Other developing countries sold-off in sympathy with China. The ETF for Malaysia was down 9%, Brazil was down 8.59%, Mexico was down 8%, and Singapore was down 7.8%.
So at the open, there was a rolling worldwide sell-off going on starting in Asia.
In the US, the big drop in durable goods that came out before the open added fuel to the bears fire.
So, before the US markets opened, the Asian markets tanked and there was bad economic news.
Here is daily chart of the SPY.
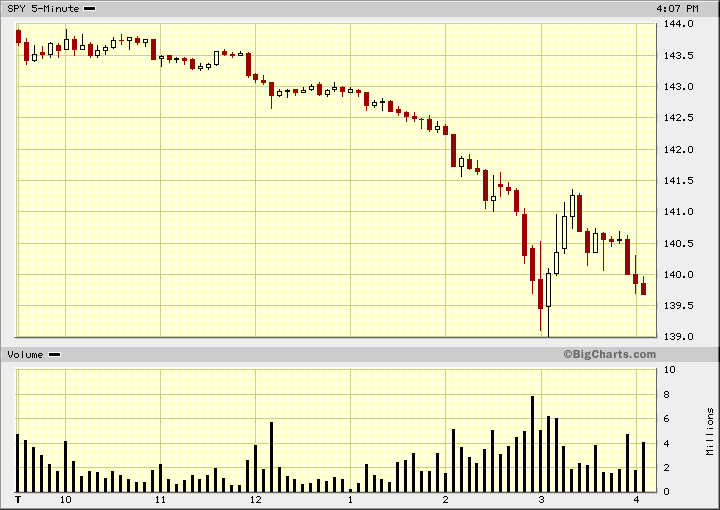
Notice this chart closed near the low point of the day and the last bar had big volume. There was one bounce about 3 PM. This chart says essentially one thing: the bears were in complete control of the day.
Here's a daily chart of the SPY's
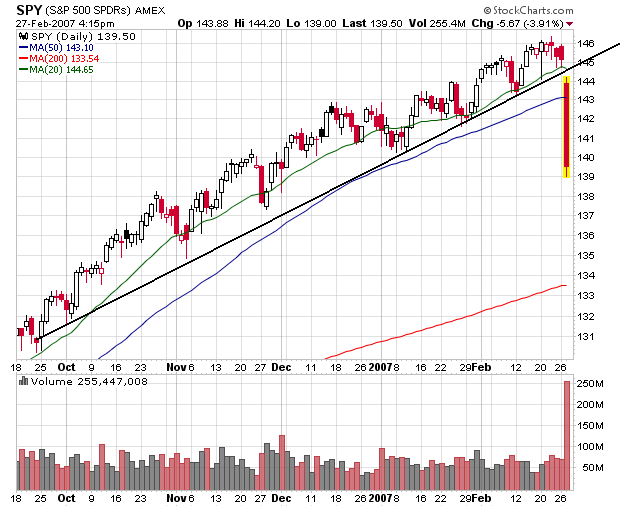
In one day the average broke through the uptrend and went through the 20 SMA and 50 SMA on enormous volume.
Here's a 5-minute chart of the QQQQs
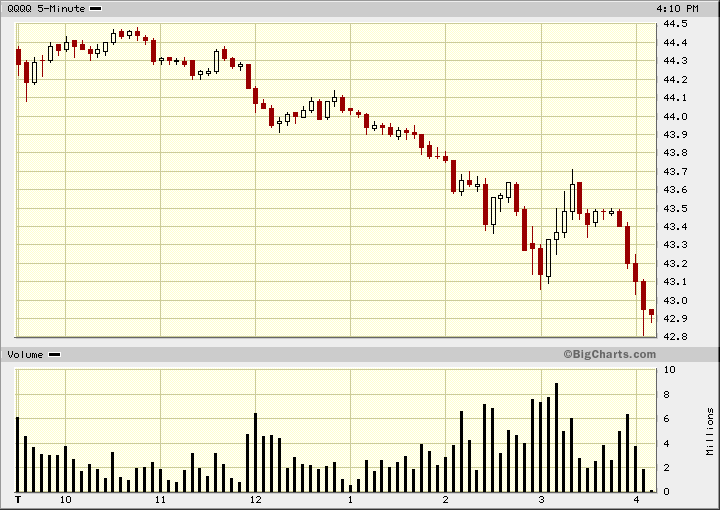
Like the SPYs, the QQQQs saw one bounce. They closed on the low point, although volume was weak on the last sell-off.
Here's the daily chart for the QQQQs
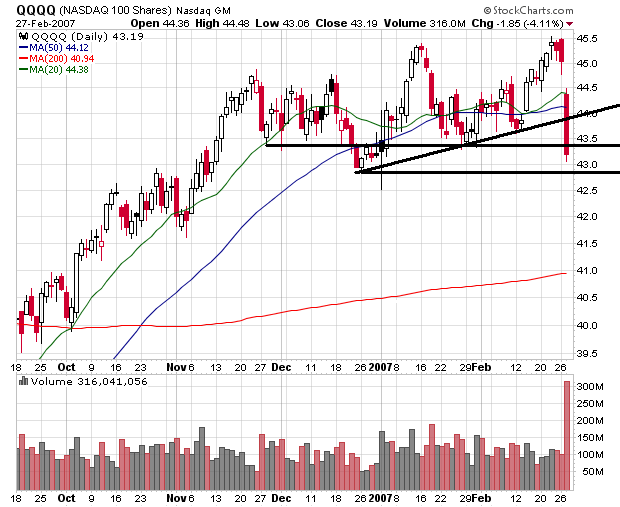
There was less technical damage on this chart -- although the damage is still pretty big. The QQQQs have been trading in a range since the end of November. Today we started near the top of the range and closed near the bottom on enormous volume.
Here's the daily chart of the IWNs
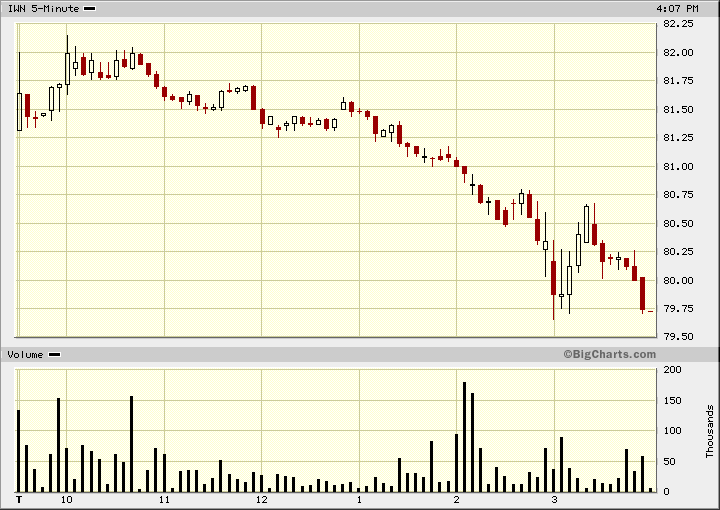
Like the other two averages we've looked at, there was one bounce. The index closed at the low point of the day, although the volume was weak.
Here's the daily chart of the IWN.
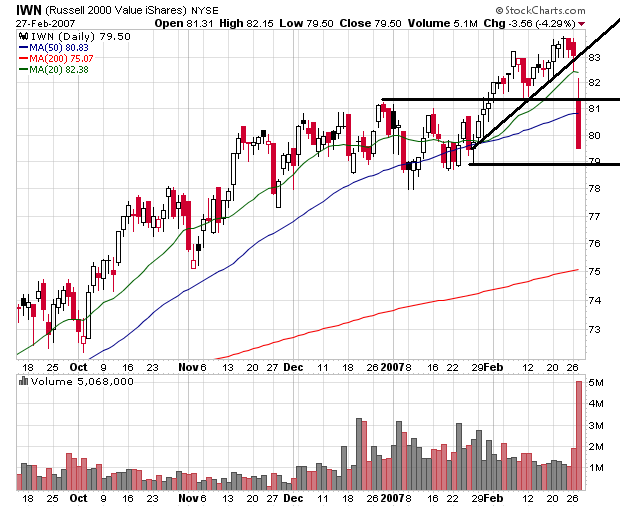
This index was rallying well until today. However, we broke through the uptrend, 20 and 50 SMA on enormous volume.
So, here's the summation.
All of the indexes dropped hard on big volume. They have all broken uptrends and moved through their respective 20 and 50 day SMAs.
All of the various sectors were down big as well. This sell-off spared no one. Basic materials (XLB)- down 3.17%, Financials (XLF) down 4.67, Energy (XLE) down 1.95%, Consumer Staples (XLP) down 3.06%, Health Care (XLV) down 3.04%, Consumer Discretionary (XLY) down 3.39% and Utilities (XLU) down 1.32%.
These are the kind of days that turn trends around. The bottom line is the volume indicates everybody was looking for the door today. The breaking of trend lines indicates a reversal occurred, further confirmed by the huge volume totals. The SPYs are clearly moving lower. The QQQQs need to move through 43.5 or so and the IWNs need to move through 78.60 for there to be a real break. But given today's action, we could have further drops tomorrow.
A big drop in China started it off:
The Shanghai Composite Index, which surged an astonishing 127% in 2006 and is up 13% over the last six sessions, plunged 8.8% -- the biggest one-day decline in 10 years. Worries the Chinese government may step up its efforts to curb speculative buying interest have been attributed to the consolidation that has aggravated ongoing concerns about overbought conditions and talks of a correction.
Here's more from Bloomberg:
China's stocks tumbled the most in 10 years on concern that a government crackdown on investments with borrowed money will end a rally that drove benchmarks to records.
...
The Shanghai and Shenzhen 300 Index slid 250.18, or 9.2 percent, to 2457.49. The measure, which jumped 13 percent in the past six sessions, closed at a record yesterday.
Today's rout wiped out $107.8 billion from a stock market that doubled in the past year as 249 of the key index's 300 shares plunged by the 10 percent limit. The 300 index is valued at 38 times earnings, compared with 16 times for the Morgan Stanley Capital International Emerging Markets Index.
The State Council, China's highest ruling body, has approved a special task force to clamp down on illegal share offerings and other banned activities in the market, the government said. The group will provide advice on regulations and policy explanations of the securities market, according to a statement published Feb. 25 on the central government's Web site.
I can't speak to the practices these proposed regulations are supposed to curb. However, I would assume they are a problem for the Chinese market.
Other developing countries sold-off in sympathy with China. The ETF for Malaysia was down 9%, Brazil was down 8.59%, Mexico was down 8%, and Singapore was down 7.8%.
So at the open, there was a rolling worldwide sell-off going on starting in Asia.
In the US, the big drop in durable goods that came out before the open added fuel to the bears fire.
Orders for durable goods decreased by 7.8% last month to a seasonally adjusted $203.90 billion, the Commerce Department said Tuesday. Durables rose 2.8% in December, revised from a previously estimated 2.9% increase.
A key barometer of business-equipment spending -- orders for nondefense capital goods excluding aircraft -- fell by 6.0%, after increasing 3.6% in December. Shipments for nondefense capital goods excluding aircraft decreased by 2.7%, after dropping by 0.8% in December; the shipments are used in calculating gross domestic product.
The 7.8% decrease in overall durable goods orders surprised Wall Street. The median estimate of 21 economists surveyed by Dow Jones Newswires had durables just 3.2% lower in the first month of 2007.
The manufacturing sector weakened in 2006. The economy had cooled and receding demand caused inventories at companies to pile up. Firms had to adjust inventory levels and depleting supplies meant fewer orders and cuts in production of goods. The auto business was hit particularly hard. The Federal Reserve recently reported industrial production made a surprising drop in January, falling by 0.5%.
So, before the US markets opened, the Asian markets tanked and there was bad economic news.
Here is daily chart of the SPY.
Notice this chart closed near the low point of the day and the last bar had big volume. There was one bounce about 3 PM. This chart says essentially one thing: the bears were in complete control of the day.
Here's a daily chart of the SPY's
In one day the average broke through the uptrend and went through the 20 SMA and 50 SMA on enormous volume.
Here's a 5-minute chart of the QQQQs
Like the SPYs, the QQQQs saw one bounce. They closed on the low point, although volume was weak on the last sell-off.
Here's the daily chart for the QQQQs
There was less technical damage on this chart -- although the damage is still pretty big. The QQQQs have been trading in a range since the end of November. Today we started near the top of the range and closed near the bottom on enormous volume.
Here's the daily chart of the IWNs
Like the other two averages we've looked at, there was one bounce. The index closed at the low point of the day, although the volume was weak.
Here's the daily chart of the IWN.
This index was rallying well until today. However, we broke through the uptrend, 20 and 50 SMA on enormous volume.
So, here's the summation.
All of the indexes dropped hard on big volume. They have all broken uptrends and moved through their respective 20 and 50 day SMAs.
All of the various sectors were down big as well. This sell-off spared no one. Basic materials (XLB)- down 3.17%, Financials (XLF) down 4.67, Energy (XLE) down 1.95%, Consumer Staples (XLP) down 3.06%, Health Care (XLV) down 3.04%, Consumer Discretionary (XLY) down 3.39% and Utilities (XLU) down 1.32%.
These are the kind of days that turn trends around. The bottom line is the volume indicates everybody was looking for the door today. The breaking of trend lines indicates a reversal occurred, further confirmed by the huge volume totals. The SPYs are clearly moving lower. The QQQQs need to move through 43.5 or so and the IWNs need to move through 78.60 for there to be a real break. But given today's action, we could have further drops tomorrow.
Market Update After Close
It's a bloodbath in the market right now. After the close I'll have a market update.
Existing Homes Sales Increase 3%.
From Bloomberg:
First -- color me impressed (and a bit surprised).
I think a fair amount of this has to do with interest rates.
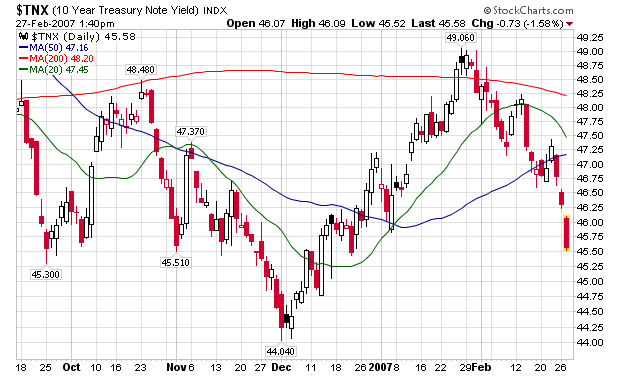
Here's a chart of the 10-year Treasury, expressed by the interest rate.
A while back I observed the 4.85% was near a restrictive interest rate on housing. Notice that rates have been dropping since the beginning of the year, and now stand at 4.55%. That is good for housing.
Sales of previously owned homes in the U.S. rose more than forecast in January to a seven-month high as lower prices and warm weather brought out more buyers.
Purchases increased 3 percent last month to an annual rate of 6.46 million, up from a 6.27 million December rate that was higher than previously reported, the National Association of Realtors said today in Washington. Sales fell 4.3 percent compared with a year earlier.
The report suggests that housing, recovering from its worst slump in 15 years, may be less of a burden on growth this year, economists said. Cheaper homes and low borrowing costs are spurring sales, while a plunge in January housing starts reported this month shows builders are trying to reduce a glut of unsold properties.
First -- color me impressed (and a bit surprised).
I think a fair amount of this has to do with interest rates.
Here's a chart of the 10-year Treasury, expressed by the interest rate.
A while back I observed the 4.85% was near a restrictive interest rate on housing. Notice that rates have been dropping since the beginning of the year, and now stand at 4.55%. That is good for housing.
Durables Goods Orders Drop
From Bloomberg:
These numbers are great cause for concern. Industrial production decreased .5% last month. Now we have a drop in durable goods orders, further indicating a manufacturing slowdown. The ISM number -- which comes out later this week -- has hovered around 50, which indicates contraction. The Fed surveys have been mixed this month.
Durable-goods orders fell 7.8 percent in January, reflecting the biggest slide in business equipment demand in three years, the Commerce Department said in Washington. At the same time, the Conference Board's consumer-optimism index unexpectedly increased to the highest level in more than five years, and the National Association of Realtors said existing- home sales rose more than forecast.
Durable-goods orders excluding transportation equipment dropped 3.1 percent, the most since July 2005. Excluding military equipment, orders fell a record 7.8 percent last month, while inventories of all durables rose 0.3 percent.
Reluctance to Invest
The figures suggest reluctance among companies to invest carried into 2007 after spending on equipment such as computers, machines and communications gear fell by the most in four years in the fourth quarter. Bloated stockpiles at auto dealers and construction-equipment makers may restrain production early this year, Bernanke told Congress this month.
These numbers are great cause for concern. Industrial production decreased .5% last month. Now we have a drop in durable goods orders, further indicating a manufacturing slowdown. The ISM number -- which comes out later this week -- has hovered around 50, which indicates contraction. The Fed surveys have been mixed this month.
China's Markets Drop Almost 9%
From the WSJ:
Shanghai's benchmark stock index plunged nearly 9% on Tuesday, its biggest drop in more than 10 years, as investors unloaded shares to lock in profits after recent gains. Asian-Pacific markets ended mostly lower.
The Shanghai Composite Index tumbled 8.8% to close at 2771.79, its biggest single-day decline since it fell 9.4% on Feb. 18, 1997, just after the death of Communist Party elder Deng Xiaoping. The Shanghai index had gained 1.4% on Monday to 3040.60, extending a spate of record high closes.
Shares in airlines, steelmakers and financial issues led declines, and Chinese traders said profit-taking was sparked by concerns additional macro-tightening policies could be introduced following the annual session of the China's National People's Congress that gets underway March 5.
Monday, February 26, 2007
Foreclosures Increasing
From Marketwatch:
And RealtyTrac reported last week that the number of homes entering the foreclosure process increased by 19% in January, compared with December's numbers. Compared with January 2006, the number of homes in the process is up 25%. In 2006, a total of 1.2 million homes entered the foreclosure process, 42% more than 2005.
On Technical Analysis
A poster has asked the very legitimate question of why do I use technical analysis.
I struggled for a long time with this question myself. However, it wasn't until I read some of the older classic trader's books that I really started to understand how it works. The works of Gann, Schabacker and Gartley-- especially Gartley-- were incredibly enlightening. First, none of these traders used TA exclusively; they used it as part of an overall strategy. For example, in one book written in the 1930s, Gann spends a great deal of time talking about what industries will start to boom in the 1940s. He would combine these observations with TA to determine when to buy. All of these traders clearly stated many times that TA was not the hold grail and that the markets would do everything they could to make a fool of you. In other words, always be prepared to be wrong.
What I found confusing was the inclusion of a large number of indicators -- RSI, Stochastics, MACD etc.... These more modern ideas were really more statistical noise to me then helpful indicators. That's one of the reasons I almost never use them. I like to know where prices are now, where they have been. how many people are buying and selling (volume) and what the general trends are (simple moving averages). These basic data points are often all any trader really needs to know.
That being said, TA is not a holy grail of analysis. It can increase the probability of success. It is not a guarantor of success. In fact, no form of analysis is perfect. I've seen companies that were fundamentally undervalued languish at low prices for years despite the fact they were undervalued.
So here's the point.
1.) TA can help you figure out where prices have a higher probabilty of going.
2.) TA can tell you when it's a better time to buy.
3.) The markets can hand you your ass at a moments notice.
Will Commodities Rally Soon?
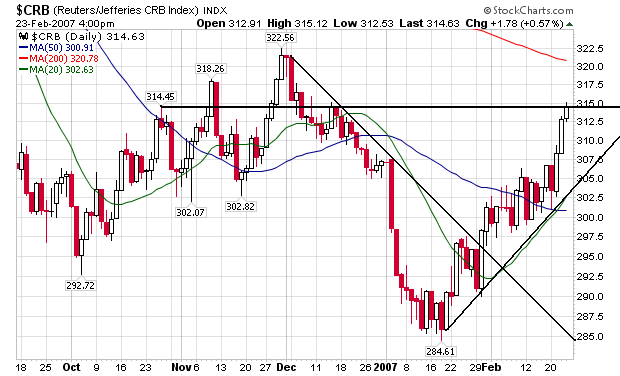
The charts from the metals got me thinking about the overall commodities situation. Here is the daily chart from Stockcharts:
Notice the chart has broken through the downtrend started in early December. In addition, we have a nice strong uptrend that has broken through the moving averages. Finally, the 20 Day SMA has crossed the 50 day SMA -- another bullish sign.
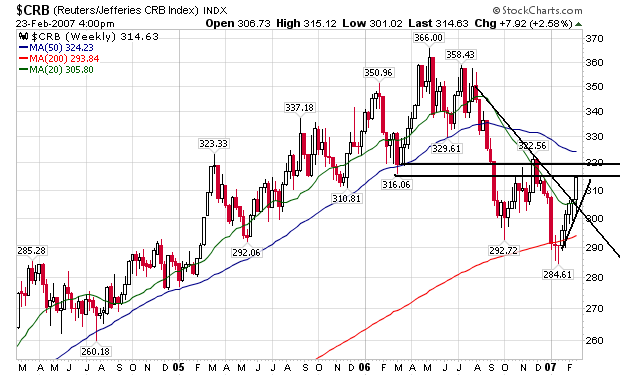
Here's the weekly chart:
On the weekly chart we've also broken through the downward sloping trend line, crossed a moving average and are in a strong uptrend. While we are far off our highs of last year, the trend appears to be heading up.
Oil Moving Up
From Reuters:
Strong net-long positions entering the market + decreased supply because of production cuts + summer driving season + Iranian tensions = higher prices.
Some analysts see a growing upward momentum for oil and note the latest data from the New York Mercantile Exchange points to an increase in investment by large funds.
"It is the first time this year that the large speculative funds are showing a net long position in crude oil," said Olivier Jakob, an analyst at Swiss-based Petromatrix.
Oil prices have swung between a high of $78.40 last July, when fighting flared in Lebanon, and a 20-month low of $49.90 in January when an expected influx of fund money failed to materialise, disappointing oil investors.
A steady recovery in prices since late January has been supported by gradually tightening supplies -- OPEC has twice cut output since November -- and by concerns over a possible disruption of Iran's oil supplies.
Strong net-long positions entering the market + decreased supply because of production cuts + summer driving season + Iranian tensions = higher prices.
Metals May Be Looking At a Summer Rally
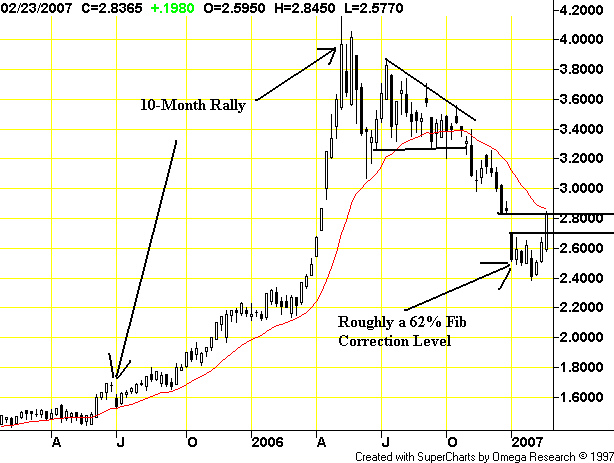
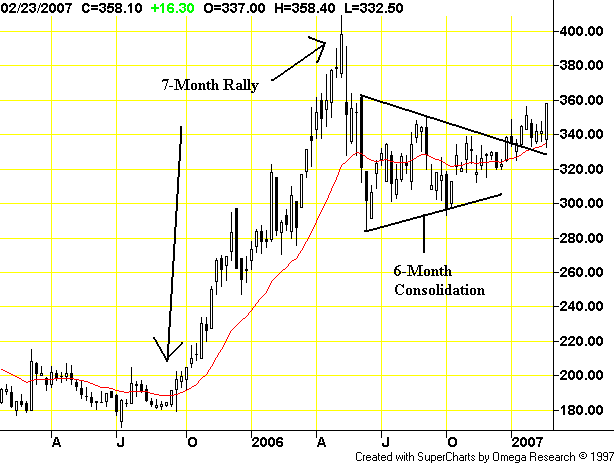
Here are three charts that may indicate metals are thinking about a summer rally:
Here's a chart for copper:
This is the weakest of the three charts, largely because of large sell-off and gapping down formation. The gap down could be a selling-exhaustion gap, indicating the last of the sellers finally got out of the metal at the beginning of the year. Using Gann style accumulation analysis, this means the only buyers will be longer term investors who are looking at making a long-term play. If that is the case, than copper has formed a base here and is looking to rally.
Here's a chart for Palladium:
We saw consolidation in the latter part of last year in a classic triangle trading pattern. This period essentially shook-out the positions from the previous rally and allowed other longer-term players to accumulate longer-term positions. Either way, the 6-month consolidation helped to establish a base for a summer rally.
Here's the chart for Silver:
This chart's analysis mirrors that for Palladium, although the triangle consolidation is a bit wider.
All of these charts are possibly signaling an upward move. Remember we still have China and India on-line for very strong growth rates, increasing demand for base metals.
Sub-Prime Funds Drying Up
From the WSJ:
So, lenders still want to do deals, but are actually asking for documentation and savings and being more selective.
The 2006 vintage sub-prime loans are already defaulting at a high rate. That indicates lending standards were far too loose.
However, I think an economist can convincingly argue the increase in home ownership in 2006 and probably the latter part of 2005 was largely the result of very lax credit standards. Assuming that is true, that means the latter part of the housing boom was essentially a speculative excess rather than actual investment. That means we're going to have a prolonged shakeout period where poor credit risks have to be shaken out. This will lead to a prolonged period of correction in the housing market.
Fears about defaults are slowing the gusher of investor funds going to riskier segments of the mortgage market. That means less money available for "subprime" loans to riskier borrowers, forcing lenders to focus more on borrowers who can afford down payments and have well documented finances. With fewer lower-income Americans able to buy homes, downward pressure on prices will probably increase.
These pressures have intensified in recent days. The cost of insuring mortgage-bond holders against default risk, as measured by the so-called ABX index, has soared, deepening the concerns of investors in collateralized debt obligations, among the biggest holders of riskier mortgage bonds. Managers of some CDOs are delaying new offerings to "wait for the dust to settle," a process that could take weeks or months, says Chris Flanagan, head of CDO research at J.P. Morgan Chase & Co.
"CDO managers and hedge funds still want to do CDOs, but the conditions are much, much tougher," David Liu, a mortgage analyst with UBS AG, adds.
So, lenders still want to do deals, but are actually asking for documentation and savings and being more selective.
"It's tightening up a lot," said Eddie Carmona, branch manager at Homewood Mortgage in Carrollton, Texas, a mortgage broker that handles subprime borrowers.
Carmona said down payment requirements are the biggest change he's seen.
"Before, you didn't have to bring a down payment," Carmona said.
Other changes:
Higher credit scores. Previously, borrowers with a FICO credit score as low as 570 (out of 850) could qualify for a single loan financing 100 percent of their home purchase, Carmona said.
"Now, across the board, it's jumped up to a 600 FICO score for an 80/20 loan," Carmona said, in which a second loan has to be taken out to finance the remaining 20 percent of the home value.
Rising interest rates. Rates on subprime mortgages have risen about a full percentage point since September, Carmona said, while regular mortgage rates have been relatively steady.
More stringent savings requirements. "They want to see borrowers have at least three months of reserves in their account in case of an emergency," Carmona said.
The 2006 vintage sub-prime loans are already defaulting at a high rate. That indicates lending standards were far too loose.
However, I think an economist can convincingly argue the increase in home ownership in 2006 and probably the latter part of 2005 was largely the result of very lax credit standards. Assuming that is true, that means the latter part of the housing boom was essentially a speculative excess rather than actual investment. That means we're going to have a prolonged shakeout period where poor credit risks have to be shaken out. This will lead to a prolonged period of correction in the housing market.
Sunday, February 25, 2007
Home Supply Stores See Earnings Drop
From the Houston Chronicle:
I don't see how this news can bolster any argument housing is bottoming. The short version is we still have a ways to go here.
Lowe's Cos., the nation's second biggest home improvement store chain, said Friday that its fourth-quarter profit fell 11.5 percent due to a slowing home improvement market amid a continued slump in the housing sector.
The Mooresville, N.C.-based retailer said it earned $613 million, or 40 cents a share, for the three months ended Feb. 2, down from $693 million, or 43 cents a share, a year earlier.
Revenue fell to $10.4 billion from $10.8 billion a year earlier. Same-store sales, or sales in stores open at least one year, a key measure of industry performance, fell 5.3 percent.
Analysts surveyed by Thomson Financial had been looking for net income of 37 cents a share on revenue of $10.36 billion. The estimate for earnings typically excludes one-time items.
On Tuesday, rival Home Depot Inc., the nation's largest home improvement store chain, said its fourth-quarter income dropped 28 percent. Its same-store sales dropped 6.6 percent.
"Sales continued to be pressured by a slowing housing market, tough comparisons to last year's hurricane recovery and rebuilding efforts and significant deflation in lumber and plywood prices," Robert A. Niblock, Lowe's chairman and chief executive said in a statement accompanying the results.
I don't see how this news can bolster any argument housing is bottoming. The short version is we still have a ways to go here.
Is Gold Telling Us Inflation Expectations Are Rising?
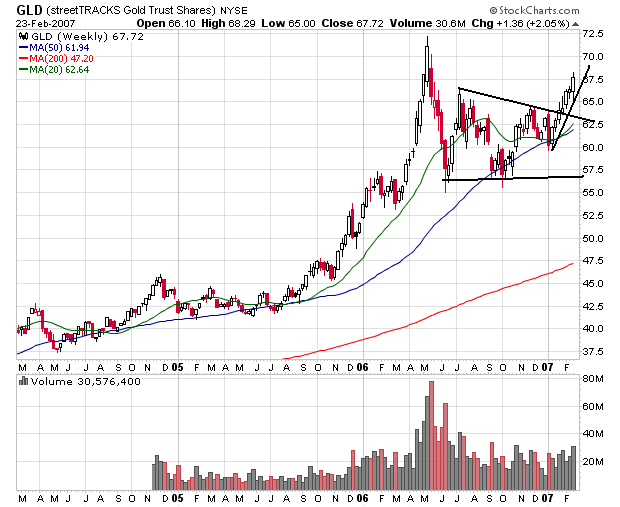
I'm not a big gold bug. However, gold can tell us what people may be thinking about inflation. If gold prices are increasing, it may signal that people think inflation will pick-up.
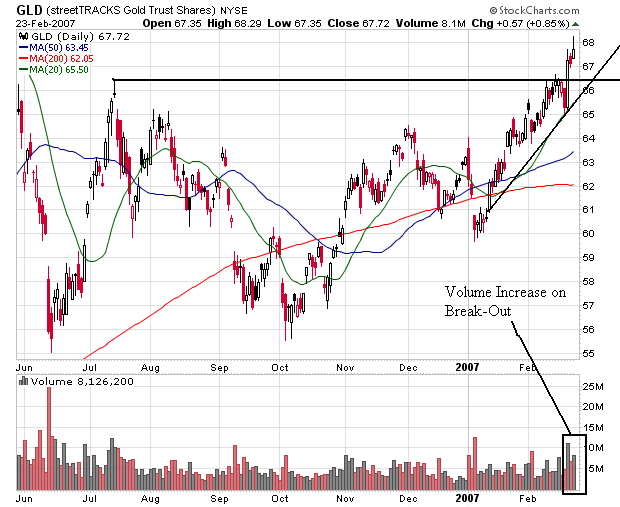
Here's a chart of the gold ETF:
Last week, the ETF broke through resistance on strong volume. In addition, an uptrend is strongly intact. Both of these moves indicate a bull run may have started.
Here's the weekly chart:
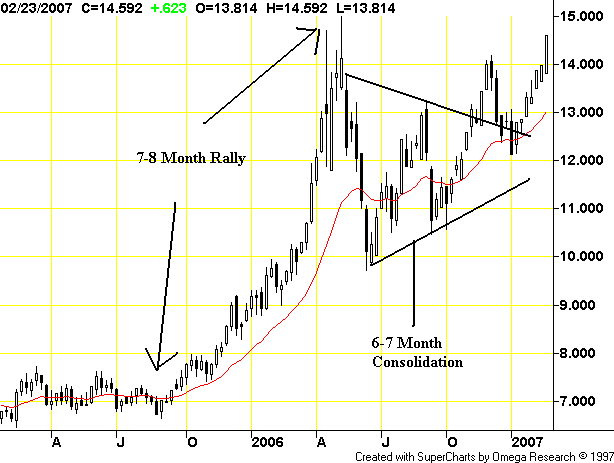
Notice the chart spent about 6 months consolidating gains in a classic triangle formation. Then last week, the chart broke-out on strong weekly volume. We also have a strong uptrend intact.
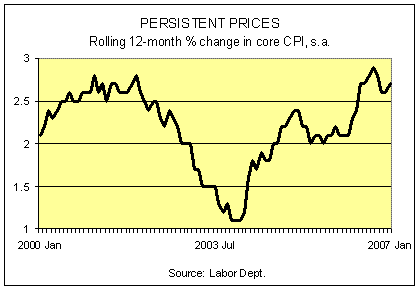
What set this off? Last week we had a bearish CPI report from the BLS. Here's a chart of the rolling change on CPI from The Capital Spectator
As the CS noted:
So long as inflation is in that kind of uptrend, gold has a strong wind at its back.
Here's a chart of the gold ETF:
Last week, the ETF broke through resistance on strong volume. In addition, an uptrend is strongly intact. Both of these moves indicate a bull run may have started.
Here's the weekly chart:
Notice the chart spent about 6 months consolidating gains in a classic triangle formation. Then last week, the chart broke-out on strong weekly volume. We also have a strong uptrend intact.
What set this off? Last week we had a bearish CPI report from the BLS. Here's a chart of the rolling change on CPI from The Capital Spectator
As the CS noted:
Core CPI is now running at a 2.7% annual pace through last month. That's up from 2.6% for 2006 and close to the peak of recent years (2.9%) set last September. The rising pace of core inflation is a problem because the Fed is widely reported to have a target of 1-2% for core. By that standard, the central bank is behind the monetary eight ball.
The Fed, in sum, has more work to do to bring core CPI down, or at least convince the market that core CPI is no longer rising. There's reason to wonder how this task will play out. As we reported on Monday, the pace of growth is rising for M2 money supply. Coincidence? For the moment, we prefer to err on the side of caution and answer "no."
So long as inflation is in that kind of uptrend, gold has a strong wind at its back.