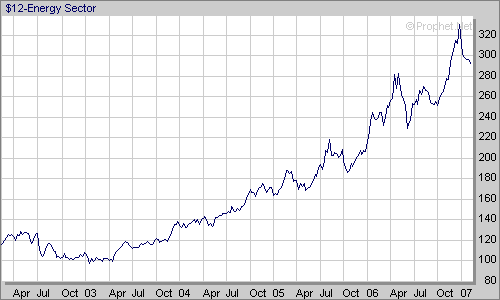
This is a chart of the overall energy industry via Prophet.net
Notice how the sector has sold-off from the highs of late last year. This may be the type of blow-off the industry needed to clear out the dead weight. The index has pulled back to within the Fibonacci retracement levels (roughly between 38% and 62% of the preceding rally).
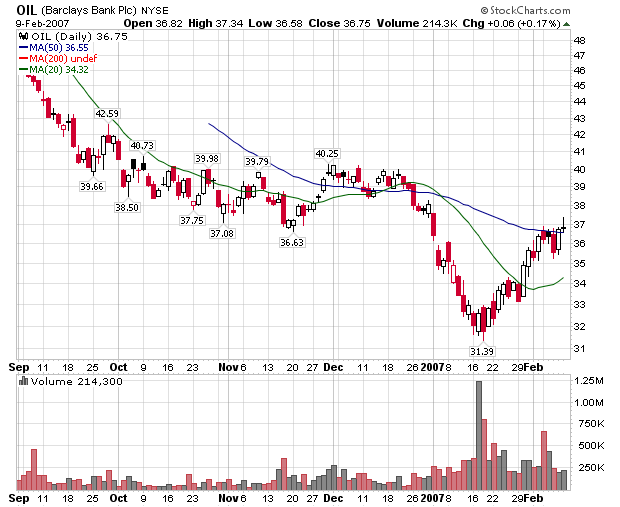
Here's a chart of oil -- actually the OIL tracking stock.
A break-out about $60/bbl for oil or $37 on the chart could signal a new upswing. If that happens, oil will become more profitable making the energy sector more attractive.
This strategy is based on oil. So wait for oil to move above resistance by at least 2-3%.
Saturday, February 10, 2007
Another Look at Sub-Prime Mortgages
From the Street.com
Notice the really large jump in sub-prime mortgage (SPM) delinquencies. This is not a simple statistical anomaly; it's a really big jump that should raise a lot of eyebrows.
Now combine that with the increased penetration of SPMs + the increase in low documentation loans and the problem looks worse.
Now add to that the fact that an economy growing at 3.5% has a default rate above the level recorded during a recession.
One of the stock boards I watch and participate in was speculating that yesterday's news from NEW and HSBC was the watershed event of this quarter, signaling the beginning of a downturn. I'm not sure I would go that far in my prognosis, but I do believe we are just seeing the beginning of this problem. Up until now housing has only damaged housing; we haven't seen the housing downturn bleed into consumer spending. Once we start to see that in a major way, we'll have serious problems.
Nationwide, the subprime default rate soared to 10.09% in November 2006 -- it stood at only 6.62% a year earlier). Despite a growing economy in early 2007, November's industry default rate exceeded the level of November 2001, which was recorded at the bottom of the last recession. However, the problem runs deeper than 5 1/2 years ago because nearly 15% of the mortgages made in 2006 were subprime. That is almost triple the penetration of subprime compared to 2000-01.
* Subprime has never been more levered -- just as the housing cycle has peaked. Loan-to-value ratios have risen from about 78% in 2000 to 86% today.
* Subprime has never been more dependent on the candor of borrowers. Low-documented loans have doubled to 42% of subprime loans over the last six years.
* Creative loans -- non-interest paying, option ARMs, etc. -- represented nearly half of all loans made over the last 12 months. At the turn of the decade these loans represented less than 2% of total mortgage loans!
Notice the really large jump in sub-prime mortgage (SPM) delinquencies. This is not a simple statistical anomaly; it's a really big jump that should raise a lot of eyebrows.
Now combine that with the increased penetration of SPMs + the increase in low documentation loans and the problem looks worse.
Now add to that the fact that an economy growing at 3.5% has a default rate above the level recorded during a recession.
One of the stock boards I watch and participate in was speculating that yesterday's news from NEW and HSBC was the watershed event of this quarter, signaling the beginning of a downturn. I'm not sure I would go that far in my prognosis, but I do believe we are just seeing the beginning of this problem. Up until now housing has only damaged housing; we haven't seen the housing downturn bleed into consumer spending. Once we start to see that in a major way, we'll have serious problems.
A Second Reason for the Market's Ceiling?
I have speculated that the Fed's still very Hawkish stance on inflation is one of the primary reasons the markets have traded in a range for the last few months. Yesterday's hawkish statements from three Fed governors (see below) certainly didn't help that scenario.
Now we have a second possible ceiling: declining earnings expectations:
We have seen strong earnings growth for the last few years. However....
If this analyst is correct that a drop in energy earnings is a prime reason for the overall decreased guidance then we might see some surprises in the second quarter. Here is a chart of the crude oil tracking ETF. Right now the market is consolidating.
The cold US weather has helped to contribute to the recent rally. In addition, OPEC production cuts are now working their way through the oil market. And China and India are still growing at a fast pace which will increase overall demand.
Now we have a second possible ceiling: declining earnings expectations:
Fourth-quarter earnings rose to 10.8% from 10.3% last week, according to Thomson Financial.
More than 360 companies in the S&P 500 index have reported results as of late Thursday, and 66% of the results have surpassed Wall Street's expectations;16% have matched; and 18% have missed.
"The earnings so far have been in line with expectations," said Metz. "The real issue is guidance."
We have seen strong earnings growth for the last few years. However....
John Butters, senior research analyst at Thomson Financial, said the outlook for the first quarter has turned bleaker, he said. The first-quarter growth rate is now 4.7%, down from the projection of 8.7% at the beginning of the quarter.
Butters said the bulk of that decline comes from analysts cutting their earnings forecasts for the energy sector, which had been dealing with a fall in crude-oil prices and higher productions costs.
Also, companies are not raising their financial forecasts as much as he's seen in the past. He said 14 companies have currently lifted their forecasts for the first quarter; he usually sees higher outlooks from 25 companies at this point in the reporting cycle.
If this analyst is correct that a drop in energy earnings is a prime reason for the overall decreased guidance then we might see some surprises in the second quarter. Here is a chart of the crude oil tracking ETF. Right now the market is consolidating.
The cold US weather has helped to contribute to the recent rally. In addition, OPEC production cuts are now working their way through the oil market. And China and India are still growing at a fast pace which will increase overall demand.
Friday, February 9, 2007
The Market's Last Week
All of the charts are from Stockcharts.com
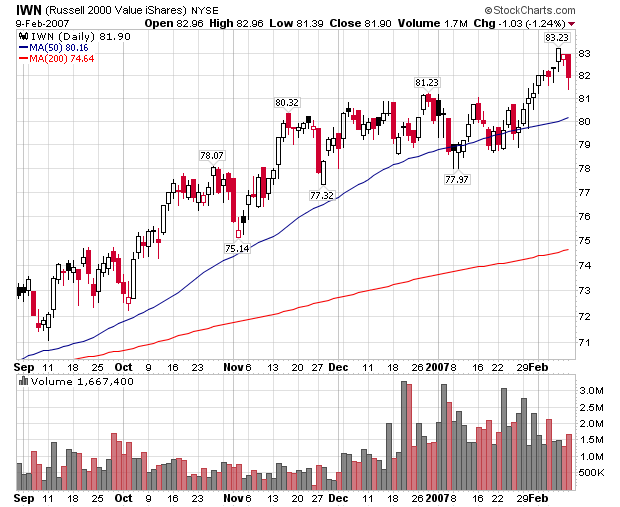
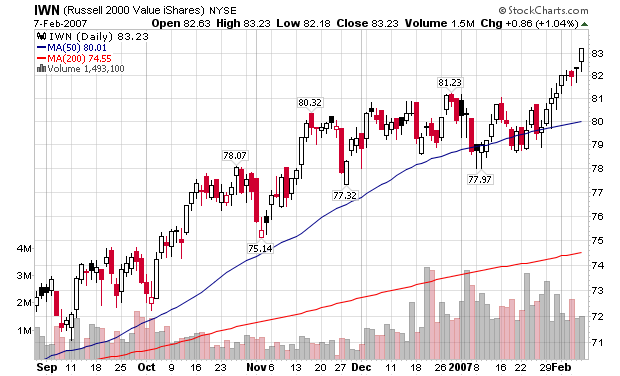
Here's the Russell 2000
This index broke out of a trading range last week and continued moving up until Friday. The index rose 2.46% above the early December high before Friday's sell-off. The latter part of the rally lacked a strong amount of volume, making that move a bit suspect. However, sell-offs in rallies aren't necessarily a bad thing as they clear out some dead-weight. If this index reaches support at 81.23 and bounces off the index will be in good shape for another move up.
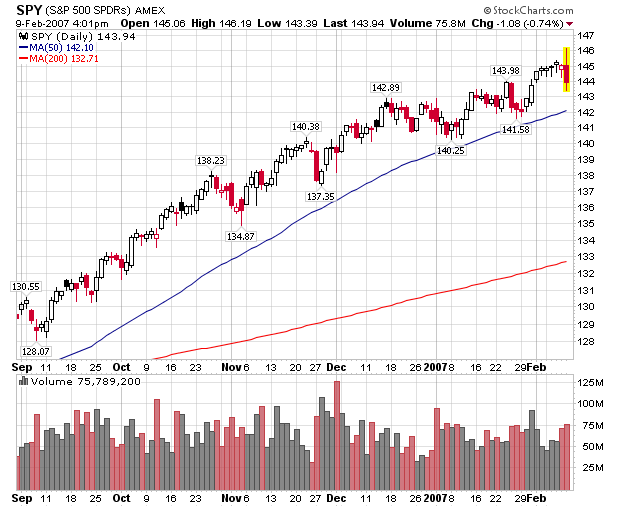
The SPY's rally for the week of 29 January to 2 February was suspect because of the declining volume of the move up. The market had four spinning top candle's before Friday's sell-off. There was ample news to move the market higher -- solid earnings and strong GDP. However, there just isn't enough buying enthusiasm right now. As a result the market was ripe for a pull-back. The higher volume total on Friday indicates selling pressure is very much alive in the markets.
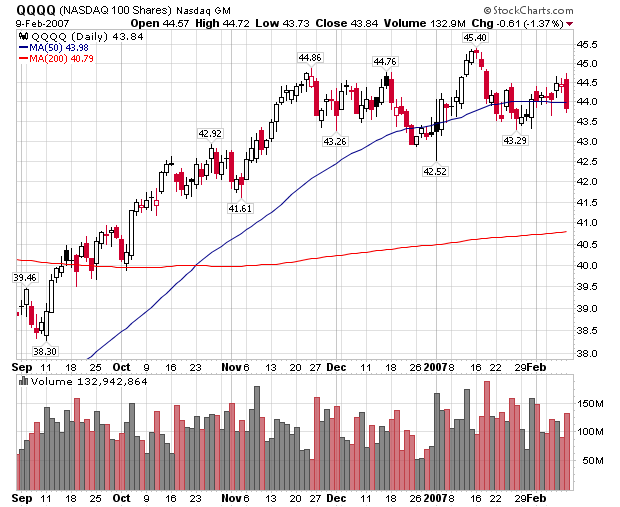
The QQQQs tried to continue the rally of 28 January - 2 February, but just didn't have enough buying interest. The index has been trading in a loosely defined range of roughly 43-45 with one run above and below that number. Trading ranges indicate supply and demand are in balance as traders are unwilling to commit one way or the other.
3 Fed Bankers Warn on Inflation
Richard Fisher from the Dallas Fed
The St. Loius Fed's William Poole:
Sandra Pianalto of the Cleveland Fed.
Short version: There is no rate cut in the near future.
If you’ll permit me to again use a meteorological metaphor: We have some disinflationary tailwinds assisting us. There was a series of monetary policy tightenings by the FOMC that preceded the latest series of pauses that began last August. Also, moderation in energy prices proved beneficial, while continued productivity gains, although less than we had expected, should keep labor costs in check. And spillovers from the unwinding of excessive housing market speculation, including softening in the price of lumber and such commodities as zinc and copper, have all added force to the tailwinds we’ve been seeing. I find it instructive that, other than from corn farmers, I no longer hear business leaders muttering about “pricing power,” which not too long ago was an ever-present part of inflation discussions.
Yet, we do have some inflationary headwinds to overcome. For example, economists use a theoretical metric that attempts to measure the costs of housing—something they refer to as “owner’s equivalent rent,” or OER. OER makes up the largest individual component of the core price index for consumer expenditures, with a 14 percent weight in the index. The way the math works, when the price of the nation’s housing stock declines, this rent equivalent increases. At year end, it was rising at a rate of 4.3 percent, adding to inflationary pressures. Also, the substantial demand for skilled and some semiskilled labor is driving up wages in those important labor pools. And rapid growth in foreign economies—from China and India to our southern neighbors and our friends across the Atlantic—increases global resource utilization, tightening the availability and prices of inputs and labor that American businesses use to control their cost-of-goods-sold and enhance their productivity.
We will monitor the net effect of these headwinds and tailwinds.
I wouldn’t rule out further increases in the federal funds rate if inflationary winds gain the upper hand. Indeed, if increases are needed, I would aggressively advocate for them. But for now, I am as comfortable with the inflationary outlook as a prudent central banker can be. No central banker can ever be smug about containing the risk of inflation, but I am pleased with the current direction of inflationary impulses. To quote from the FOMC statement released after our meeting last week: “Readings on core inflation have improved modestly in recent months, and inflation pressures seem likely to moderate over time.” That said, I will rest a heck of a lot easier when we get the core rate down well below 2 percent and keep it there.
The St. Loius Fed's William Poole:
Regarding the outlook for inflation, I’ve said for quite some time that it might take a while for underlying price pressures to recede. Recent inflation data themselves, and other information relevant to judging the inflation outlook, suggest that the inflation rate is likely to fall into a reasonable range this year. If, however, core inflation seems to be settling at a rate above 2 percent, then such an outcome would be unacceptable to me. I put a very high weight on the Fed’s responsibility to maintain low and stable inflation.
Sandra Pianalto of the Cleveland Fed.
The most recent inflation statistics have improved. The core Consumer Price Index - which excludes food and energy items - rose by about 2-1/2 percent last year. However, during the last three months of the year, this index increased at an annual rate of only about 1-1/2 percent. I regard this movement as an encouraging sign, but I am not yet convinced that the inflation trend is shifting down.
The national inflation picture has been clouded in the past few years by large swings in energy, commodity, and housing prices. As these markets normalize, and as we gain a clearer picture of the underlying inflation trend, we may see that some inflation risks remain. In that case, some additional policy firming may be needed - depending, of course, on the outlook for both inflation and economic growth.
Short version: There is no rate cut in the near future.
An Overview of The Last Few Days Sub-Prime News
From Seeking Alpha:
I hadn't realized the New was expected to report income of $1.06/share. That makes their reporting a loss that much more surprising.
In addition, notice the huge jump in late payments indicates there are serious problems in the sub-prime market. This issue isn't going away anytime soon.
Investors received a rude wake-up call Wednesday when instead of reporting earnings as scheduled, New Century Financial Corp., the nation's second-largest sub-prime lender, announced it was pushing off its earnings release, and that shareholders should expect a surprise loss in 4Q06 instead of the $1.06 EPS the Street was expecting. Research firm First American LoanPerformance says that in November, payments were overdue on 12.9% of sub-prime loans packaged into mortgage securities, vs. 8.1% a year earlier. New Century's announcement came less than a day after HSBC reported its sub-prime division was also under significant pressure from rising defaults.
I hadn't realized the New was expected to report income of $1.06/share. That makes their reporting a loss that much more surprising.
In addition, notice the huge jump in late payments indicates there are serious problems in the sub-prime market. This issue isn't going away anytime soon.
Circuit City To Close 69 Stores
From the Houston Chronicle
If memory serves (and please correct me if I am wrong), Wal-Mart started the Christmas season with a big discount on a specific flat panel TV. The other electronics retailers followed this with similar cuts in their inventory. The Big Picture mentioned this in their analysis of the Christmas season, pointing out the actual cost of the Christmas season in terms of decreased business margins.
This is the end result. While the Christmas season was fair but not great, the overall cost appears to be extreme margin pressure at one of the largest consumer electronics stores in the country.
Circuit City Stores Inc., the nation's No. 2 consumer electronics retailer, said Thursday it plans to close seven domestic Superstores, a Kentucky distribution center and 62 company-owned stores in Canada to cut costs and improve its financial performance.
The closings will take place over the next six months at an expected total cost of $85 million to $105 million, all to be incurred in the current fourth fiscal quarter, which ends Feb. 28, Circuit City said.
"Because of the intensified gross margin pressures that we saw in the third quarter within the flat panel television category, we launched efforts to accelerate the timing of planned initiatives to improve sales and gross margin, as well as improve the efficiency of our expense structure," chief executive Philip J. Schoonover said in a statement.
If memory serves (and please correct me if I am wrong), Wal-Mart started the Christmas season with a big discount on a specific flat panel TV. The other electronics retailers followed this with similar cuts in their inventory. The Big Picture mentioned this in their analysis of the Christmas season, pointing out the actual cost of the Christmas season in terms of decreased business margins.
This is the end result. While the Christmas season was fair but not great, the overall cost appears to be extreme margin pressure at one of the largest consumer electronics stores in the country.
Thursday, February 8, 2007
Same Store Sales Up 3.9%
From MarketWatch:
I'm still at a loss for the disconnect between the problems in the housing market and the continued strength of consumer spending. One of the reasons I thought there would be a recession at the end of 2006 or early 2007 was the expectation of the housing market problems bleeding into consumer spending. That hasn't happened. At least not yet.
Same-store receipts at 55 of the nation's top chain-store retailers climbed 3.9% last month, according to Thomson Financial. That's above the 3.1% forecast. Same-store sales, considered the best measure of retail growth, are gleaned from the receipts rung up at stores open longer than a year.
At the International Council of Shopping Centers, which calculates same-store sales in a slightly different manner, the results were 3.7% higher, exceeding the 3% projection.
"Overall, the tone was pretty good," said Michael Niemira, ICSC's chief economist. "It was certainly a nice finish to the fiscal year -- and a nice start to the calendar year."
I'm still at a loss for the disconnect between the problems in the housing market and the continued strength of consumer spending. One of the reasons I thought there would be a recession at the end of 2006 or early 2007 was the expectation of the housing market problems bleeding into consumer spending. That hasn't happened. At least not yet.
Yield Curve Inversion Continues
From Caroline Baum of Bloomberg:
This is a really long time for an inversion to continue. And it begs the question, "is this inversion different than past inversions?" After all, 4th quarter GDP came in at 3.5%, and unemployment is low, indicating a recession isn't on the horizon yet. Or it's been averted for awhile.
I don't have an answer for the above statements. What I think is the "this time is different" argument does not play well with historical evidence. As Baum also notes this indicator is not the "hemline indicator". There's a fundamental reason for the inversion. And until the inversion goes away, we should pay attention to the yield curve.
Depending on what measure of short- and long-term rates one uses, the slope has been negative for either six months (using the 3-month Treasury bill and 10-year note) or seven months (using the federal funds rate and 10-year Treasury note). A yield curve that slopes upward, with long rates higher than short ones, encourages financial institutions to borrow short, lend long and pocket the difference, promoting economic growth in the process.
An inverted yield curve has been a harbinger of recession in the past. Unless this time is different -- a popular way of dismissing the spread's stellar history -- real gross domestic product growth of 3.5 percent in the fourth quarter may turn out to be the outlier, not the trend.
This is a really long time for an inversion to continue. And it begs the question, "is this inversion different than past inversions?" After all, 4th quarter GDP came in at 3.5%, and unemployment is low, indicating a recession isn't on the horizon yet. Or it's been averted for awhile.
I don't have an answer for the above statements. What I think is the "this time is different" argument does not play well with historical evidence. As Baum also notes this indicator is not the "hemline indicator". There's a fundamental reason for the inversion. And until the inversion goes away, we should pay attention to the yield curve.
Home Builders Lose Billions on Land Speculation
From Bloomberg
This is a very unflattering portrait of the homebuilders management teams. Either,
1.) They didn't know the role of speculators, which indicates they didn't know their own market very well, or
2.) They knew and didn't care about thinking the market would go up forever -- implying they were basically willfully blind to the situation
or a combination of the two.
Either way, we have executives who weren't being that smart.
The worst housing slump in 16 years made a lot of smart money vanish. D.R. Horton Inc., Pulte Homes Inc., Lennar Corp., Centex Corp. and Toll Brothers Inc., the five biggest U.S. homebuilders, said plummeting land prices cost them a combined $1.47 billion in the fourth quarter.
Builders paid more for land during the boom because home prices were rising, too. They didn't realize speculators were pumping up demand by buying houses to sell quickly. When prices reached a point where speculators quit buying, homebuilders were forced to abandon so much property they helped create a glut that drove down land prices more than 9 percent last year, according to data compiled by New York-based research firm Real Capital Analytics Inc.
``Homebuilders allowed their own enthusiasm for price increases on houses to affect their decisions on what they would pay for land,'' said Mike Inselmann, president of Metrostudy, a real estate research firm in Houston.
The decline in land values reveals the role short-term buyers played in the housing boom, when the median U.S. home price rose to $276,000 last June from $177,000 in February 2001. Industry executives, including Toll Brothers Chief Executive Officer Robert Toll, estimated that about a quarter of their houses were bought by people interested only in flipping them -- buying and selling quickly rather than moving in.
This is a very unflattering portrait of the homebuilders management teams. Either,
1.) They didn't know the role of speculators, which indicates they didn't know their own market very well, or
2.) They knew and didn't care about thinking the market would go up forever -- implying they were basically willfully blind to the situation
or a combination of the two.
Either way, we have executives who weren't being that smart.
Toll Brothers Revenue Drops on Cancellations
From Bloomberg:
"Incentives are failing to stem cancellations". That's a big deal. For the last 9-12 months, home builders have offered incentives to encouraged purchasers. Some of these incentives have been pretty big. But these aren't working as well as expected. Basically, homebuilders are having trouble paying people to purchase homes.
In addition, Toll Brothers caters to the high-end market -- the part of the market that shouldn't be bothered by a recession. Even this part of the market is slowing down. That's a big deal as well.
Housing bottom? Very doubtful at this point.
Toll Brothers Inc., the largest U.S. builder of luxury houses, said fiscal first-quarter homebuilding revenue dropped 19 percent as customers canceled contracts. The company said land writedowns will exceed previous forecasts.
Homebuilding revenue declined to $1.09 billion in the three months ended Jan. 31 from $1.34 billion a year earlier, Horsham, Pennsylvania-based Toll said today in a statement.
Orders for Toll Brothers, whose houses cost three times the U.S. median, have fallen as its inventory of unsold homes swells. That has led many luxury-home buyers to balk at making a purchase on the expectation of falling prices or higher sales incentives. Lennar Corp. and D.R. Horton, the two largest U.S. home builders, have reported profit declines as incentives failed to stem cancellations and sales slumped the most in 15 years.
``It appears that the pace of cancellations is starting to abate,'' Chief Executive Officer Robert Toll said in the statement. ``However, we are still well above the company's historical average of about 7 percent.''
"Incentives are failing to stem cancellations". That's a big deal. For the last 9-12 months, home builders have offered incentives to encouraged purchasers. Some of these incentives have been pretty big. But these aren't working as well as expected. Basically, homebuilders are having trouble paying people to purchase homes.
In addition, Toll Brothers caters to the high-end market -- the part of the market that shouldn't be bothered by a recession. Even this part of the market is slowing down. That's a big deal as well.
Housing bottom? Very doubtful at this point.
Wednesday, February 7, 2007
Fed Chair Plosser On Inflation
From his speech today:
Short version: I'm not going to vote for lower rates anytime in the near future.
In addition, Fed Chair Yellen made similar comments a few days ago.
There is no rate cut in the foreseeable future.
Let me close with a few thoughts about the outlook for inflation and the proper stance of monetary policy. As I mentioned at the outset, I considered inflation to be uncomfortably high in 2006, and inflation remains a primary concern of mine for 2007. While we got some encouraging inflation numbers toward the end of last year, I am not convinced that underlying inflation is on a downward trend. We may simply be seeing the temporary effect of recent declines in the price of oil, which seems just as likely to rise as to fall in the future.
Short version: I'm not going to vote for lower rates anytime in the near future.
In addition, Fed Chair Yellen made similar comments a few days ago.
There is no rate cut in the foreseeable future.
Productivity Inreases; Labor Costs Decrease
From the BLS:
This number was higher than expected. And while the 2006 number was slightly less than the 2005 number, it was not off by much. Higher productivity helps to remove inflationary pressure in the economy.
In addition:
This is very good news on the inflation front.
I should add, I don't think this news is enough to push the Fed to lower rates. Historically, rates are still low and just yesterday a Fed President stated inflation was still too high. However, these numbers help to remove any possibility of a rate increase in the near future as well.
In the fourth quarter, productivity increased 2.4 percent in the business sector and 3.0 percent in the nonfarm business sector. In both sectors, the fourth-quarter productivity increases reflected faster growth in output than in hours worked. When the annual averages for 2006 were compared with annual averages for 2005, productivity rose 2.2 percent in the business sector and 2.1 percent in nonfarm businesses--slightly less than the 2.3-percent gains in both sectors from 2004 to 2005.
This number was higher than expected. And while the 2006 number was slightly less than the 2005 number, it was not off by much. Higher productivity helps to remove inflationary pressure in the economy.
In addition:
Unit labor costs, which relate hourly compensation to output per hour, increased 1.7 percent in the fourth quarter and 3.3 percent in the third quarter, after falling 2.5 percent in the second quarter of 2006.
This is very good news on the inflation front.
I should add, I don't think this news is enough to push the Fed to lower rates. Historically, rates are still low and just yesterday a Fed President stated inflation was still too high. However, these numbers help to remove any possibility of a rate increase in the near future as well.
Fed President Yellen Warns On Inflation
From Reuters:
For the past 3-4 months, the Fed has been very consistent in their public statements on inflation. Every Fed president making a speech that deals with the Fed's inflation policy has had a similar statement. Inflation is still a bit above the Fed's comfort zone.
Can we stop talking about a rate cut now?
Fed speakers were out in force for the first time since voting on Jan. 31 to leave benchmark U.S. interest rates unchanged at 5.25 percent, as the traditional "cone of silence" after Fed policy-setting meetings was lifted.
Chairman Ben Bernanke focused on income inequality in Omaha, Nebraska, while 2007 Federal Open Market Committee voter Michael Moskow offered prescriptions for revitalizing the Chicago economy.
That left San Francisco Fed President Janet Yellen to deliver the policy message du jour at an event in Los Angeles.
Inflation "is a little higher than I would like it to be; I wouldb like inflation to come down," Yellen said in a question-and-answer session after a speech to the Asia Society of Southern California.
For the past 3-4 months, the Fed has been very consistent in their public statements on inflation. Every Fed president making a speech that deals with the Fed's inflation policy has had a similar statement. Inflation is still a bit above the Fed's comfort zone.
Can we stop talking about a rate cut now?
Tuesday, February 6, 2007
How's the Dollar Doing?
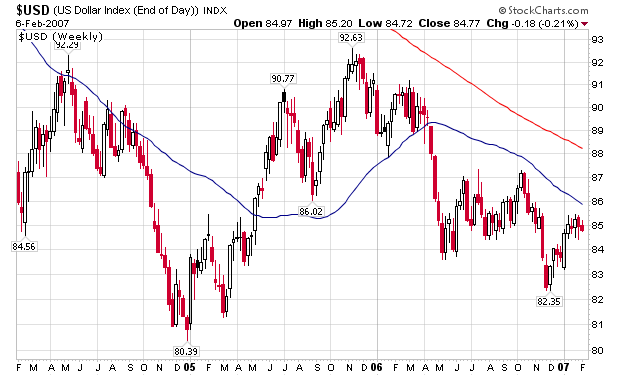
So -- how is the US dollar doing? Here's a longer chart from Stockcharts.com
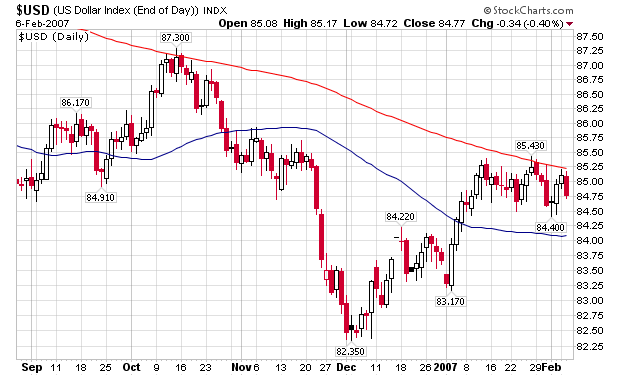
Starting in December last year, the dollar rallied from 82.35 to a bit over 85 -- a bit over three percent. But this rally occurred during a downtrend that started in early April 2006. There was an initial bear market rally from this downtrend that started in May. And while the December rally has broken through some resistance levels, the dollar is now trading in a range:
The dollar hasn't been able to break through to the up-side, even after a really good initial 4th Quarter GDP number of 3.5%. That indicates that traders are just not happy with the overall US economy -- at least not enough to bid up the US currency.
America’s Workers Need the Employee Free Choice Act
If your employer tries to cut your health care and pension by 98 percent, what do you do?
As a rule, not much.
Unless you’re in a union.
When 2,800 workers at the Harley-Davidson plant in York, Pa., were faced with that appalling ultimatum last week, the members of Machinists Local 175 knew they didn’t have to keep their mouths closed and swallow whatever the employer dictated. As union members, they spoke with their feet and now are walking the picket line. The company closed the plant after the last shift Friday.
Analysts disagree on the cost of the strike for Harley. One predicts the walkout could cost $11 million a day; another estimates $3 million per day. The York plant assembles the most profitable Harley-Davidson models. Other plants in the Milwaukee area and Kansas City make parts for assembly in York.
But let’s face it. Most workers aren’t in unions. In fact, the percentage of U.S. workers in unions declined last year, from 12.5 percent in 2005 to 12 percent in 2006. Yet some 60 million workers say they would join a union if they could.
So why don’t they? The primary reason is that our nation’s labor laws are outdated and so full of holes some employers get away with illegal actions like firing workers who express an interest in joining unions. U.S. labor laws, which date back to the 1930s, are skewed in favor of corporate giants who spend big bucks to harass and intimidate workers. And their techniques work—after all, how many people want to lose their jobs? (Although, as I noted, it’s illegal to fire workers for forming unions, management does it anyway, counting on the fact that it often takes years for a worker’s appeal to wind its way through the regional and national labor boards and even the courts.)
Workers represented by unions earn, on average, 30 percent more than nonunion workers: $833 in median earnings a week compared with $642. Some 80 percent of union members have employer-provided health insurance, compared with 49 percent of nonunion workers.
And as for those pensions, 68 percent of union members have guaranteed (defined-benefit) pensions—and only 14 percent of nonunion workers.
I noted here last week how the nation’s middle class—and increasingly, professional and technical workers—worry about their economic future as jobs become less stable or more difficult to attain and the quality of work life slides downhill. A growing number of professionals find their middle-class life threatened by economic forces that, without a union voice at work, they can’t control.
Yet when they try to form unions, the deck is stacked against them. Why is Harley- Davidson willing to lose millions of dollars in profits instead of trying to negotiate a contract that doesn’t decimate pension and health benefits?
AFL-CIO Organizing Director Stewart Acuff puts it this way:
The last time legislation to change U.S. labor laws was introduced was in the late 1970s, and it didn’t get very far.
We have a list of the House co-sponsors here. Check it to see if your lawmakers have signed on. E-mail them and ask them to support the bill, H.R. 800.
The Employee Free Choice Act isn’t just about unions. It’s about raising the standard of living for all of us in this nation. By leveling the playing field for workers seeking to form unions, the Employee Free Choice Act will improve the wages, working conditions and job security for workers who want to sign on. By ensuring that workers who want to join unions don’t experience employer harassment, the Employee Free Choice Act can replicate the experience of workers like Asela Espiritu, a registered nurse at Kaiser Permanente who didn’t have to endure harassment and intimidation to win a voice on the job through her union.
Espiritu works at the Kaiser Permanente Medical Center-Orange County in Anaheim, Calif., which was the only hospital—out of Kaiser’s 13 hospitals in Southern California—in which the workers didn’t have a union.
She and her co-workers formed a union in 2000 with United Nurses Associations of California/Union of Health Care Professionals-AFSCME at Kaiser under their company’s national neutrality and majority sign-up agreement. Requiring employers to follow a code of conduct in union campaigns and allowing more workers to use the majority sign-up process are both part of the Employee Free Choice Act.
The employees formed a union quickly—three months after they had started their organizing effort. Under the current National Labor Relations Board process, it can literally take years for workers who want to join a union to do so. Says Espiritu:
As a rule, not much.
Unless you’re in a union.
When 2,800 workers at the Harley-Davidson plant in York, Pa., were faced with that appalling ultimatum last week, the members of Machinists Local 175 knew they didn’t have to keep their mouths closed and swallow whatever the employer dictated. As union members, they spoke with their feet and now are walking the picket line. The company closed the plant after the last shift Friday.
Analysts disagree on the cost of the strike for Harley. One predicts the walkout could cost $11 million a day; another estimates $3 million per day. The York plant assembles the most profitable Harley-Davidson models. Other plants in the Milwaukee area and Kansas City make parts for assembly in York.
But let’s face it. Most workers aren’t in unions. In fact, the percentage of U.S. workers in unions declined last year, from 12.5 percent in 2005 to 12 percent in 2006. Yet some 60 million workers say they would join a union if they could.
So why don’t they? The primary reason is that our nation’s labor laws are outdated and so full of holes some employers get away with illegal actions like firing workers who express an interest in joining unions. U.S. labor laws, which date back to the 1930s, are skewed in favor of corporate giants who spend big bucks to harass and intimidate workers. And their techniques work—after all, how many people want to lose their jobs? (Although, as I noted, it’s illegal to fire workers for forming unions, management does it anyway, counting on the fact that it often takes years for a worker’s appeal to wind its way through the regional and national labor boards and even the courts.)
Workers represented by unions earn, on average, 30 percent more than nonunion workers: $833 in median earnings a week compared with $642. Some 80 percent of union members have employer-provided health insurance, compared with 49 percent of nonunion workers.
And as for those pensions, 68 percent of union members have guaranteed (defined-benefit) pensions—and only 14 percent of nonunion workers.
I noted here last week how the nation’s middle class—and increasingly, professional and technical workers—worry about their economic future as jobs become less stable or more difficult to attain and the quality of work life slides downhill. A growing number of professionals find their middle-class life threatened by economic forces that, without a union voice at work, they can’t control.
Yet when they try to form unions, the deck is stacked against them. Why is Harley- Davidson willing to lose millions of dollars in profits instead of trying to negotiate a contract that doesn’t decimate pension and health benefits?
AFL-CIO Organizing Director Stewart Acuff puts it this way:
[There is a] direct correlation between 25 years of stagnant, flat-lined wages and the assault on unions. Forty-seven million of us are without health care and 40 million with inadequate health care, [and] 20 percent more of us [live] in poverty now than when this decade started.A few years ago, we in the union movement began pushing for a bill called the Employee Free Choice Act that would level the playing field for workers and help rebuild America’s middle class and restore the freedom of workers to choose a union. It would restore workers’ freedom to choose a union by:
- Establishing stronger penalties for violation of employee rights when workers seek to form a union and during first-contract negotiations.
- Providing mediation and arbitration for first-contract disputes.
- Allowing employees to form unions by signing cards authorizing union representation.
The last time legislation to change U.S. labor laws was introduced was in the late 1970s, and it didn’t get very far.
We have a list of the House co-sponsors here. Check it to see if your lawmakers have signed on. E-mail them and ask them to support the bill, H.R. 800.
The Employee Free Choice Act isn’t just about unions. It’s about raising the standard of living for all of us in this nation. By leveling the playing field for workers seeking to form unions, the Employee Free Choice Act will improve the wages, working conditions and job security for workers who want to sign on. By ensuring that workers who want to join unions don’t experience employer harassment, the Employee Free Choice Act can replicate the experience of workers like Asela Espiritu, a registered nurse at Kaiser Permanente who didn’t have to endure harassment and intimidation to win a voice on the job through her union.
Espiritu works at the Kaiser Permanente Medical Center-Orange County in Anaheim, Calif., which was the only hospital—out of Kaiser’s 13 hospitals in Southern California—in which the workers didn’t have a union.
She and her co-workers formed a union in 2000 with United Nurses Associations of California/Union of Health Care Professionals-AFSCME at Kaiser under their company’s national neutrality and majority sign-up agreement. Requiring employers to follow a code of conduct in union campaigns and allowing more workers to use the majority sign-up process are both part of the Employee Free Choice Act.
The employees formed a union quickly—three months after they had started their organizing effort. Under the current National Labor Relations Board process, it can literally take years for workers who want to join a union to do so. Says Espiritu:
The 2000 negotiations gave us a lot of power and the voice to speak up on behalf of our patients. It’s not perfect, but we are on the road to solving the issues that affect the rank and file day in and day out. We have stability, and we have become a very desirable workplace.We stand a good chance to get the Employee Free Choice Act passed in the House. The harder part will come in the Senate. But we’re making progress getting co-sponsors there as well, and when we get a firm list, you’ll see it here.
Everyone wants to work here now. Nurses say, ‘I want to be a nurse at Kaiser.’ Our vacancy rate is at an all-time low. We are the highest-paid nurses in the county. It’s not just about the benefits either; it’s about the nurse-to-patient ratio we were able to get through Kaiser and the union working together.
New Kodak Printer Uses 50% Less Ink
From Reuters
If this product:
1.) Works as advertised
2.) Produces good quality documents
3.) and the ink prices remain at these levels
I will be a very happy man.
Anyone who has a link to a review of this product, please post it in the comments.
Eastman Kodak Co. (EK.N: Quote, Profile , Research) is introducing a line of desktop printers and low cost replacement inks on Tuesday, as the photography company takes on a market dominated by Hewlett-Packard (HPQ.N: Quote, Profile , Research).
For the camera maker, the long awaited launch of inkjet printing products kicks off a year in which it hopes to end the tough and expensive three year transformation that has seen the company shed tens of thousands of workers.
Kodak said it will in March start sales of 3 EasyShare All-in-One printers, ranging from $150 to $300, which will print, scan and copy document and photos. Black replacement ink cartridges will sell for about $10, and a color one for about $15, about 50 percent less than its rivals, Kodak said, adding that it will profit on sales of both printers and ink.
If this product:
1.) Works as advertised
2.) Produces good quality documents
3.) and the ink prices remain at these levels
I will be a very happy man.
Anyone who has a link to a review of this product, please post it in the comments.
Monday, February 5, 2007
Housing Bottom? I Don't Think So
From the WSJ
Let's ponder those figures for a minute.
The figure is at it's higher point .... EVER. That's not a good sign in any market.
The figure jumped .7% in a year. And the number had never been above 2% ....EVER.
So, the total number of vacant homes available for sale
1.) Has never been this high
2.) Has never even approached this level since the Census started tracking this figure
3.) Got to this level really quickly.
Housing bottom? Not with numbers like this.
Amid brightening hopes that the U.S. housing market is stabilizing, some economists are zeroing in on a piece of data that could augur badly for the consensus view: the homeowner vacancy rate.
That figure, an often-overlooked measure of how many homes for sale in the country are empty, has climbed to its highest level since the Census Bureau began tracking it four decades ago. Last week, the bureau said that in the final three months of 2006 there were about 2.1 million vacant homes for sale.
That brought the national homeowner vacancy rate to 2.7%, up from 2.0% a year earlier. Before 2006, the number had never risen above 2.0%. Like the housing economy more broadly, the measure varies by region: The South had a homeowner vacancy rate of 3.0%, the Midwest had a rate of 2.9%, the West had a 2.4% rate and the Northeast had a rate of 2.0%.
Let's ponder those figures for a minute.
The figure is at it's higher point .... EVER. That's not a good sign in any market.
The figure jumped .7% in a year. And the number had never been above 2% ....EVER.
So, the total number of vacant homes available for sale
1.) Has never been this high
2.) Has never even approached this level since the Census started tracking this figure
3.) Got to this level really quickly.
Housing bottom? Not with numbers like this.
ISM Increases A Bit
From the Institute For Supply Management
Let's look at the internals.
First, the overall index increased a few points. That doesn't hurt. But the increase was 2.3. In other words, it's a bit higher than last months survey.
But some of the internals aren't that solid. New orders decreased .2% and employment decrease 1.5%. New export orders decreased 6.5% and imports decreased 10%. These four numbers point to a slowdown, not an expansion. The backlog of orders increased 1%.
On the plus side, prices dropped 4.5%.
Here is the comments section from the report:
Note the highlighted comment from the retail industry -- sales continue to lag. That indicates several points. First, the Census Bureau's new retail model is probably a bit off (still) and rill be revised downward in the next report. Secondly, it indicates the downtrend has been in place a bit longer than the time period of the report (the use of the word "continue").
Also note the offshoring activity is specifically mentioned. That means we may have a further drop in employment over the next few months -- or at least weaker growth.
Again -- while the overall index was up, the internals were down.
"Non-manufacturing business activity increased for the 46th consecutive month in January," Nieves said. He added, "Business Activity increased at a faster rate in January than in December. New Orders and Employment increased at slower rates than in December. The Prices Index decreased 4.5 percentage points this month to 55.2 percent. Seven non-manufacturing industries reported increased activity in January. Members' comments in January are mostly positive concerning current business conditions. The overall indication in January is continued economic growth in the non-manufacturing sector at a faster pace than in December."
Let's look at the internals.
First, the overall index increased a few points. That doesn't hurt. But the increase was 2.3. In other words, it's a bit higher than last months survey.
But some of the internals aren't that solid. New orders decreased .2% and employment decrease 1.5%. New export orders decreased 6.5% and imports decreased 10%. These four numbers point to a slowdown, not an expansion. The backlog of orders increased 1%.
On the plus side, prices dropped 4.5%.
Here is the comments section from the report:
* "Revenue is better and costs are starting to come down — especially petroleum-related costs." (Agriculture, Forestry, Fishing & Hunting)
* "Activity continues to exceed plans." (Health Care & Social Assistance)
* "Our sales continue to lag behind expectations, causing plans for deeper cost-cutting measures." (Retail Trade)
* "2007 off to a brisk start!" (Utilities)
* "More requests for services, particularly offshoring." (Professional, Scientific & Technical Services)
Note the highlighted comment from the retail industry -- sales continue to lag. That indicates several points. First, the Census Bureau's new retail model is probably a bit off (still) and rill be revised downward in the next report. Secondly, it indicates the downtrend has been in place a bit longer than the time period of the report (the use of the word "continue").
Also note the offshoring activity is specifically mentioned. That means we may have a further drop in employment over the next few months -- or at least weaker growth.
Again -- while the overall index was up, the internals were down.
Manufacturing, ISM and GDP
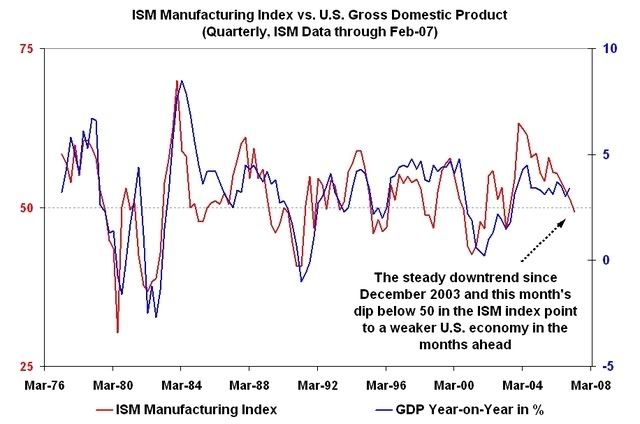
The following chart is from the Big Picture Blog:
The last rounds of Federal Reserve District manufacturing reports and Chicago ISM index were weak. They all pointed to a slowing in the manufacturing sector. This chart shows the trend has been in place for some time. As we enter February and a new round a Fed manufacturing district reports, it's important to pay attention to all of the reports various details.
Administration Urged to Challenge Japanese Currency Practices
Japan has become the latest scapegoat for protectionist rhetoric in Washington, as Congress urges Treasury Secretary Hank Paulson to use this week's meeting of G7 finance ministers to accuse Tokyo of fixing the exchange rate of the yen.
With the Democrats keen to make their mark on Capitol Hill after their victory in November's elections, Michigan Congressman John Dingell sent the President a letter last week - publicised on his website under the title, 'Dingell to Bush: You Just Don't Get It' - urging the White House to prosecute Japan for currency manipulation.
The yen has sunk to four-year lows against the dollar, and the 'big three' US carmakers, Ford, GM and Chrysler, have argued that Tokyo is 'manipulating' the currency markets by talking down the yen, making imported Japanese cars unfairly cheap.
Asian governments have been subsidizing their exports with a cheap currency for some time now. How else do you think the Chinese have amassed about $1 trillion in US dollars. At the same time, the US has provided various subsidies to various industries over the same time (just look at all of the special interest tax deductions in the US tax code).
I don't have an exact answer for this situation -- Asian government's intervention. But, expect more along these lines for now.
Link
Sunday, February 4, 2007
News of Hedge Fund Loss Hits Copper and Zinc Market
From the Economic Times
From Reuters
From the Chicago Tribune:
The commodities markets have become the high-tech stock market of the early 2000s -- a market ripe with speculation. The number of commodities advisers etc... has ballooned over the last 6 years. This is one of the reasons why the commodities markets have moved a great deal higher. There are also strong fundamental reasons for the increase, largely related to the growth of China and India.
One of the main problems with hedge funds is they fly below the investment radar and they are large enough to impact markets. Because there are no reporting requirements, stories of their problems quickly take-on rumor related reporting issues which is not good for anyone.
According to agency reports, the hedge fund Red Kite lost roughly 20% of its $1 bn fund since the beginning of the year up to January 24, ‘07.
Investors began to withdraw their money in panic causing the market to crash, as they feared a repeat of the Amaranth debacle. US-based hedge fund Amaranth Advisors had lost close to $6.6 bn in September ‘06 after poor bets on natural gas on Nymex.
From Reuters
Hedge fund Red Kite, which posted strong gains in 2006, has suffered a roughly 20 percent loss in the first days of January and is now trying to stall investors who want to pull money out, The Wall Street Journal reported.
Citing one unnamed investor who saw an unofficial estimate of the 2-year-old London-based hedge fund's performance in the first few weeks of January, the newspaper wrote that the fund lost about 20 percent for the year.
Red Kite specializes in metals trading.
The newspaper also said the fund had asked investors to approve an amendment that would require investors to give 45 days notice before pulling their money out. Previously they were able to get their money out at the end of each quarter after giving only 15 days notice.
From the Chicago Tribune:
"The fear is that it's an Amaranth," said Michael Guido, director of hedge-fund marketing at Societe Genearle SA in New York referring to Amaranth Advisers LLP, the hedge fund that lost $6.6 billion last year on natural-gas trades.
The commodities markets have become the high-tech stock market of the early 2000s -- a market ripe with speculation. The number of commodities advisers etc... has ballooned over the last 6 years. This is one of the reasons why the commodities markets have moved a great deal higher. There are also strong fundamental reasons for the increase, largely related to the growth of China and India.
One of the main problems with hedge funds is they fly below the investment radar and they are large enough to impact markets. Because there are no reporting requirements, stories of their problems quickly take-on rumor related reporting issues which is not good for anyone.