Sunday, December 31, 2006

Truck Shipments Down -- Big

In a potentially worrisome sign for the U.S. economy, domestic trucking shipments declined by almost 9 percent in November, marking the largest year-over-year decrease in almost six years, the industry's largest trade association said.

The American Trucking Associations said in a monthly report that its seasonally adjusted truck tonnage index stands at its lowest level since late 2003, following an 8.8 percent decline versus the same month a year ago. The index fell 3.6 percent from the prior month.

Because more than two-thirds of all manufactured and retail goods in the U.S. are carried by truck, the industry is an economic bellwether.


When 2/3 of retail shipments start to drop, you have to wonder about the health of the economy......

From the Houston Chronicle

What Can the Treasury Market Tell Us About Housing ?

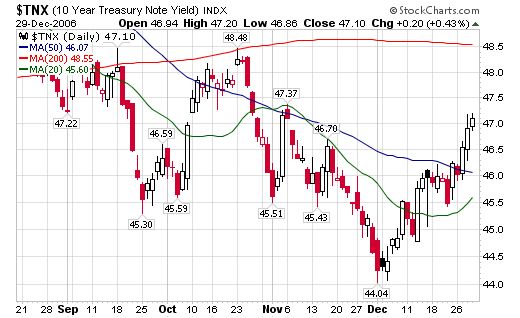
Below I wrote on the housing market because I think it is the wildest of wild cards going forward economically. Because mortgage rates are tied to the 10-year Treasury bond it's also important to take a look at the 10-year treasury market to see what direction interest rates may be headed in.

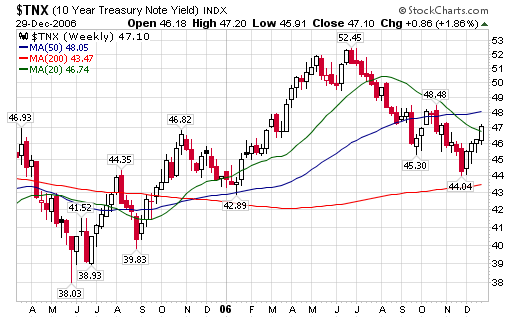
First, let's get a look at the bigger picture to see what the long-term trend is. Here's a weekly chart from stockcharts:

Photobucket - Video and Image Hosting

The chart is very straight-forward. The 10-year treasury had a year-long sell off starting in late June of 2005 until June of 2006. Interest rates rose from 3.98% to 5.25%, or about 125 basis points. Starting in early July of this year, interest rates reversed trending down to about 4.40%, or losing about 85 basis points.

So we have two trends:

1.) A year long Treasury market sell-off from June 2005 to July 2006.

2.) Starting in early July 2006 the Treasury market rallied, lowering interest rates 85 basis points.

We have one current mini-trend from 4.40% to about 4.70%. This is probably a year-end, profit-taking sell-off.

Let's look at a daily chart of the 10-year:

Photobucket - Video and Image Hosting

Note that in early October we had interest rates of 4.55% to 4.65%. We also had low rates for the last week of the month, but bonds sold off in mid-October to reach of high of 4.84%.

November 2006 saw a consolidation in the form of a triangle trading pattern, followed by a two-week decrease in rates to 4.40%.

So -- why this in-depth look at October and November? This is when we started to hear talk of housing "stabilizing". We also started to see some surprises in the new and existing home sales numbers.That means the interest rate during these months is very important for possible future housing market activity.

Simply eyeballing the chart, it looks as though the mean and median interest rate yield in October and November is between 4.55% to 4.65% (I could be wrong here, but remember I said "eyeballing"). That means that interest rates around this level are slightly stimulative to house buying in the current economic environment.

However, in October, rates of 4.84% were not constrictive. They weren't very stimulative either, but they didn't cause a contraction in the housing market either.

So, in the current market it looks as though interest rates below 4.84% help to at least stabilize the housing market.

Finally -- look at the long-term weekly chart again. Note that yields are at the upper-range of a downward sloping decline in prices. A solid break above say 4.75% to 4.80% could indicate the beginning of a new 10-year yield trend, with interest rates heading higher.

As with all technical analysis -- remember this is not a definitive reading of the chart because there is no definitive reading of the chart. All perception is relative and can change at a moments notice. In other words, the market will do everything in its power to humble you. And the market has a hell of a lot of power.

Saturday, December 30, 2006

Housing in 2007

I agree 110% with Calculated Risk, although I would add the following.

1.) Households have a record amount of total debt right now. It stands about 94% of GDP. I have not seen any number for when household debt is too much -- and I seriously doubt an exact number exists. However, I feel confident that we are near the amount when households have to start paring back on their overall debt levels.

In short -- demand will continue to drop as households move from a house acquisition stance to a "pay down all this debt stance." Declining demand = declining prices.

2.) CR makes an estimate of the amount of overbuilding in the housing market. I would add this information from Bloomberg:

In a Nov. 27 comment, Rosenberg notes that in addition to the record 4.3 million residential units for sale as of October, there were 1.95 million home completions, the 12th-highest month since 1979. Units under construction were through the roof as well. Rather than seeing supply dwindle and prices start to firm up in early 2007, Rosenberg says ``it could be a year before the reduction in starts begins to put a meaningful dent into the inventory backlog.''

John Mauldin, an investment adviser and frequent contributor to Investors Insight, a financial-data publisher, throws an extra log on the fire. According to Mauldin, even the current projection of housing sales may be overstated and thus the existing supply of homes greater than what is reported in the official data. The reason is that the Census Bureau, one of the Commerce Department's statistical agencies, fails to account for cancellations in home sales contracts. Cancellations ran as high as 40 percent for some major homebuilding firms last quarter.


The short version is it appears there is a ton of inventory about to hit the market at a time when there is already a ton of inventory. Excess supply = declining prices.

3.) We know there are between $700 billion and $1 trillion of exotic mortgages" that reset in 2007 (depending on which news story you read). Recent testimony before the Senate Banking Committee expressed concern about what the purchasers of these mortgages knew when they bought these mortgages. We also know these loans are already performing badly and their performance has worsened over the last three years:

Still, despite the adverse conditions, "I guess we are a bit surprised at how fast this has unraveled," said Zimmerman. While it's "not a secret that subprime collateral has performed pretty disastrously so far," he said, "I must say we were a bit surprised by the magnitude with which" the loans "deteriorated this year."

...

Comparing loans of similar age, 2006 loans are performing worse than 2005, which are worse than 2004. In fact, given where delinquencies are now, loans from 2006 are on track to be among the worst-performing ever, along with the 2000 to 2001 years, according to UBS research.


We already have a trend in place: A faster pace of delinquencies and a larger volume of delinquencies earlier in the life of the mortgage. There is no reason to expect this trend to do anything except get worse.

4.) Housing derivatives are out on the market in large numbers. I haven't seen any firm estimates about how these will play out in the coming year -- or if they will play out at all. This could be a nasty stealth story in 2007. For example, a hedge fund that is heavily invested in credit derivatives has the market go against them, or something similar.

So -- the home buyers have a record amount of debt, inventory stands to stay the same and exotic mortgages are already performing badly.

I was originally of the opinion that housing would be hit by an event that would seriously damage the market and move the country into recession. However, I now agree with CR's evaluation that US housing will be more akin to Chinese Water Torture, with a constant drip, drip, drip of bad news for some time.

Friday, December 29, 2006

Is the "Shrinking Market" A Reason for the Recent Rally

From CBS MarketWatch

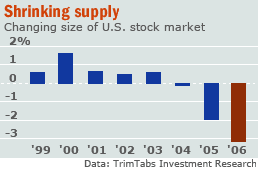
For some observers, this bull market can be partly explained by the fundamentals of supply and demand: The supply, or number of shares outstanding, has declined while demand, in the form of investor optimism, has stabilized and recently begun to increase.

"The more you shrink it, the more it has the potential to rise, all other things being equal," said Rod Smyth, chief investment strategist with Wachovia Securities. "If you're shrinking the market with buyouts, you're putting money back into people's pockets, which in a bull market they're likely to keep re-investing in the market."

More than $400 billion worth of new cash takeovers have been announced this year, while companies bought back in excess of $600 billion worth of their own stock, both records, according to estimates compiled by TrimTabs Investment Research, a Santa Rosa, Calif.-based firm that tracks market trends for institutions.


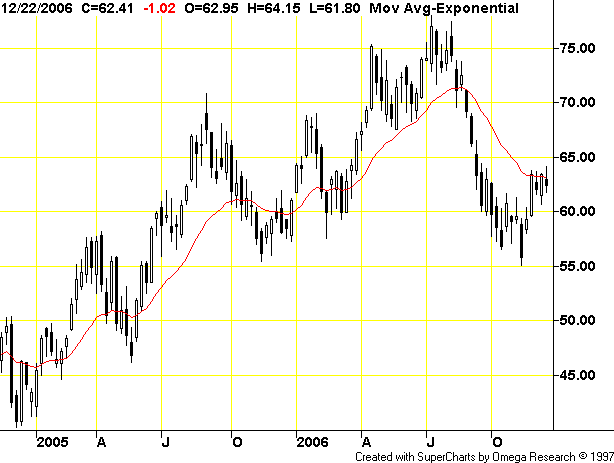
Simple supply and demand indicates a smaller supply leads to a higher price. Here's a chart of the last few years that shows this year in perspective:

Photobucket - Video and Image Hosting

I've been trying to figure out this rally for the last month or so. Stocks hit record highs during a strong expansion. Yet all of the macro-indicators indicate the economy is slowing. While the current evidence indicates a soft-landing is in place, there are still a few very large wild cards (oil, the dollar and housing) that could tip the US into recession. In short, the macro-numbers don't indicate we should be having stock market records.

The shrinking amount of shares plus the large amount of share buybacks has obvioiusly put a bid in the market.

Chicago PMI "Regains Footing"

From the Release

The Chicago Purchasing Managers reported the Chicago Business Barometer regained its footing to register some improvement.

- Production and New Orders regained strength while the rate of decline in Order Backlogs stabilized;

- Prices Paid were unchanged from November;

- Employment contraction continued as reported layoffs increased while hirings decreased


Let's look a bit deeper into the survey.

The index dropped from September through November, then rebounded in December. We'll have to wait until January to see if this number continues its upward movement.

There was a nice upward move in new orders. But these can always be canceled, so until they get into production this number may be a bit high. Also note this was the seasonally adjusted number. The unadjusted number increased .5 instead of 5.8.

The prices paid component increased slightly. This is not a good sign for the Federal Reserve policy going forward and takes some wind out of the "Fed has to lower rates in the new year" argument.

There were several comments about slowing construction and how that was having a negative impact. There was also a comment about how the lack of a federal budget was hurting overall production. This implies that when a budget resolution is passed, the Chicago PMI could see a 1-month jump. Finally, there was a comment about manufacturing being moved off-shore while financial work was remaining onshore.

Short version: A 1 month improvement that contains some future concerns (prices paid and employment) and will need at least 1-month of upward verification. In other words, this could be a trend reversal, but we need more information going forward.

Thursday, December 28, 2006

Worst May Not Be Over For Housing

From Bloomberg:

In a Nov. 27 comment, Rosenberg notes that in addition to the record 4.3 million residential units for sale as of October, there were 1.95 million home completions, the 12th-highest month since 1979. Units under construction were through the roof as well. Rather than seeing supply dwindle and prices start to firm up in early 2007, Rosenberg says ``it could be a year before the reduction in starts begins to put a meaningful dent into the inventory backlog.''

John Mauldin, an investment adviser and frequent contributor to Investors Insight, a financial-data publisher, throws an extra log on the fire. According to Mauldin, even the current projection of housing sales may be overstated and thus the existing supply of homes greater than what is reported in the official data. The reason is that the Census Bureau, one of the Commerce Department's statistical agencies, fails to account for cancellations in home sales contracts. Cancellations ran as high as 40 percent for some major homebuilding firms last quarter.


The high amount of inventory -- especially of existing homes which has been running over 7 months since July 2006 -- is very disconcerting. The existing homes market is much larger than the new homes market. A declining sales environment is going to make it harder to work off that inventory, which means price declines may not be over.

Richmond Fed Index Decreases

From the Richmond Fed

Tenth District manufacturing activity growth continued to edge down in December, while expectations for future factory activity rebounded strongly from the previous month. Most price indexes in the survey declined, with many indexes recording their lowest levels in over a year.

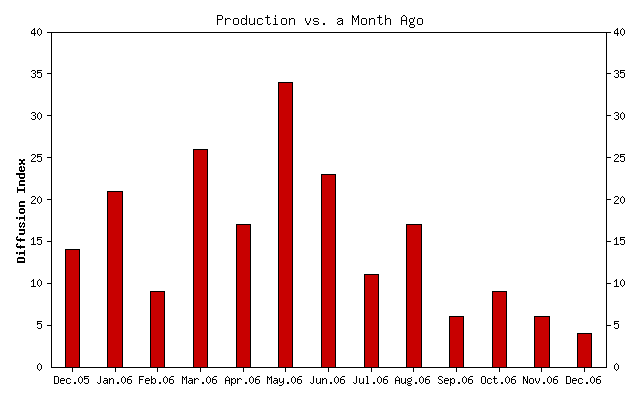
The net percentage of firms reporting month-over-month increases in production in December was 4, down from 6 in November and 9 in October (Tables 1 & 2, Chart). Production decelerated at both durable- and nondurable-goods-producing plants. The year-over-year production index also decreased from 35 to 25, a two-year low. On the other hand, the future production index rebounded from 15 to 27 after four straight months of decline. Although sample sizes make it difficult to draw firm conclusions about individual states, the data available suggest that production remained well above year-ago levels in all district states.


Here is a chart of the overall diffusion index:

Photobucket - Video and Image Hosting

This report is consistent with other Fed area manufacturing reports this month. The general consensus seems to be the current slowdown is temporary. Everyone is expecting orders to pick-up in six months. For example, 49% of respondents think production will increase in 6 months and 50% of respondents think shipments will increase in 6 months. On the inflation expectation front, only 29% of respondents think the prices they receive will increase in 6 months, although 44% think raw material's prices will increase in six months. This may partially explain why only 34% of respondents think they will have more employees in six months. Cutting back on hiring will allow manufacturers to maintain current margins.

Existing Home Sales Increase .6%

From the National Association of Realtors

Total existing-home sales – including single-family, townhomes, condominiums and co-ops – rose 0.6 percent to a seasonally adjusted annual rate of 6.28 million units in November from a level of 6.24 million in October, but were 10.7 percent below the 7.03 million-unit pace in November 2005.


The median price of home sales decreased $1,000 to $218,000 and is down 3.1% YOY.

The average price increased to $1,000 to $265,000 and is down 1.8% YOY.

Inventory dropped to a 7.3 month supply while the YOY increase in inventory is 30.6%.

The big reason for the increase was a 6% jump in the Northeast sales. This is the smallest region sales wise. All other regions were either up slightly (the West was up .8%) unchanged (the Midwest) or down (the South -1.8%).

So -- inventory is still very high and the reason for the increase was a jump in sales in the smallest real estate region in the country.

In other words, this report looks fair but still raises three concerns.

1.) There is still a ton of inventory on the market in a declining YOY sales environment. That means the inventory will be there awhile. So the possibility of a price drop still remains.

2.) Without the NE increase (which I am guessing is partly due to an unseasonably warm winter and is the smallest region in the country by size of sales), this report would have been negative. The next report will indicate how sustainable this increase is but I have some doubts.

3.) The YOY price change is dropping and the median price has dropped each month since July. In other words, prices have no stabilized, although the rate of the median decrease has slowed. So long as prices are dropping and have not stabilized for a few months, calling an absolute bottom in the housing market is probably premature.

Overall, however, this report will give plenty of ammunition to pundits calling the housing market decline over.

Weekly Unemployment +1000

From CBS MarketWatch

The number of U.S. workers filing new applications for state unemployment benefits rose slightly in the latest week while continuing jobless claims climbed to their highest level in almost a year, the Labor Department said Thursday. Initial jobless claims rose by 1,000 in the week ended Dec. 23 to 317,000, the Labor Department said in a report. But in a sign of slackening in the U.S. labor market, continuing claims, or people continuing to collect state unemployment benefits, rose by 16,000, to 2.53 million, in the week ended Dec. 16. It's the highest level since Jan. 28. The four-week average of continuing claims rose to its highest level since Feb. 18, to 2.51 million. The four-week average of initial claims fell by 10,250 to 315,750. This marked the lowest level since the week ended Nov. 11


Let's break this down into bite-sized economic morsels.

Initial jobless claims rose by 1,000 in the week ended Dec. 23 to 317,000, the Labor Department said in a report.

Not a big move. I would consider this statistical noise.

continuing claims, or people continuing to collect state unemployment benefits, rose by 16,000, to 2.53 million, in the week ended Dec. 16. It's the highest level since Jan. 28.

This is not good and shows signs of weakness. We need a bit more information about these people -- what industries employed them, what is their age etc.. -- but this raw number indicates the employment picture is probably weakening.

The four-week average of continuing claims rose to its highest level since Feb. 18, to 2.51 million.

Because the initial numbers jump around a bit, economists use a 4-week average to smooth out the jumps. However, this increase in the 4-week moving average confirms that employment prospects may not be as great as the low unemployment number indicates.

The four-week average of initial claims fell by 10,250 to 315,750. This marked the lowest level since the week ended Nov. 11

This is better news on the short-term front.

Let's look at the news release because there is some important information. Unfortunately it does not paste well into Blogger. So -- go to the page and notice that the number of states with fewer construction lay-offs comes in at 7. Earlier in December there was a rash of states with construction lay-offs. That seems to be slowing down for now which is a good economic sign. However, with a slowing housing market still, we may not be at the end of construction lay-offs.

Oil -- Still Rangebound

Photobucket - Video and Image Hosting

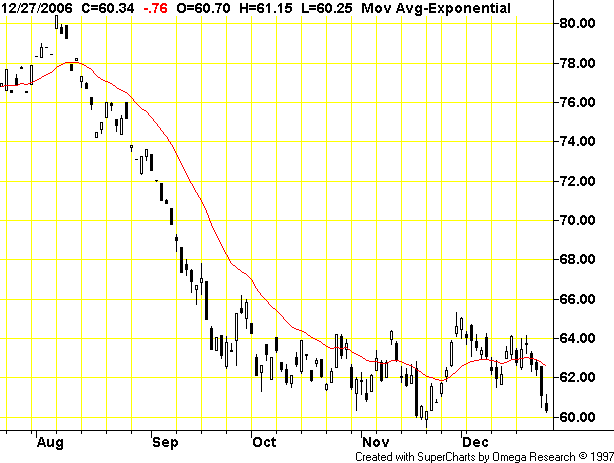
What does this chart tell us? Simple. Supply and demand are near equal. This is a great example of what W.D. Gann would call a distribution pattern. A distribution pattern occurs when a security is at the top of its respective chart or in the middle of a decline and the price starts trading sideways in a trading range. Traders who own the security start to distribute to to willing buyers over a period of time for whatever reason. Here's a monthly chart to show where oil is in the bigger picture.

Photobucket - Video and Image Hosting

Notice how oil has twice gravitated to the $60/bbl level in the last year -- once in late 2005 when it traded just below $60/bbl and once in the early part of 2006 when oil traded just above $60/bbl. Clearly this is an important price for the oil market.

Oil has clearly broken its long-term uptrend of the last year. Now the question becomes where will oil go from here? Pulling the price down is a mild US winter and slowing US economic growth which lowers overall oil demand. On the up side we still have China growing around 10%, India picking up economic steam and the OPEC production cut. My best guess (and yes it really is just an educated guess) is until the market gets a clearer signal either way it will remain in this range.

Wednesday, December 27, 2006

Declining Volume -- Correction or Seasonal?

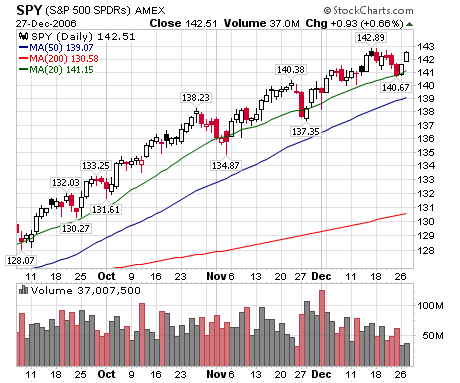
Photobucket - Video and Image Hosting

The SPY's volume has been declining since December 11. We've seen lower highs and lower lows.

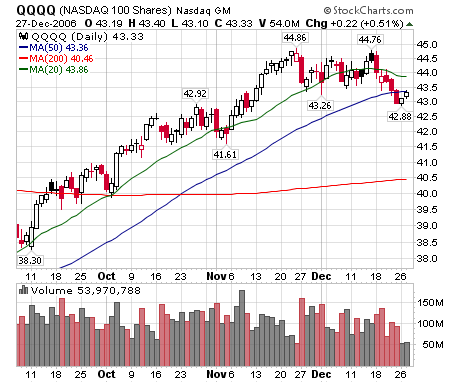
Photobucket - Video and Image Hosting

The QQQQ's volume has declined since December 18. Also note the QQQQs are bumping into the 20-day simple moving average.

The end of December is essentially a Wall Street holiday, so declining volume could simply be a sign of early vacations and nothing more. But declining volume can also be a sign a waning buying interest.

Food for thought.

New Home Sales Up 3.4%*

From Bloomberg:

Sales of new homes in the U.S. rose more than forecast last month as lower mortgage rates and more incentives helped builders reduce inventory.

The 3.4 percent increase to an annual pace of 1.047 million in November followed a 1.013 million rate the prior month that was faster than previously reported, the Commerce Department said today in Washington. The supply of unsold homes at the current sales pace fell to the lowest since May.

The figures add to evidence that the slowdown in construction may take less of toll on the economy early next year than it did last quarter. Even with the decline last month, the number of unsold homes remains near a record high, making it less likely homebuilding will strengthen outright, limiting economic growth, economists said.


A couple of points in no order of importance.

1.) The Census Bureau says the margin of error for this number is plus or minus 12.9%. That's a margin of guessing, not error.

2.) Number 1 being said, consider that October was revised higher:

Sales of new homes rose 3.5% in November to a seasonally adjusted annual rate of 1.047 million, the Commerce Department reported Wednesday. Sales are now down 15.3% in the past year. October's sales pace was revised to 1.013 million from an earlier-estimated 1.004 million. The median sales price of a new home rose to $251,700 from $243,800. Economists surveyed by MarketWatch were expecting sales to rise to a seasonally adjusted annual rate of 1.02 million from the previous 1.00 million


That's impressive. And frankly, I have to admit to being taken back by the upward revision.

Low interest rates are the primary reason for the increase:

Slower-than-expected growth in recent months has pushed Treasury yields lower, holding the rate on 30-year fixed mortgages to under 6.2 percent for the last month, compared with a high for the year of 6.8 percent reached in July. The Mortgage Bankers' Association's index of purchase applications are up almost 4 percent from a three-year low reached at the end of October.


3.) The median price increased. However, there is no mention of the effect of builder incentives on prices. I would like to see more information on the depth and breadth of builder incentives.

If this number holds, this is good news for the economy.

UAE Selling Dollars For Euros

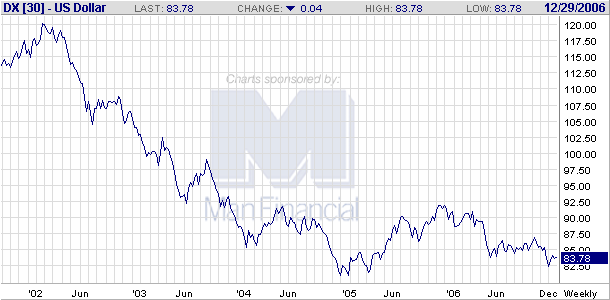
Take a good look at this 4-year chart for the dollar:

Photobucket - Video and Image Hosting

This is what happens when you run trade and fiscal deficits. Countries start to lose confidence in your currency. Over the last few years we have seen a large number of central banks announce they will diversify away from the dollar -- usually to add the euro to their reserves. OPEC, Russia, China, South Korea, Iran, and Venezueala are all in this camp. Now we can add the UAE to the "we like euros as much as the dollar" camp.

The United Arab Emirates will convert 8 percent of its foreign-exchange reserves to euros from dollars before September after the U.S. currency slumped this year, the country's central bank governor said.

The U.A.E. has started ``in a limited way'' to sell part of its dollar reserves, Sultan Bin Nasser al-Suwaidi said in an interview in Abu Dhabi on Dec. 24. ``We will accumulate euros each time the market appears to dip,'' as part of a plan to expand the country's holding of euros to 10 percent of the total from 2 percent today, he said.

The Gulf state is among oil producers including Iran, Venezuela and Indonesia, looking to shift their currency reserves into euros or sell their oil, which is currently priced in dollars, in the 12-nation currency. The total value of the U.A.E.'s current reserves is $24.9 billion, 98 percent in dollars and 2 percent in euros, al-Suwaidi said.


Standard economic thinking would argue the US trade deficit should lead to a dollar correction. The problem is when a large number of people start to sell dollars. Right now there is a giant international game of chicken going on -- no one wants to be the one who starts a dollar drop, but no one wants to see the value of their reserves decrease either. It's a most difficult game that can lead to sudden and painful currency moves.

Tuesday, December 26, 2006

Holiday Sales Increase 3%

From Bloomberg:

U.S. holiday retail sales rose a disappointing 3 percent from 2005 as a slowing housing market and higher energy costs cut into spending, MasterCard Advisors said.

The gain is less than the 5.2 percent increase last year and the smallest growth since the survey started in 2003, MasterCard Advisors said today in a statement. Electronics and luxury goods had the strongest sales, according to the company's SpendingPulse survey.

``Retailers are going to find that this was a pretty modest Christmas season,'' Britt Beemer, chairman of Charleston, South Carolina-based America's Research Group, said in an interview.


This report is not good news. Retailers make about 1/3 of their profits during the Christmas season. This also does not bode well for the coming year. Consumer spending comprises 70% of US GDP growth. If the consumer starts to spend less, we'll have a second negative hit to GDP growth -- the first being housing.

Richmond Fed Slows

From the Richmond Federal Reserve

In December, the seasonally adjusted manufacturing index—our broadest measure of manufacturing activity—decreased to -6 from November’s reading of 7. Among the index’s components, shipments lost ten points to -4, new orders fell fourteen points to -8 and the jobs index moved down fifteen points to -5.

Other indicators also suggested weaker activity. The capacity utilization index turned negative, losing twelve points to finish at -11 and the orders backlogs indicator shed five points to -16. Vendor delivery times edged down three points to -1, while our gauge for raw materials inventories was somewhat higher, gaining six points to 20. The finished goods inventories index, however, trimmed three points to 12.

Both raw materials and finished goods prices grew at a quicker pace in December. Looking ahead, respondents expected raw materials prices to rise faster over the next six months.


The overall index -- along with various individual components -- decreased at the end of 2004 and early 2005. In other words, this might be a year-end slowdown and nothing more. However, the overall economic environment was far different at the end of 2004. Over the last year we have had a slowing housing market, a record trade deficit and slowing (although fairly respectable) employment growth.

The three-month average of the new orders index, overall manufacturing activity and shipments has decreased for the last 6 months. This indicates the slowdown could be a natural situation where manufacturing customers made a large number of purchases six months ago and are now working off the inventory from those purchases. However -- as with the previous statement -- the overall economy situation right now is one of a general slowdown.

Fed watchers -- bear witness to the increased prices paid and prices charged numbers. These indicate the PPI from December may not be a fluke.

The Richmond Fed also released a services report today

According to the latest survey by the Federal Reserve Bank of Richmond, revenue growth in the broad service sector slowed in December. Retail sales contracted slightly in December, although sales results from the final weekend before Christmas are not included in this month's survey. Big-ticket sales led the decline in December, but the pace moderated from that of a month ago. Retail inventories fell for the first time in six months, though the contraction was mild. Shopper traffic also slipped, and retailers were less optimistic about sales expectations for the first half of 2007. In contrast, contacts at service-producing firms said revenues grew at a faster pace in December, and they continued to have a bright outlook for the next six months.


The fact that the last weekend before Christmas isn't included makes this survey very suspect in my opinion. Holiday sales have become more and more a last-minute activity over the last few years.

Travel Day

I'm traveling today. I'll try and post about the Richmond Fed when it comes out.

Also -- keep an eye on all three exchange traded funds -- the QQQQs, the SPYs and the DIAs. All closed on Friday in weak technical positions.

Sunday, December 24, 2006

The Coming Week

This will be a light trading week. The week between Christmas and New Years is typically a long holiday where traders only come in to work to catch-up on paperwork rather than actively trade.

However, the markets may be turning over right now. So a light trading week could mean technical problems for the market.

We have new home sales on Wednesday and Existing home sales on Thursday.

The Chicago Purchasing Manager's index comes out on Friday. This will be important especially in light of last week's weak Philadelphia number.

Saturday, December 23, 2006

Will The Real Inflation Rate Stand Up?

OK -- so where is inflation right now? Well, it depends on who you ask.

According to the BLS, it decreased last month.

The Consumer Price Index for All Urban Consumers (CPI-U) decreased 0.1 percent in November, before seasonal adjustment, the Bureau of Labor Statistics of the U.S. Department of Labor reported today. The November level of 201.5 (1982-84=100) was 2.0 percent higher than in November 2005.


But producer prices were much higher last month:

The Producer Price Index for Finished Goods advanced 2.0 percent in November, seasonally adjusted, the Bureau of Labor Statistics of the U.S. Department of Labor reported today. This gain followed declines of 1.6 percent in October and 1.3 percent in September. The index for finished goods other than foods and energy rose 1.3 percent in November compared with a 0.9-percent decrease in the previous month. At the earlier stages of processing, prices for intermediate goods moved up 0.7 percent after falling 1.1 percent in the prior month, and the crude goods index increased 15.7 percent following a 10.5-percent decline in October.


According to the Bureau of Economic Analysis, the GDP deflator increased in the third quarter. This is a quarter to quarter comparison, whereas the PPI and CPI are month to month.

The price index for gross domestic purchases, which measures prices paid by U.S. residents, increased 2.2 percent in the third quarter, 0.1 percentage point more than in the preliminary estimate; this index increased 4.0 percent in the second quarter. Excluding food and energy prices, the price index for gross domestic purchases increased 2.2 percent in the third quarter, compared with 2.9 percent in the second.


Then there is the personal consumption expenditure (PCE) released yesterday:

PCE prices -- The price index for PCE increased less than 0.1 percent in November, in contrast to a decrease of 0.2 percent in October. Prices, excluding food and energy, increased less than 0.1 percent, compared with an increase of 0.2 percent.


Finally, there is the Cleveland Fed's median CPI number

According to the Federal Reserve Bank of Cleveland, the median Consumer Price Index rose 0.2% (3.0% annualized rate) in November. The median CPI is a measure of core inflation calculated by the Federal Reserve Bank of Cleveland based on data released in the Bureau of Labor Statistics’ (BLS) monthly CPI report.


So -- all of these reports which are supposed to measure inflation all tell a different tale. The trick is to figure out which one is telling the truth, or which combination is telling the truth.

Right now I have no idea which one -- or which combination -- I like better. But, there are a lot of choices, aren't there?

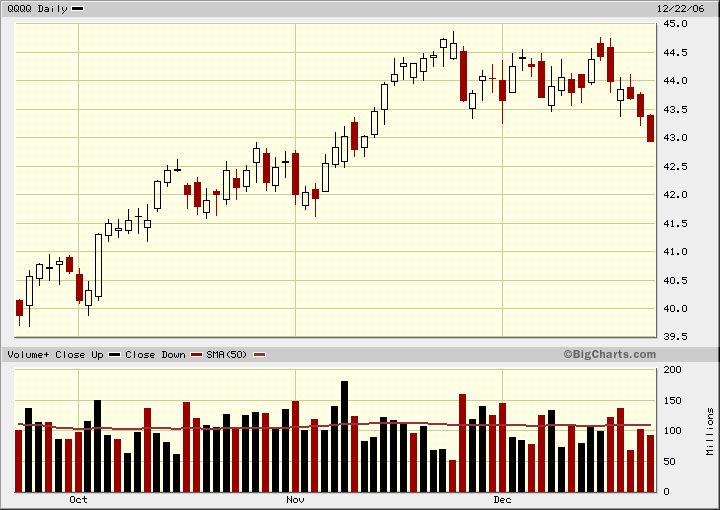
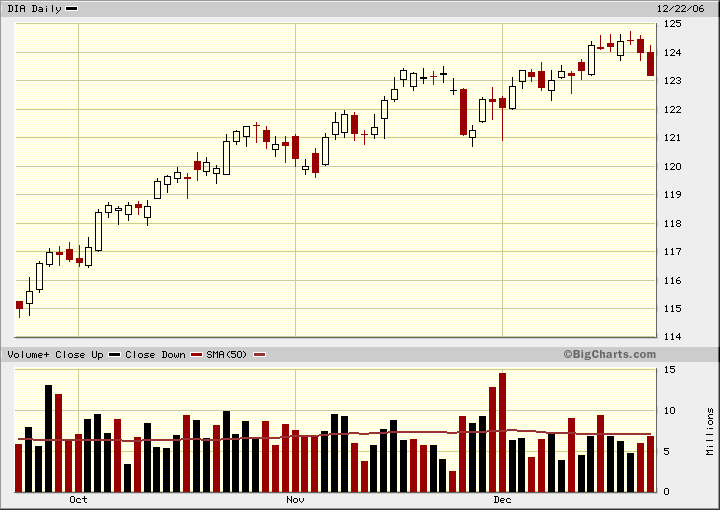
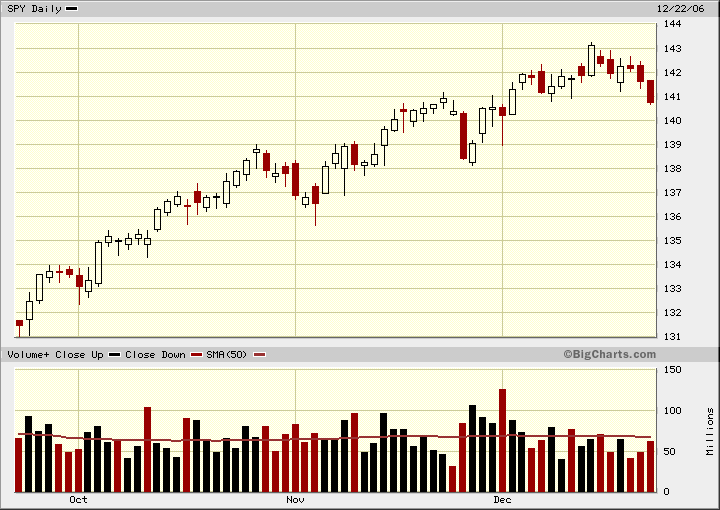
The Markets Aren't Looking Good

Photobucket - Video and Image Hosting

The QQQQs closed in a precarious position today. They are just above support right below $43. The sell-off was on less volume than a big sell-off would probably entail, but is was also a weak day in the markets overall.

Photobucket - Video and Image Hosting

The DIA's sold-off on increasing volume. That's not good.

Photobucket - Video and Image Hosting

The SPYs sold-off on increasing volume. More importantly, the SPYs have decreased the last three days on increasing volume. Not good.

Have Economists Forgotten About Saving?

The following is from a speech by Fed President Jeffrey Lacker yesterday.

In any event, the weakness in housing will continue to be a drag on overall economic activity into the first half of next year, with the effect gradually waning as the year progresses. But I seriously doubt it will be enough of a drag to tip the economy into recession. My doubts stem from the fact that residential investment accounts for 6 percent of GDP, while household consumption accounts for 70 percent, and the outlook for that spending looks quite strong right now. For the first three quarters of this year, consumer spending has increased at a healthy 3.4 percent annual rate, and it looks like the fourth quarter will see something similar. That growth in spending has been underpinned by a strong labor market and solid income growth. Labor markets are fairly tight, overall, as indicated by the 4.5 percent unemployment rate. Real disposable income increased at a strong rate in the third quarter, and there are signs that real wage gains are improving — wages and salaries, as measured by the employment cost index, increased at a 3.8 percent annual rate in the second and third quarters, the best two-quarter increase in almost five years.


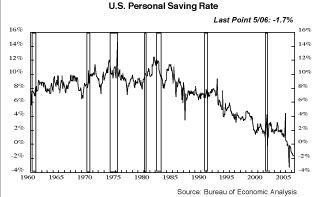
Here's the rub with that statement. It is typical of economists talking about the US economy. Because consumer spending accounts for 70% of GDP growth economists are always talking about consumer spending. But no one -- and I mean no one -- is ever talking about saving. More importantly, no one is talking about the fact that personal consumption expenditures come at a current cost of a negative savings rate. Here is a chart of the US savings rate.

Photobucket - Video and Image Hosting

This is bad. This is very bad. Every time I have brought this up in discussion with a more conservative economists, the standard refrain is "this calculation is wrong." Instead, they use household net worth from the Fed's Flow of Funds statement. But this figure has a ton of unrealized capital gains which are subject to market fluctuations. In addition, other studies conducted on the US savings rate confirm the US is indeed a poor savings country.

In Bernanke's world, it's all OK because there is a global savings glut. The problem with this theory is 1.) it does nothing to address the current US problem of negative savings, and 2.) the "global savings glut" is caused by a decrease in Asian investment at the beginning of the 21st century. When Asian economies return to their standard level of investment, the "global savings glut" will go away.

In other words, the lack of US savings is a huge issue that the US should be addressing but isn't.

Toyota to Surpass GM As World's Biggest Carmaker?

From Bloomberg:

Toyota Motor Corp. expects demand for its fuel-efficient cars in the U.S., Asia and Europe to raise vehicle sales 6 percent in 2007, likely ending General Motors Corp.'s 81-year reign as the world's largest carmaker.

Toyota and its affiliates will probably sell 9.34 million vehicles next year, up from 8.8 million in 2006, the company said in a statement in Nagoya, Japan. Production next year will rise 4 percent to 9.42 million vehicles.

President Katsuaki Watanabe opened a $1.28 billion pickup factory in Texas last month and will start production in Russia next year. GM plans to shut 12 factories in North America by 2008 in response to declining demand for trucks and sport-utility vehicles while Ford Motor Co. is eliminating 38,000 jobs.

``Toyota has all the factors necessary to become the world's No. 1 automaker,'' said Atsushi Osa, who helps oversee $1.4 billion at Sumitomo Mitsui Asset Management Co. in Tokyo. ``It has expansion plans, the right products and their vehicles are popular.''


One of these companies has worked at building a brand built on quality and fuel efficiency. (Although Toyota has had problems this year, the press reports have stated they are working to deal with the issue.) One of these companies has relied on SUV's for its profit margin for the last 3-4 years. Guess which one is doing better?

Holiday's Approaching

With the holiday's approaching, posting will drop a bit. I will be traveling Saturday afternoon to the the bond parents. I will be returning on the 26th.

Thursday, December 21, 2006

Is NASDAQ Topping?

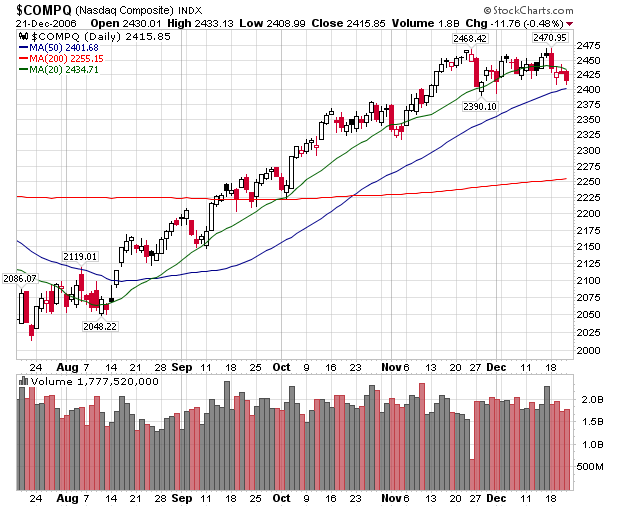
As we get closer to the year end, it's time to look at charts from a standpoint of what happened in 2006 and what may happen in 2007. Fund managers have a new year in which they have to at least beat the averages' gains and hopefully do better (although most don't). When looking at the NASDAQ chart (courtesy of Stock Charts), notice it may be forming a double top. The first top occurred at 2468 and the second at 2470. In addition, it's closed below the 20 day simple moving average four days in a row. The last time the NASDAQ traded below the 20-day SMA was in early November. But the market was in a much stronger up-trend then. Now the market is trading sideways. The 20 day SMA is now trending down. Volume has also been a tad light. Finally, the NASDAQ has had a great run from early August of this year. All things must come to and end.

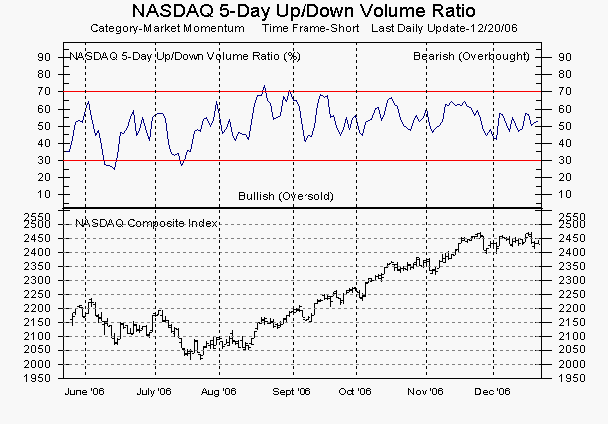
Below the NASDAQ chart is a chart from Marketguage that shows the 5-day up/down volume ratio. The indicator is neutral right now.

Just remember, technical analysis is not a science. We're looking at probabilities here.

Photobucket - Video and Image Hosting

Photobucket - Video and Image Hosting

Philly Fed Is Mixed

From the Philadelphia Federal Reserve:

Overall economic conditions in the region’s manufacturing sector declined slightly in December, according to firms polled for this month’s Business Outlook Survey. Indicators for general activity, new orders, and unfilled orders were negative in December. Indicators for shipments and employment, however, were positive and stronger than last month. Although firms again reported higher prices for their own manufactured goods, the survey’s prices paid indicator continues to suggest diminishing cost pressures. The region’s manufacturing executives were less optimistic about future activity; most future indicators decreased for the second month in a row.


Here's a link to a table with the results. It doesn't translate well to the Blogger format.

Here are some interesting points from the table listed above:

1.) 6 months from now, 35% of respondents think new orders will be increasing. Currently only 26% think new orders will increase. 25% see an increase in inventories in 6 months, whereas right now only 16% see an increase in inventories. 37% see an increase in employment in 6 months, whereas only 27% see an increase in employment right now. It looks like people are thinking any slowdown is temporary.

2.) Here's a big piece of information. 53% see an increase in prices paid in six months whereas only 33% see an increase this month. This is something the Fed will probably be interested in.

Final 3Q GDP Up 2%

From the BEA:

Real gross domestic product -- the output of goods and services produced by labor and property located in the United States -- increased at an annual rate of 2.0 percent in the third quarter of 2006, according to final estimates released by the Bureau of Economic Analysis. In the second quarter, real GDP increased 2.6 percent.

The increase in real GDP in the third quarter primarily reflected positive contributions from personal consumption expenditures (PCE), exports, equipment and software, nonresidential structures, and state and local government spending that were partly offset by a negative contribution from residential fixed investment. Imports, which are a subtraction in the calculation of GDP, increased.

The deceleration in real GDP growth in the third quarter primarily reflected an acceleration in imports, a larger decrease in residential fixed investment, and decelerations in PCE for services, in private inventory investment, and in state and local government spending that were partly offset by upturns in equipment and software, in PCE for durable goods, and in federal government spending.

Final sales of computers contributed 0.07 percentage point to the third-quarter growth in real GDP after contributing 0.04 percentage point to the second-quarter growth. Motor vehicle output contributed 0.76 percentage point to the third-quarter growth in real GDP after subtracting 0.31 percentage point from the second-quarter growth.


Let's break these numbers down a bit.

The most glaring number in the report is the decrease in residential investment, which decreased 18.7%. That decrease wiped out gains in a host of other categories. In other words, the housing slowdown is a big drag on economic growth. It took off 1.2 from the total. There's been a fair amount of talk about how business construction will offset residential construction. The problem with this theory is business construction was $426 billion in current dollars while the residential market was $750 billion in current dollars. In other words, business construction is 56.5% of the residential market. This means business construction will have to increase at a really fast rate to take-up the residential building slack. In addition, business construction has increased faster over the last two quarters than in previous quarters. We'll have to wait and see if business maintains its current higher pace of construction, or pulls in the reigns as the economy slows.

Also related to housing, consumer purchases of furniture and other household durable contributed less to GDP growth than previous quarters. More housing problems are bleeding through to the larger economy.

Exports increased 6.8% and imports increased 5.6%. For those of you watching the current account deficit, this is good news. But -- remember that exports lag imports by about $58 billion in the last month. This means that a 1.2% overall increase will take a long time to actually close the import gap.

The bottom line is the economy slowed, and housing was a big drag on growth. Going forward this should raise concerns if the housing numbers continue to point to a slowdown.

Wednesday, December 20, 2006

How Bullish or Bearish is Business Right Now?

I just got done reading the following post from Morgan Stanley and thought it would be a good time to see how business if feeling about the economy.

Business conditions continued to deteriorate, remaining below 50% for the seventh consecutive month, but the deterioration isn’t intensifying. The Morgan Stanley Business Conditions Index (MSBCI) increased by four points in early December to 44%, retracing some of November’s decline. The less-volatile three-month moving average edged up two points to 43%, the highest level since August. At 43%, the fourth quarter average only stands one point above the third quarter average, meaning analysts are essentially just as pessimistic in the current quarter as they were last quarter.

Last month we noted that our bullish forecasts were out of sync with gloomy analyst reports, although we admitted that analysts were more accurate on conditions in the 3rd quarter than we were. Earlier this week, given incoming data, we sharply lowered our near-term GDP forecast, with the three quarter growth rate ending in 1Q07 averaging only 2%. However, there are also glimmers of improvement: A positive employment report and a blow-out retail sales report have led us to revise our current quarter GDP tracking estimate up 0.9 pp to 2.5%. Furthermore, advance bookings were higher in the Empire State manufacturing survey. Score: Analysts 1: Economists 1? The jury is still out!


So, according to the Morgan Stanley index things are somewhere between OK and bad, but they aren't getting any worse. Given that GDP growth has slowed this year, that's to be expected. A slower growth environment puts business on the defensive, forcing them "pull in their wings" as it were.

The above report jibes with the latest ISM manufacturing survey:

Economic activity in the manufacturing sector failed to grow in November for the first time following 41 consecutive months of growth, while the overall economy grew for the 61st consecutive month, say the nation's supply executives in the latest Manufacturing ISM Report On Business®.

WHAT RESPONDENTS ARE SAYING ...

* "Sales have leveled off, but we will have a record year. Second [year] in a row." (Computer & Electronic Products)
* "Business has softened in the past 60 days. Down about 20 percent." (Fabricated Metal Products)
* "Housing market slowed down." (Furniture & Related Products)
* "We have hit another slow period in receiving new contracts. Quoting activity is fair." (Machinery)
* "We are still trying to hire new maintenance techs, but find it difficult to find qualified people." (Nonmetallic Mineral Products)


So, manufacturing registered its first decline in 41 months. Nothing lasts forever. We'll have to wait and see if this trend continues or whether this is statistical noise on the radar screen. While I don't know how the ISM chooses quotes for the "What respondents are saying" section, I would think they are choosing one quote that would be representative of a number of responses. If that is the case, pay particular attention to the housing comment. Also not the time frame mentioned --
"in the last 60 days". That means it could get worse as housing continues to contract.

However, the non-manufacturing sector showed an increase in activity:

Business activity in the non-manufacturing sector increased at a faster rate in November 2006, say the nation's purchasing and supply executives in the latest Non-Manufacturing ISM Report On Business®.

WHAT RESPONDENTS ARE SAYING ...

* "Business still strong." (Utilities)
* "New job orders and new and repeat job awards have increased in October and November." (Professional, Scientific & Technical Services)
* "Sustained lower energy costs driving customer commitment and increasing operational objectives." (Accommodation & Food Services)
* "Generally improving outlook about the economy." (Educational Services)
* "The market has not changed in the past month. Sales are slow and order cancellations are still high. The forecast for the next 30 - 60 days is the same." (Construction)


It's important to note that Professional Services, Technical employees and education services have all shown strong employment gains over the last year or more. This indicates these industries are doing well in this expansion. However, the comments above indicate they are still doing well, which may help to ameliorate the negative impact from a drop in manufacturing.

So the picture looks mixed at this point with manufacturing possibly moving into a slowdown and non-manufacturing still doing well.

Yield Curve Still Inverted

As my screen name implies, I use to be involved with the bond market. I was a bond broker with several regional firms before I went to law school. I like to joke that I have mortgaged my soul twice -- an all to common experience in the current economy.

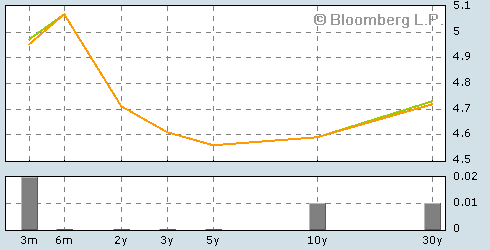
Below is a chart of today's yield curve from about 12:15 EST. The chart is from Bloomberg.

Photobucket - Video and Image Hosting

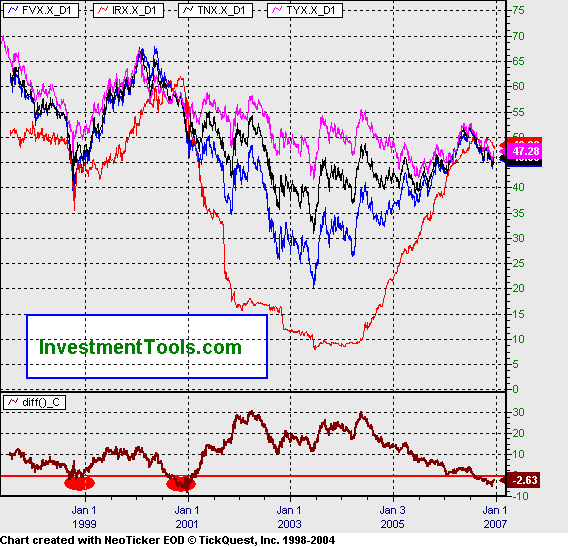
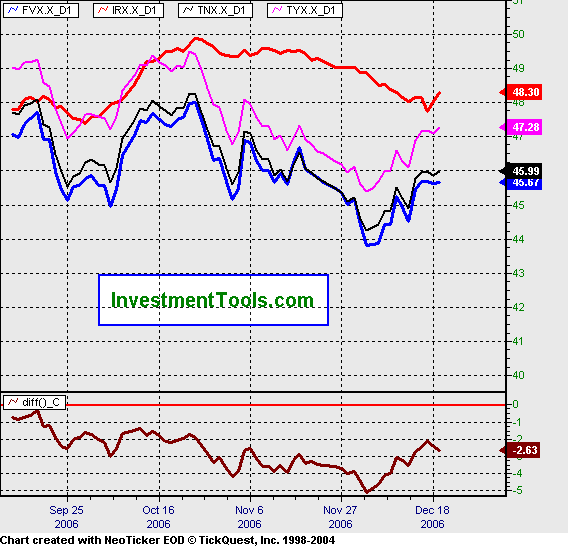
That's a simple inversion -- meaning long-term rates are lower than short-term rates. This situation has gone on for a fairly-long time. Here is a chart from Investtools.com that shows various interest rates. Pay attention to the red line at the bottom half of the chart. It shows the inversion has gone on for a few months.

Photobucket - Video and Image Hosting

Less importantly -- but still noteworthy -- the yield difference between the 5-year Treasury and the Fed Funds rate. This has been negative for a few months as well.

Photobucket - Video and Image Hosting

Long rates are supposed to be higher than short rates. The reason is pretty simple: there are more things that can go wrong in the long-run than the short-run. Therefore, lenders demand a higher interest rate to compensate them for the increased risk of lending for a long time.

When long-term rates are lower than short-term rates, it usually means traders have purchased more long-term debt than short-term debt. This can mean two things. First, they think interest rates are coming down in the future. This will make higher--yielding debt a better investment because it yields more. It can also mean that traders have lowered inflation expectations. Remember the real rate of return on a bond is the interest rate minus the inflation rate. Both a lower inflation rate and lowered interest rats are signs of an economic slowdown. This is why the inverted yield curve can mean a recession is approaching.

As usual, there have been a fair number of people who are arguing this time is different and the predictive power of the inverted yield curve is somehow diminished by this expansion. We'll have to wait and see if that plays out or not.

Pretzel Logic, Hold the Salt

This is actually Tula Connell's post. We're experiencing some behind-the-scenes technical difficulty with passwords and such right now, so I'm posting this for Tula. -- Bonddad


Pretzel Logic. Hold the Salt.

Let’s see. U.S. Treasury Secretary Henry Paulson went to China last week to get the Chinese government to voluntarily lower the value of its currency, the yuan.

He failed. But to save face for the United States, China said it will buy four Westinghouse nuclear reactors—never mind worries that this nation is selling its competitive advantage one industry at a time.

At the signing ceremony for the deal, U.S. Energy Secretary Samuel W. Bodman had this to say:

The Chinese were very demanding.

Too bad the same can’t be said of the Bush administration when it comes to creating economic policies that will strengthen the United States. (Bonddad has done a great job detailing Bush’s economic failures here and here, where he points out Bush’s job growth record is the worst in 40 years.)

So, while China keeps its yuan undervalued by as much as 40 percent, this nation runs up a $202 billion trade deficit with China in 2005—and Bush’s solution is to send his cabinet to China to ask its government to see things our way, rather than take any concrete action.

Meanwhile, profit-making corporations like Goodyear are adding to our economic imbalance by sending family-supporting U.S. jobs overseas—to China.

Since October, nearly 16,000 workers have been on strike at Goodyear plants across the nation. They went out on the picket line after Goodyear announced plans to close its manufacturing plant in Tyler, Texas, affecting 1,110 workers. The Tyler plant is the company’s third U.S. plant to be shut down in four years. At the same time, the giant tire maker is increasing imports from factories in countries such as China that pay workers 42 cents an hour. In the past two years, Goodyear has invested $18 million in a plant in China and is increasing production there to 5.3 million tires a year.

While Goodyear is demanding a 50 percent wage cut for new hires, CEO Robert Keegan last year pocketed salary and stock options worth more than $7 million. Goodyear also wants to wash its hands of its retiree health care obligations by moving them to a trust fund from which the company would walk away after it was established—without sufficiently funding it to make it viable for the long term.

While these actions may mean short-term profits for Goodyear, in the long run, they represent more erosion of U.S. economic strength. Simply put, if all workers are reduced to working for Wal-Mart wages, who in the United States is going to buy the products companies like Goodyear make?

As Matt Stoller writes on MyDD (hat tip to Jordan Barab at Firedoglake):

The problem is that Goodyear just gave multimillion dollar bonuses to executives and broke a good-faith agreement with its labor force. The CEO of the company, Robert Keegan…is a father of two, a Bush donor, and a strong supporter of the Ohio Republican Party. He's asking middle class workers to sacrifice their livelihood so he can lie to them and get rich, a form of economic violence that should not go unnoted.

Wall Street was hot to fund Goodyear’s strike-breaking efforts. Within a day, the Street snapped up $1 billion in unsecured note purchases to fund the company through the strike, betting that Goodyear will outlast the striking workers and pave the way for other corporations to rid themselves of retiree health care in upcoming bargaining. Workers in family-supporting, middle-class jobs have a lot at stake in 2007.

Next year, contracts are up at the Big Three automakers, major coal companies, the Las Vegas hotel industry and General Electric. Meanwhile, public employees in a number of states—Connecticut, Hawaii, New Jersey, New York, Pennsylvania, Washington and Wisconsin—will be negotiating for the first time under new Governmental Accounting Standards Board rules that require them to put retiree health care costs in their budgets.

Outsourcing isn’t just a problem for manufacturing workers. Many U.S. jobs are at risk of being shipped overseas—with some estimates saying up to 14 million middle-class U.S. jobs are vulnerable to offshoring.

Rather than create incentives for corporations to keep good jobs in this country, or address skyrocketing health care costs that are eroding corporate profits, Bush supports policies that subsidize job destruction with taxpayer dollars, including new tax breaks for foreign production and more government contracts and subsidies for companies
that destroy American jobs. Providing endless tax cuts for the wealthy that somehow never seem to trickle down to the rest of us is Bush’s primary answer to all our economic ills.

Meanwhile, the Bush administration is considering plans to force striking Goodyear employees back to work at the Goodyear Tire & Rubber plant in Kansas because of an impending shortage of tires for Humvees and other military equipment used in Iraq and Afghanistan.

What Bush should have done is to urge Goodyear back to the bargaining table (contract talks resumed this week). Three years ago, workers at Goodyear tire plants voluntarily agreed to a wage and benefit freeze to help out the financially ailing company. Goodyear management was so grateful that it said the United Steelworkers (USW), the union that represents the workers, was its partner.

But instead of keeping the promises it made to workers when times were bad—like keeping jobs in the United States in return for wage freezes—the company now is slapping those same workers in the face.

Paulson’s predecessor, John Snow, said in 2004 that

The outsourcing of U.S. jobs “is part of trade...and there can’t be any doubt about the fact that trade makes the economy stronger.”

That’s the same type of twisted Bush administration logic that sends hundreds of thousands of troops after non-existent weapons of mass destruction.

[Striking Goodyear workers will lose their health coverage Jan. 3. During the holiday season, think about giving a donation to the USW Strike Fund. All money goes directly to the strikers.]

Tags: AFL-CIO, unions, labor, Steelworkers, outsourcing, Goodyear
Thailand and Emerging Markets Rebound

From Bloomberg:

Emerging-market stocks rallied from the biggest drop in three months after Thailand exempted stocks from capital controls imposed on international investors.

Thailand's SET Index jumped 11 percent in Bangkok after plunging 15 percent yesterday, its biggest slide in 16 years, following the introduction of the new rules. Benchmarks in South Korea, Indonesia, Malaysia, Pakistan, Russia, Hungary and South Africa were all up more than 1 percent.

The Morgan Stanley Capital International Emerging Markets Index, which tracks 25 markets, added 1.2 percent to 891.70 at 11:16 a.m. in London. The measure yesterday dropped 1.6 percent, the most since Sept. 11, after Thailand's rule change highlighted the risks of investing in developing


It looks like everybody is happy again.

Tuesday, December 19, 2006

More on the Housing Starts 6.7%* Increase

Below are some posts from homebuilding related news stories from December. The stories are from the Yahoo homebuilding sector web page.

First -- in December both Hovnanian and Toll Brothers predicted a bottoming in the housing market. It's important to remember that CEOs are media savvy. In other words, they may be saying this hoping it comes true, or with an eye to maybe influencing the market in some way.

However ...

Construction spending dropped 1% in October.

The overall drop was driven by a 1.9 percent decline in private residential construction and a 1.5 percent drop in private construction. October saw the sixth straight dip in private construction.


Toll Brothers predicts a drop in 2007 profit:

Toll Brothers the luxury home builder, said next year fiscal year's profit may fall 62% but also said it may be seeing a floor in some markets where deposits and traffic, although erratic from week to week, seem to be dancing on the bottom or slightly above.


Toll Brothers current earnings drop 44%

Luxury home builder Toll Brothers Inc.'s fourth-quarter earnings fell 44 percent, but the company said it sees some signs of stabilization in the slumping housing sector and raised its forecast for first-quarter home deliveries.


Realtors predict a drop in sales in 2007

Next year will likely bring a second annual decline in existing home sales, the National Association of Realtors predicted Monday.

Sales of existing homes are expected to decline 8.6 percent to 6.47 million for 2006 and contract another 1 percent to 6.40 million units next year.


Hovnanian reports 4th quarter loss:

Homebuilder Hovnanian Enterprises Inc. reported Monday that it swung to a loss in fourth quarter, beset by a downturn in the housing market that has also plagued competitors.

After paying preferred stock dividends, the company reported a quarterly loss of $117.9 million, or $1.88 per share for the quarter that ended Oct. 31. That compared to a profit $165.4 million, or $2.53 per share, for the same period a year ago.


Let's add to inventory now. Times are great!

Producer Prices +2%; Housing Starts Up 6.7%*

From the Bureau of Labor Statistics:

The Producer Price Index for Finished Goods advanced 2.0 percent in November, seasonally adjusted, the Bureau of Labor Statistics of the U.S. Department of Labor reported today. This gain followed declines of 1.6 percent in October and 1.3 percent in September. The index for finished goods other than foods and energy rose 1.3 percent in November compared with a 0.9-percent decrease in the previous month. At the earlier stages of processing, prices for intermediate goods moved up 0.7 percent after falling 1.1 percent in the prior month, and the crude goods index increased 15.7 percent following a 10.5-percent decline in October.


The number ex-food and energy was up 1.3%, the largest jump in the last 12 months.

The upturn in the finished goods index was broad-based and led by prices for energy goods, which climbed 6.1 percent in November after declining 5.0 percent in October.


Energy and crude goods also increased the most in 12-months.

Here's how Bloomberg reported the number:

Prices paid to U.S. producers rose in November by the most since 1974, led by rebounds in the costs of energy and light trucks. Prices excluding food and energy increased more than forecast.

The 2 percent gain in the producer price index was more than forecast and followed a 1.6 percent decrease in October, the Labor Department said today in Washington. Excluding food and energy, the so-called core rate rose 1.3 percent last month, the most since July 1980, after falling 0.9 percent.


It looks like the Federal Reserve is back in play.

Housing Starts Increase 6.7%

Housing starts in the U.S. rebounded in November from the lowest level in more than six years, while building permits dropped to a nine-year low, suggesting weakness in home construction will persist in the new year.

Builders broke ground on new dwellings at an annual rate of 1.588 million last month, more than expected and 6.7 percent higher than October's 1.488 million rate, the Commerce Department said today in Washington. Building permits fell 3 percent to a 1.506 million pace, the lowest since December 1997.

Recent data suggest the most severe housing slowdown since 1990 may be nearing a bottom, as mortgage rates have fallen below last year's levels, making homes affordable for more people. Wet weather in October may have delayed some starts until November, helping to boost last month's figures, economists said. Still, near-record inventories of unsold homes will keep a lid on home construction well into 2007.

``Mild weather plus more attractive pricing on the part of home builders probably helped lead to this bounce in starts,'' said Kevin Logan, senior market economist at Dresdner Kleinwort in New York. The decline in permits shows builders ``are continuing to plan for less construction.''


Let's go to the Census information which has a very telling statistic. The margin of error for the reported numbers is plus or minus 10.1%. That's not a margin of error -- it's a margin of guessing and makes this number near-worthless.

In addition, consider the following. New and existing inventories are high. Sales area slowing. Prices are under pressure. While builder confidence may have stabilized, it is still at multi-year lows. So builders are increasing the rate of construction? That just doesn't make sense in the current environment.

Call me a skeptic on the housing number for now.

Go to Calculated Risk for more information -- charts graphs and some implications for the construction job market.

Thailand Institutes Foreign Currency Controls; Stocks Drop 11% UPDATE: Controls Lifted

From Bloomberg

Investors based abroad will be able to invest just 70 percent of funds transferred to Thailand, and only recoup all of their funds if they keep the money in the country for more than a year, Central Bank Governor Tarisa Watanagase told reporters yesterday. Any withdrawals within a year will be penalized 10 percent of the original investment, according to the new rules.

PTT and Bangkok Bank both tumbled 17 percent. PT Perusahaan Negara, Indonesia's largest gas distributor, lost 3.8 percent. OTP Bank, a Hungarian lender that's been expanding in eastern Europe since 2002, fell 2.4 percent.

``There's panic among emerging-market investors,'' said Douglas Polunin, who helps manage about $150 million at Polunin Capital Partners in London. ``Investors don't want their money tied up.''


Thailand implemented these controls in an effort to curb currency appreciation:

Thailand's decision to impose controls on capital inflows should be little surprise. Its dilemma is one often faced by emerging markets: how to keep the exchange rate down to prevent a loss of external competitiveness when the rest of the world wants to invest in your country. None of the policy responses are fully satisfactory. Unfortunately, the most effective solution rests not in Bangkok, but Beijing.

The Thai economy has recently been stronger than expected. Growth will probably exceed 5 per cent this year and next, up from 4.5 per cent in 2005, in spite of September's potentially destabilising military coup. This economic outlook has attracted strong capital inflows, with the baht appreciating by 16 per cent against the dollar this year, to reach a nine-year high.

Fearful of losing competitiveness, the Bank of Thailand yesterday imposed capital controls. Thirty per cent of new inflows will have to remain in the country for at least a year, at no interest rate, or suffer a 33 per cent penalty on withdrawal. It is hoped that the restrictions will curb the capital inflow and prevent further baht appreciation.


Unfortunately, these controls had the opposite effect, not only in Thailand but in several other markets:


- Indian share prices closed sharply lower on fears of a tighter monetary policy and a decision by Thailand to restrict foreign currency flows, dealers said.

- Kuala Lumpur was down 1.96 percent, and Second Finance Minister Mohamed Yakcop said Malaysia is not going to impose capital controls.

- Jakarta slumped 2.85 per cent, Singapore was off 2.2 per cent, Mumbai shed 2.54 per cent, and Hong Kong closed down 1.19 per cent.


Here's what's happening in a nutshell. Thailand's currency is appreciating in value because Thailand's economy is growing. An increase in the Baht (Thailand's currency) makes their respective exports less competitive against other products. The Bank of Thailand's move was suppose to slow down the amount of capital coming into the baht, lowering it's rate of appreciation. In addition, the move is supposed to prevent quick currency speculation. Think of it as a way to stop something similar to day trading. However, the Bank of Thailand's policy spooked investors because it forced international money to remain in the country for a specific period of time. In other words, the Bank of Thailand's move prevented the free flow of capital. This makes Thailand a less attractive country to invest in. As a result, investors want to get out of Thailand as fast as possible. Other developing countries with similar risk profiles are caught in the withdrawal, essentially as collateral damage.

UPDATE: Thanks to Calculated Risk in the Comments for this.

The Thai government is lifting controls on foreign investment in stocks after the market plunged nearly 15 percent on Tuesday, rattling regional bourses amid worries about a repeat of the 1997 Asian financial crisis .

Finance Minister Pridiyathorn Devakula said that the controls -- announced just a day earlier -- would remain on foreign investments in bonds and commercial paper as part of central bank's measures to stem the surge of speculative investment in the Thai baht, which had risen to a nine-year high versus the dollar on Monday.


We'll have to see if the indexes rebound from their sell-off tomorrow.

Monday, December 18, 2006

Homebuilders Confidence May be Stabilizing

U.S. home builders were a bit more pessimistic about the housing market in December, but they're growing more hopeful that home sales could perk up in six months, the National Association of Home Builders reported Monday.

The NAHB/Wells Fargo seasonally adjusted housing market index fell to 32 in December from 33 in November. About a third of builders view the market as favorable. The index has been roughly flat for the past five months, hovering in a range between 30 and 33. Read the full report.


Before we throw a party, remember the index is still at multi-year lows, indicating the bearish sentiment is very strong. In addition, inventory levels are still very high and the consumer is still deeply mired in debt.

John Edwards on Unions

Bonddad is a Democrat. Considering I have written for Daily Kos for the last 2 years, that shouldn't be a surprise. Clinton balanced the budget and grew the economy at the same time. 'Nuff said.

Bonddad supports unions. In a recovery where wages are stagnant after inflation, health care is rationed to those who can pay, college education is more and more out-of-reach of people and a whole host of other problems -- some organization has to speak for employees. That is where unions come in. Taylor Marsh did some great on-the-ground reporting of the recent nurses strike in Las Vega. Her blog link is below.

Consider this your full-disclosure moment.


by Taylor Marsh

Some time between Christmas and the New Year John Edwards is going to announce his run for the '08 presidency. I've not picked any candidate yet, but this certainly seems like a good time to share and discuss a recent appearance of Edwards on "Hardball," which I've been writing and talking about lately. It's particularly interesting given my recent SEIU sponsored coverage on the Las Vegas nurses strike.

There's a reason John Edwards is way ahead of the Democratic presidential pack in a recent Iowa poll, and even leads John McCain in a national trial heat. Edwards is reaching people on issues that impact a segment of this country that have been left behind by Mr. Bush: the middle class.

Democratic populism is back, baby. Just in time, if you ask me.

Senator-elect James Webb talked about it during the campaign, then offered a stunning piece on "class struggle" in the Wall Street Journal after the election.

Senator-elect Sherrod Brown ran on it. His next target is BigPharma.

So did Senator-elect Claire McCaskill, as did Senator-elect Jon Tester.

So having Edwards up front and center on the subject simply takes their 2006 campaigns to the next logical level.

Edwards is on a roll. He's got his patter down on Iraq. He's got Elizabeth Edwards next to him, which is a secret campaign weapon as far as I'm concerned. But when he starts talking about poverty, the middle class and how to fix the problem, that's when his rhetoric meets the road.

Card check is just one part of the union story that Edwards favors. What is it? It's part of the Employee Free Choice Act, which has a lot of support in Congress already. There's more about from PaulVA's Kos diary. No doubt the "National Right to Work" people will fight it.

Edwards nailed the subject on "Hardball" recently. The YouTube video is here.


MATTHEWS: Are you for the card check?
J. EDWARDS: I am for the card check.
MATTHEWS: You think that's fair to be able to have four people from a
labor union, big people come up to a little person and say you're going to vote
for the union, aren't you? You're going to vote for the union, aren't you?
Today the law says you have to have a big meeting and everybody has to be
there to vote for the union. You're saying--the card check says all you need is
51 percent of the people to be individually talked into signing a card and you
think that's OK.
J. EDWARDS: I think it's democracy. I do.
MATTHEWS: But not having an election?
J. EDWARDS: It's democracy because what happens is
the way the system has been loaded up is the employers bring in these union
busters who are exerts at busting the union. They sometimes violate the law. The
way the enforcement works is almost nonexistent. Three or four years down the
road there's a slap on the wrist. All I want is I want to see a level
playing field. If employees want to join a union, democratically they ought to
be able to do that. If they don't, they can choose not to.
MATTHEWS: OK, the average person is working at the mill, they're working on the job and they're on the machine, and four guys come up to them, big guys, they go up and say sign this card, we want to start a union here. And that little person goes I'd rather not. You'd rather not? Isn't that kind of intimidating for a person?
J. EDWARDS: But why would you assume it's the fellow employees who are going to
intimidate...
MATTHEWS: Because it's the outside labor organizations.
J. EDWARDS: ... them instead of the guy who's writing their check?
MATTHEWS: Because if they international union guys come in. I'm asking you a question. Do you think that shows independence our your part, or the fact that you're in bed with labor.
J. EDWARDS: I think it shows that I am a complete believer in workers having a voice and being able to collectively bargain. I don't think we have a problem in America with big, multinational corporations being able to have their voice heard. Their voice is heard loud and clear.

Hardball transcripts (emphasis added)

I joined my first union before I was 20. Subsequently, I ended up joining four performance unions. They made a real difference in my life. Currently, I'm on honorary withdrawal from them all, but I haven't forgotten their importance. The recent SEIU nurse lock-out in Las Vegas drove it home.

John Edwards is talking about something that matters, not only to people struggling, but to the entire American way of life. As the middle class goes so goes this country. With the new Congress elected and so many populists now in office, John Edwards is telling a tale that will have many people jumping on board; mainly because they're already waiting for that train to visit their state.

This is going to get interesting.


- Taylor Marsh LIVE! can be heard from 6-7 pm eastern - 3-4 p.m pacific, Mon.-Thurs, with podcasts available.

Current Account Widens in Third Quarter

From the Bureau of Economic Analysis

The U.S. current-account deficit--the combined balances on trade in goods and services, income, and net unilateral current transfers--increased to $225.6 billion (preliminary) in the third quarter of 2006 from $217.1 billion (revised) in the second quarter. The increase was more than accounted for by increases in the deficits on goods and on income. The surplus on services increased, and net unilateral current transfers to foreigners decreased.


This is 6.8% of GDP. Most economists would say this level is unsustainable. I would agree.

Goods exports increased to $262.1 billion from $252.8 billion. The
increase resulted from increases in all major commodity categories.

Goods imports increased to $480.7 billion from $463.4 billion. The increase resulted from increases in petroleum and products and in most major categories of nonpetroleum products.


In other words, we aren't exporting our way out of the problem.

Income receipts on U.S.-owned assets abroad increased to $160.1 billion from $155.3 billion. The increase was largely accounted for by an increase in “other” private receipts (which consists of interest and dividends). Direct investment receipts also increased.

Income payments on foreign-owned assets in the United States increased to $162.2 billion from $155.8 billion. Direct investment payments, “other” private payments (which consists of interest and dividends), and U.S. Government payments (which consists of interest) all increased.


About six months ago there was a theory floating around called "dark matter". It essentially stated that US assets abroad traditionally paid more income than foreign owned assets in the US. Therefore, the trade deficit was actually OK. Anyway, the difference between income from US assets abroad into the US and foreign owned assets in the US going abroad has been decreasing for the last year or so, making the "dark matter" theory somewhat more suspect.

The dollar is one of the wild card I see in the US' economic future in 2007. This does not help the dollar's value in the long run.

Sunday, December 17, 2006

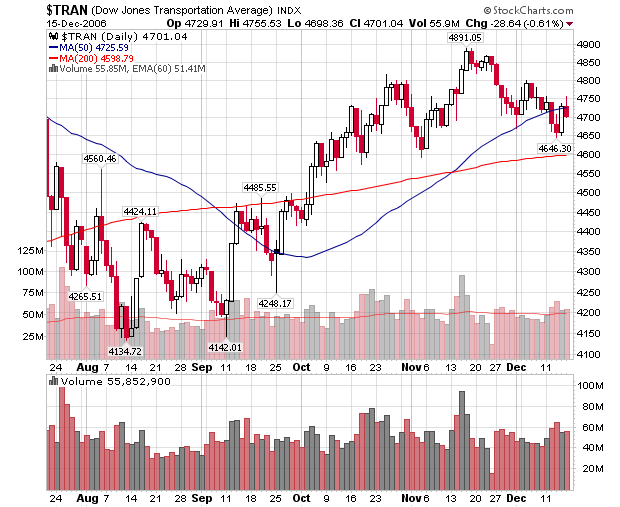
Transports Aren't Confirming the Rally

Standard Dow theory stares the averages must confirm each other's movements. For example, if the Dow increases, than the transports should also increase. The theory behind this idea is if business is improving, than business will have to get products to market which is also beneficial for the transportation industry. However, the Dow Transports have not joined the latest rally as the chart below indicates:

Photobucket - Video and Image Hosting

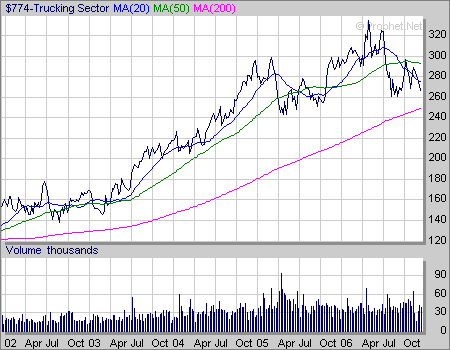
The main reason for this is trucking's poor price performance. Here is a 5-year chart from prophet.net.

Photobucket - Video and Image Hosting

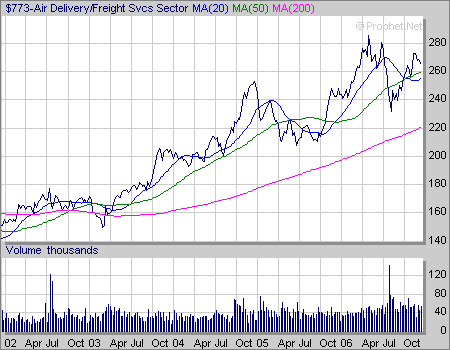
With the rise of online shopping and the Christmas season upon us, you'd think air transport companies would be rallying. But they've sold-off a touch. Additionally, they failed to make a new high when they had a chance over the last few weeks. Here's a 5-year chart.

Photobucket - Video and Image Hosting

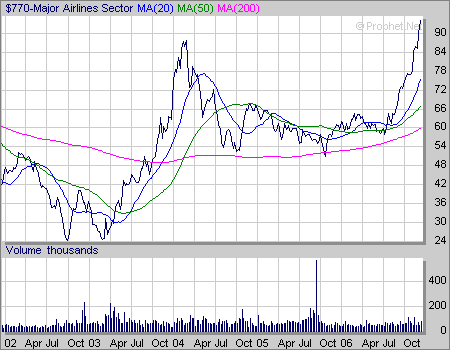
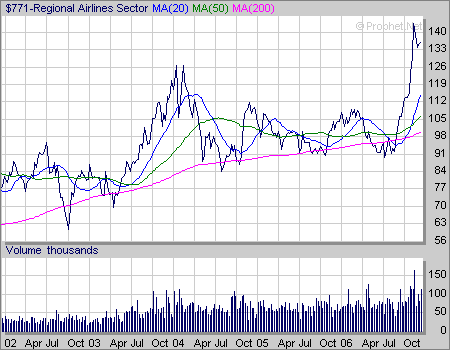
Regional and major airlines have been rallying, but largely on news of consolidation, not an improvement in business conditions. While some of the larger carriers are doing better, the industry still has to contend with incredibly high overhead making a continuation of profits difficult. So while these sectors are rallying, they are doing so for an industry specific reason -- consolidation -- rather than an improvement in overall business conditions. Below is a 5-year chart for the majors and regionals, respectively.

Photobucket - Video and Image Hosting

Photobucket - Video and Image Hosting

So -- is the Dow theory still relevant? Only time will tell. But -- it's worth considering.

Coming Up This Week

Housing Starts and Producer Prices come out on Tuesday. The housing starts number is important. Builders have been slowing their building pace in response to a large inventory build-up.

We get the final 3Q GDP, Leading Economic Indicators and and the Philly Fed on Thursday. The ISM manufacturing numbers dropped below 50 last time, so the Philly Fed number will let is get some confirmation or not of that particular number. Personally, I've never been a big fan of the LEI numbers.

Durable Goods, personal income and consumer sentiment come out on Friday.

I would expect the market to really slow down come Thursday about noon, as traders look to get an early start on the Christmas break.

We'll also have to see if the markets decide to continue their rally, or if traders start to book and lock-in year-end profits.

Saturday, December 16, 2006

Why Are the Markets Rallying?

The latest stock market rally has started to get on my nerves. It’s not that making money in the market is a bad thing. To the contrary, I am personally all for it. However, something about it has seemed out of place. The business cycle and stock market are pretty tightly correlated. When business increases, stock prices go up and visa versa. The problem is the economy is slowing and housing is clearly in a big correction. In short, this doesn’t seem to be the time when the markets should be making record highs.

Let’s review the general economic background. According to the Bureau of Economic Analysis, US GDP increased 5.6% in the first quarter, 2.6% in the second quarter and 2.2% in the third quarter. The BEA revised third quarter GDP up from 1.8% to 2.2%. However, the three quarter trend is clear: growth is slowing.

Housing is in a slump. The Federal Reserve made the following comment in its FOMC statement on December 12:

Economic growth has slowed over the course of the year, partly reflecting a substantial cooling of the housing market. Although recent indicators have been mixed, the economy seems likely to expand at a moderate pace on balance over coming quarters.


The employment picture is statistically solid:


Nonfarm payroll employment rose by 132,000 in November, and the unemployment rate was essentially unchanged at 4.5 percent, the Bureau of Labor Statistics of the U.S. Department of Labor reported today. Job gains continued in several service-providing industries, including professional and business services, food services, and health care. Employment declined in construction and manufacturing.


Hourly wages have actually increased through November of this year. So far, hourly wages increased from $16.40 in January to $16.91 in November for an increase of 3.1%. Over the same period, the inflation index increased from 198.3 to 201.5 for an increase of 1.61% making wage gains 1.49%. However, this is the first year of this expansion when wages have increased faster than inflation. So this is good news, but it will take a bit of time for 80% of the population to start making money beyond inflation. However that may prove difficult in a 2.2% GDP growth rate environment.

So using the above metrics we see the US is in a low-unemployment situation with increasing wages. But growth is slowing and the housing market is slumping. In other words, it is more likely the slow growth environment will continue, especially considering a slumping housing market. So the US economy is technically in good shape, but certainly not something to write home about.

Let’s turn to the markets. Below are point and figure charts for the Dow Jones Industrial, S&P 500 and NASDAQ. These charts are designed to show major price movements, essentially filtering out the statistical noise from day-to-day price fluctuations. The numbers and letters you see on the chart symbolize months, with the letters A, B and C symbolizing October, November and December. The charts are from Stockcharts, which is a really good website for technical information. When looking at the charts below, pay particular attention to the volume bars in the lower part of the chart.

Photobucket - Video and Image Hosting

Photobucket - Video and Image Hosting

Photobucket - Video and Image Hosting

With the Dow chart, notice how the total traded volume doubled in the rally from August to September. With the S and P, notice how the volume increased 1.5 times for the latest rally. And with the NASDAQ notice we have two very large volume bars for the September rally and 1 for the October rally. With each average we have a big total volume increase during the latest rally that is at the least 1.5 times as large as other rallies.

The last time the markets had a strong rally was from March 2003 to early 2004. 10-week bar average volume of the SPYs was right around 216 million. In the current rally, that number is right around 366 million – 1.7 times the 2003 number. Those same numbers for the QQQQs were 414 million and 564 million. While the QQQQ recent volume increases aren’t as large as the SPYs, they are higher.

This leads to a few questions. First – where is this volume coming from? For the last 4-6 months, the Federal Reserve has been using a ton of repo agreements increase money supply via M3. That would explain some of the volume. The latest TIC data indicates foreigners have increased their purchasing of equities. Through October of 2005 they had purchased 83.6 billion of securities, whereas they had purchased $114 billion through October 2006. This is a net increase of 37%.

But more importantly is this observation from the great trader W.D. Gann. He divided market developments into 7 phases, one of which was The Third Zone, or the highest above normal marks. Basically, everybody is buying, everybody is talking about how wonderful the market is, the market continues to advance for a period of weeks or months and people get “too full of hope to sell.” These areas of the market are easy to identify -- after prices fall. While it’s going on it’s hard to discern exactly what is happening.

So – are we in this third zone? The length of the rally and the large increase in volume compared to the 2003 rally would indicate the possibility is higher. In addition, we have a slowing economy, a troubled housing market, oil under upward pressure from OPEC production cuts and a falling dollar – all of which are bearish. On the plus side, unemployment are statistically low and hourly wages are increasing after inflation for the first time during this expansion.

Technical analysis is not a science. just because the events say something will probably happen does not mean it will happen. However, right now we have a higher probability of the markets nearing a top.

Did Retail Sales Really Increase 1% in November?

I have to admit -- Wednesday's retail sales number has been bugging me since it was released. Part of this is because it completely disrupts my personal thesis for the economy -- that the US economy is teetering on the edge of a recession largely due to housing. No one likes to have to actually rethink their position -- or God forbid admit they were wrong. (Please read that with a dose of extreme sarcasm).

So, let's go back to a couple of categories in the retail sames number to see what the internals say and compare those number to some other readily available retail sales numbers.

Let's start with the Bank of Tokyo Mitsubihi's Chain Store Sales Report. According to this survey, the seasonally adjusted month-to-month percent change in same store sales was -1%. October's number was slightly better at a -.6% drop. The year-over-year percent change in the number was 2.1%, which was the lowest reading of 2006 except for March when the number was 2%. We run into a problem with the Census data at this point because the Census states, "Data not adjusted for seasonal variations, holiday, trading-day differences, and price changes." So, read that as a disclaimer. However, most of the other retail data released is seasonally adjusted. So we have to work with what we have to figure this situation out.

Continuing our look at the BTM numbers for specific categories of retailers, specialty apparel, general merchandise and drug stores all advanced, but not at greatly accelerated rates. Specialty apparel increased 2.4%, general merchandise increased 1.6% and drug stores increased 8.4%. None of these numbers were radically higher than any previous months. In fact, general merchandise sales decreased sharply in October and November.

The Census data says that "Building material & garden eq. & supplies dealers" increased from (in millions) $29,289 to $29,817 The BTM survey says home supply sales sales decreased 15.7%. It's also important to remember the housing market is in a slump right now. Sales are down, inventory is up. Is this a real estate market where building materials and supplies sales will increase 1.8%?

According to the census data, car sales increased from (in millions) $77,197 to $77,906. This data is not seasonally adjusted. However, according to motor intelligence, the seasonally adjusted annual rate of US car sales decreased from 16.16 million in October to 16.04 million in November. This is the lowest seasonally adjusted annual rate for car sales this year.

In November WalMart reported their November sales decreased .1%, the first drop since April 1996. Other retailers showed increases. However, Wal-Mart is far bigger than their competitors.

So, while the Census data says retail sales increased at a high rate in November, all other surveys say sales of various retail sales components decreased. There is an important difference in methodology in the other reports because they are seasonally adjusted. However, using the old Sesame Street game "One of these things is not like the other one" we come to the conclusion the Census will probably lower their numbers for November.