Sunday, July 3, 2022

There is no ‘compromise’ to end the issue of abortion - but there may be a ‘least worst’ modus vivendi


 - by New Deal democrat

I have written before that the typical divide between “economic” and “social” issues isn’t quite correct. Most “social” issues, it turns out, are really “moral” issues, where some people are opposed because they believe the activity to be allowed is immoral.

While it is usually not too difficult to find a compromise on economic issues, asking someone to compromise on a matter of morality is usually a lost cause.

That being said, even for moral issues, a doctrine of “live and let live” usually works, so long as neither side requires the other side to personally act in accordance with the opposing view. For example, nobody else is actually harmed by allowing two consenting adults to get married, regardless of their gender. At the same time, I wouldn’t require a baker who is opposed to gay marriage to bake a cake for the couple in his proprietary business (and would you *really* want to eat such a cake, not knowing what extra “ingredients” may have been added?).

But that doesn’t work with abortion, because one side believes the act of the other side is inherently murder. There is no zone of “let live,” because one side unalterably believes that there is a third party involved.

Nevertheless, Daniel Conkle, a Professor Emeritus of Constitutional Law at the Indiana University Law School, penned an editorial for Politico in which he wrote that, after Dobbs’ reversal of Roe v. Wade (note: I’ve changed the order of several paragraphs for clarity):


“our current reality [ ] will lead to conflict and litigation between states…. Partisan polarization will be exacerbated, and the risk of abortion-related violence will grow. Our precarious social fabric will be torn apart, further imperiling our already weakened sense of commonality and nationhood.

“[Further, w]ithout something close to a consensus, abortion laws [will] always be ripe for reversal if the next election.

“To avoid these consequences, lawmakers will have to meet in the middle.

“To be potentially viable, a national compromise would include four elements. First, it would permit abortion during a specified period of gestation, without restriction, during the few first months of pregnancy. Second, it would prohibit abortion later in pregnancy. Third, even after this point in pregnancy, there would be exceptions to the abortion prohibition. And fourth, the congressional compromise would be national in scope, with federal law controlling the issue of abortion and preempting state law to the contrary. The fourth element, federal preemption, bears emphasis. 

“It means that the congressional compromise would displace and nullify state abortion policies. There would be the same right to abortion in red and blue states alike, subject to the same limitations”

Scott Lemieux of Lawyers, Guns, and Money writes that this is exactly what Roe v. Wade codified.

Actually, no. The majority in Roe very succinctly themselves added a summary of their holding, to wit:

“To summarize and to repeat:
“….

“(a) For the stage prior to approximately the end of the first trimester, the abortion decision and its effectuation must be left to the medical judgment of the pregnant woman's attending physician.


“(b) For the stage subsequent to approximately the end of the first trimester, the State, in promoting its interest in the health of the mother, may, if it chooses, regulate the abortion procedure in ways that are reasonably related to maternal health.


“(c) For the stage subsequent to viability, the State in promoting its interest in the potentiality of human life may, if it chooses, regulate, and even proscribe, abortion except where it is necessary, in appropriate medical judgment, for the preservation of the life or health of the mother.”


In the companion case of Doe v. Bolton, the Court defined health as "all factors – physical, emotional, psychological, familial, and the woman's age – relevant to the well-being of the patient."

There are three major differences between Roe and Professor Conkle’s proposed compromise:

1. Conkle says abortion should be permitted “during the first few months of pregnancy. Roe drew the line at viability, which in the 1970s was at 6 months, but due to progress in medicine, has moved earlier by 2 to 4 weeks during the 5th month.

2. Conkle says abortion would be prohibited “later in pregnancy.” Contra Lemieux’s assertion, paragraph “(c)” of the Roe opinion explicitly stated that the State *may* - but does not have to - regulate or forbid abortions. In other words, Roe permitted abortions right up until the moment of birth, if a State were to so decide.

3. Further, the definition of “health” as set forth in the companion Doe case went far beyond physical health with regard to permitting abortions after viability, including “emotional, psychological [and] familial” issues, including ones that may be transient in nature.

To go back to my initial paradigm, is there any sort of “grand bargain” to be had? I think not, in the sense of a compromise where all parties feel the outcome is satisfactory enough to live with. Those who believe that human life begins at conception and is at all points thereafter sacred, consider abortion murder. They are not going to compromise by allowing “some” murder. On the other hand, there are those who believe that abortion should be available on demand at all times. They are not going to be interested in the above proposed compromise either.

But if there is no “compromise” to be had in the generally accepted meaning of the word, there probably is a middle zone where the minimum number of people feel unalterably and implacably opposed, which in the long run is probably what society ought to aim for. With one exception Professor Conkle’s proposal comes pretty close.

For over 40 years, polls have shown that most Americans are comfortable with first trimester abortions, and become increasingly opposed as it gets later in the second trimester. A law which permitted abortion through the first trimester, and perhaps up until quickening (the historical dividing point which occurs when fetal movement can be felt, usually during the fourth or early fifth month) would likely meet with wide approval.

Further, a law which forbade abortion except for serious *physical* health complications to the mother thereafter, or to prevent the birth of a severely deformed newborn which was doomed to a brief and painful life, would probably also find wide acceptance.

So far, this is basically Conkle’s proposal.

Where I part company with Conkle is as to his final prong, namely that there would have to be a uniform nationwide law. In fact, I think exactly the opposite is true. Once the parameters are set, there ought to be room for local variation. For example, first trimester abortions are permitted, while abortions after viability are banned with the physical health exception I specified above. In between those boundaries, reasonable regulations, restrictions, and prohibitions could vary between jurisdictions.

In fact, I would go further than just making a matter of State differences. I think the best chance of finding an accommodation would allow localities to differ; e.g., rural Mississippi might be an abortion desert, while Jackson, Mississippi might adopt a more liberal rule. Basically, the majority’s ox doesn’t get gored in their local area; but they can’t gore the ox of the majority in the locality next door; and those who need to travel to accommodate their need don’t have to travel too far.

We already have an example of allowing this variability in US history, with the issue of prohibition. After over 50 years of profound agitation, the 18th Amendment to the US Constitution was adopted, enshrining nationwide the sale or consumption of alcohol. Thus, by the way, taking away from average Americans a right they had always had - something that Dobbs just did, the first time the Supreme Court has done so in over 200 years.

After only 14 years, the 18th Amendment was repealed by the 21st. But the repeal specifically allowed States to set their own policies, including prohibition, if they so chose. Three States - Kansas, Oklahoma, and Mississippi - kept statewide prohibition for years afterward, with Mississippi - the last holdout - only repealing prohibition in 1966. The other States allowed a welter of regulations, including “dry” counties, some of which still exist.

The abortion issue may yet be a fundamental issue tearing this country apart. But if it is ever to be relatively minimized as an issue, a proposal like Conkle’s but allowing state and local variation within certain boundaries is how that is going to be achieved.


Saturday, July 2, 2022

Weekly Indicators for June 27 - July 1 at Seeking Alpha


 - by New Deal democrat

My Weekly Indicators post is up at Seeking Alpha.

There was yet more deterioration this week, focused on the long and short leading indicators.

But consumer spending still seems to be holding up.

As usual, clicking over and reading should bring you up to the virtual moment about the economy, and bring me a little pocket change to buy lunch.

Friday, July 1, 2022

Manufacturing and construction start out the second half of 2022 with more bad news


 - by New Deal democrat

Let’s take a look at the new month’s first data, on manufacturing and construction.

The ISM manufacturing index, and especially its new orders subindex, is an important short leading indicator for the production sector. In June, for the first time, the leading new orders index showed slight contraction, declining below 50 to 49.2 from 55.1. The overall index continued to show expansion, but also declined from 56.1 to 53.0:


This is important. The reason why is shown in this long term graph of the new orders index going all the way back to 1948:


Going back almost 75 years, the new orders index has always fallen below 50 within 6 months before a recession, and in three cases did not actually cross the line until the first month of the recession itself.

In other words, going by this metric alone it is *possible* that the US entered a recession in June, and increasingly likely that it will enter recession no later than Q1 of next year.

Meanwhile, construction spending declined - 0.1% in nominal terms in May, but April’s number was revised up from 0.2% to 0.8%. The more leading residential sector rose a mere 0.2%, although April was revised sharply higher, from 0.9% to 1.7%. Both thus again made new highs:


On a YoY basis, nominal residential construction spending is up 18.7%.

Adjusting for price changes in construction materials, which jumped 3.0% for the month, “real” construction spending declined -3.1% m/m, and residential spending fell -2.8% m/m. Thus in absolute terms, “real” construction spending has declined by about 20% since its peak in November 2020,  while “real” residential construction spending has declined about 10% since its post-recession peak in January of last year:


It remains the case that while the decline in residential construction spending, while substantial, is at roughly on par with its 2018-19 decline, and was nowhere near the -40.1% decline it suffered before the end of 2007. 

Last month I wrote that “it takes awhile for the downturn in mortgage applications, sales, and permits to filter through into actual construction, especially with record numbers of housing units permitted but not yet started.” This month may be just noise, or it may be the beginning of that turn.


Thursday, June 30, 2022

Real personal income and spending decline in May, while the saving rate increases (not good!)


 - by New Deal democrat

In May nominal personal income rose 0.5%, and spending rose 0.2%. But since the personal consumption deflator, i.e., the relevant measure of inflation, rose 0.6%, real income fell -0.1%, and real personal spending fell -0.4%.

While both real income and spending are well above their pre-pandemic levels, I have stopped comparing them with that, but instead with their level after last winter’s round of stimulus. Accordingly, the below graph is normed to 100 as of May 2021:


Since then, real spending is up 2.1%, while real income has actually declined by -1.0%.

Comparing real personal consumption expenditures with real retail sales for May (essentially, both sides of the consumption coin) shows the decreases in both:


Finally, the personal saving rate turned slightly higher, up 0.2% to 5.4%:


This is not necessarily good news! Usually the savings rate has tended to decrease as expansions grow longer, leaving consumers more vulnerable to shocks (e.g., gas prices). 

The personal saving rate this year has been the lowest of any period in the past 60 years except the two months after 9/11, and the 2004-2008 period when home equity refinancing from the last housing bubble was all the rage. That means households have been making up shortfalls by digging into savings or tapping another source of credit. Households reversing that, and feeling the need to increase their saving is a signal that a recession is beginning. 

Given the poor retail sales report earlier this month, I was expecting a negative in the personal spending report. And the fact that April and May averaged together are still positive is encouraging. But this report is yet another in the drip, drip, drip of a deteriorating economy.

Initial claims continue weakening trend, but are not signaling recession this year


 - by New Deal democrat

Initial jobless claims declined -2,000 (from an upwardly revised 233,000), to 231,000 last week, vs. the 50+ year low of 166,000 set in March. The 4 week average rose further, by 7,250 to 231,750, compared with the all-time low of 170,500 twelve weeks ago.  Continuing claims declined 3,000 (from an upwardly revised 1,331,00) to 1,328,000, which is 22,000 above their 50 year low set on May 6:


Initial claims have been in an uptrend for nearly 3 months. If this continues one more week, they will no longer qualify as a “positive” in my array of short leading indicators, although they have not risen to levels that would change their rating to a negative.

Which brings up the issue, in this weak and deteriorating economy, just what would it take to flip this indicator to negative?

Four years ago in 2018, discussing a similar increase, I reviewed the entire 50+ year history of initial claims, concluding that “there are almost always one or two periods a year where the four week moving average of jobless claims rises between 5% and 10%. About once every other year for the past 50+ years, it rises over 10%. Typically (not always!) it has risen by 15% or more over its low before a recession has begun. And a longer term moving average of initial claims YoY has, with one exception, turned higher before a recession has begun.”

The first criterion can’t be graphed using FRED tools, but here’s what the second criterion looks like historically:


The current situation fulfills the first criterion, as claims are up about 35% from their *very* low starting point, but fails the second criterion. Claims are down roughly 45% from one year ago:


At the moment, claims have stabilized in the range of 230,000. At worst, the current uptrend in claims (so far!) is consistent with a potential 0.1% uptick in the unemployment rate going into autumn, which as I discussed last week, under the Sahm Rule it’s very unlikely that the unemployment rate will signal the onset of a recession during that time. Even if claims were to continue to rise from here on average about 4,000 a week (their average for the last 12 weeks), they would not turn negative YoY until November, which would be a short leading indicator for a recession thereafter.

Wednesday, June 29, 2022

Two long leading indicators - real money supply and credit conditions - worsen


 - by New Deal democrat

M1 and M2 money supply for May was reported yesterday by the Fed. The former was unchanged for the month, and the latter was up a tiny 0.1%:


That is significant. Why? Because real money supply is a long leading indicator. Real M2 fell out of favor after failing to actually decline YoY prior to the 2001 and 2008 recessions, but a YoY% decline in real M1 and a real YoY% gain of M2 of less than 2.5% is nevertheless an excellent leading indicator for recession:


Here is a close-up on the past year:


Both real M1 and real M2 are outright negative as of May.

There have been several false positives for this indicator: 1967, 1987, and 1994. But otherwise, every time this has happened, a recession has followed within 9 months to 2 years.

Additionally, the Chicago Fed updated its financial conditions indexes this morning. The Adjusted National Conditions Index rose to +.15, and the Leverage Index rose to +.53. With the exceptions of 1987 and 2011, both of these are at levels typically associated with oncoming recessions:


In sum, the long leading indicators continue to worsen. The only unambiguously positive such indicator at the moment is the Treasury yield curve (and even there, the 10 year minus 2 year spread is *almost* - but not quite - inverted).

Tuesday, June 28, 2022

House prices continued to surge through April; expect no meaningful moderation in the CPI anytime soon


 - by New Deal democrat

House prices increases continued to go through the roof as of April, as reported this morning in both the Case Shiller and FHFA house price indexes. The Case Shiller national index rose another 2.1% for the month and 20.4% YoY, just 0.1% below last month’s biggest YoY% gain ever, while the FHFA purchase only index rose 1.6% for the month, and 18.8% YoY, below its peaks of 19.3% in February, and 19.4% last July. The YoY% changes for both for the past 5 years are shown below:


Here is a longer term view, demonstrating that the current surge in house prices is the biggest in the past 30 years, surpassing even the housing bubble:


Owners’ Equivalent Rent (x2 for scale, black) is also shown above. As I have pointed out many times, OER follows house price indexes with roughly a 12-18 month lag. OER has also risen to a 30 year record YoY high, and can be expected to accelerate further. 

For further context, here is the YoY% change in median new home sales price from the Census Bureau in the past 5 years:


While I can’t show you graphically the YoY% change in prices in existing homes from the NAR, since they only allow FRED to show one year, below are the YoY% changes for every month in median existing home sales prices for the past 13 months:

Apr 2021 +19.1%
May +23.6% [peak]
Jun +23%
Jul +20%
Aug +15%
Sep +13%
Oct +13.1%
Nov +13.9%
Dec 2021 +15.8%
Jan 2022+15.4%
Feb 2022 +15%
Mar 2022 +15%
Apr 2022 +10.4% [lowest]
May 2022 +14.8%

Since the NAR data is not seasonally adjusted, the YoY% change is the only valid way to measure.

Last month the existing home sales increase gave some hope that house price gains were moderating. That still apppears to be the case with regard to new homes. But there is very little evidence of moderation in either house price index.

And since OER plus rents contribute a full 1/3rd of the entire value of the CPI, and can be expected to accelerate further, I see very little reason to believe that, absent the Fed creating a recession, consumer inflation is going to abate meaningfully anytime soon.

Monday, June 27, 2022

A comment on housing, inflation, and Fed policy (and a side comment on spending)


 - by New Deal democrat

No big economic news today, and as usual little State reporting on COVID over the weekend, so let me make a couple of points.


As an initial note, the big report I will be paying attention to this week is personal spending and income, which will be reported on Thursday.

As I’ve noted several times recently, the goods-producing side of the economy has been fading somewhat. And earlier this month, we got an awful retail sales report (which we average about once every year).

Personal spending is the flip side of retail sales. And what’s been happening there is a bifurcation between spending on goods vs. spending on services. Here’s a graph of each, normed to 100 as of right before the pandemic:


There was a huge increase in spending on goods, especially in last spring’s stimulus spending spree. But that was while a lot of people were avoiding social events and were ordering stuff from home. While that has faded in the past year, spending on services has motored right ahead, and is presently still up about 6% YoY - which in the long term is a *very* healthy rate.

Which means that the signal from a fading goods-producing sector - normally a reliable leading indicator - may be overstated this time around.

We’ll get a further read on that Thursday.

Now, on to my main topic: inflation.

Prof. Paul Krugman continues to tweet that inflation may be taking care of itself, and the Fed shouldn’t hit the brakes too hard, e.g., in this long thread:


I would be very cautious about this. That’s because, to recapitulate, 1/3rd of the entire CPI reading is housing, and housing prices have been on a tear. That gets reflected, with a 12 to 18 month lag, in “owner’s equivalent rent” (OER), which is currently at a 30 year high (gold in the graph below, vs. overall CPI, red):


Inflation normally declines before OER peaks, but precisely *because* the Fed slams on the brakes (black in the graph above). 

Well, house prices are still up (awaiting tomorrow’s updates) about 16% YoY. That is going to continue to feed into OER for the next 12 months at least.

In other words, the only reason inflation declines in the next 12 months is if the non-housing 2/3’s of the number slows down drastically. I’m skeptical of that happening if the Fed retreats towards the sidelines.

That being said, the Fed should as a matter of discipline differentiate between supply-driven inflation, especially of durable goods, vs. demand-driven inflation. That’s because, if there is a supply bottleneck, that bottleneck isn’t going to magically disappear by cutting down demand. All it is going to do is create more pent-up demand, and unleash more inflation in that good once interest rates are lowered. 

This is particularly true of housing. To the extent housing inflation is driven by a shortage of construction materials, building even less housing to keep a lid on prices just means even more of a shortage of housing, and more demand once the Fed releases the brakes.  In other words, if there’s a shortage of supply of a durable good, the Fed ought to accept higher inflation rather than bring on a needless recession which won’t cure that shortage anyway.


Saturday, June 25, 2022

Weekly Indicators for June 20 - 24 at Seeking Alpha


 - by New Deal democrat

My Weekly Indicators post is up at Seeking Alpha.

The weakness in the long leading indicators is increasingly spreading to the short leading indicators. The more this happens, the more inevitable a recession is, and the sooner it gets here.

As usual, clicking over and reading should be educating for you, and rewards me just a little bit for my efforts.

Friday, June 24, 2022

New home sales rebound, but downtrend in sales intact; prices continue to climb


 - by New Deal democrat

In response to April’s dismal report, I wrote that “new home sales are heavily revised after the first report. It is not unusual at all for big monthly moves like this to suddenly look much less severe when the number gets revised one month later. I would not be surprised in the slightest if that happened to this month’s cliff dive, when next month’s report comes out.”


That’s exactly what happened, as last month was revised higher by 38,000 to 629,000 units annualized. May came in at 696,000.

That’s still a big decline of -17% from their most recent peak last December, and -33% from their pandemic peak of August 2020 (blue in the graph below):


This is frequently - but not always! - consistent with an oncoming recession.

The particular value of new home sales is that, although it is a very noisy number, they frequently do peak and trough before either permits or starts, and did so again during this expansion. So for sales, this month was further confirmation that the declining trend is intact.

As to prices, in the graph above note that the median price of a new home (red) continued to rise. 

But the pace of the increase in prices has slowed considerably from +24% YoY last July to +15% in May:


In the past, as shown by the below comparison with the housing bubble and bust, prices have continued to rise sometimes for over a year after sales went into steep declines:


So prices may continue to rise for a number of months more before stalling or declining (and as I indicated the other day, I now expect significant declines).

Finally, sales and prices both lead inventory, as shown in the below graph including sales (blue) and inventory (gold) of new homes for sale:


Inventory is increasing even as sales decline. This of course is yet another reason to expect outright price declines soon. Just not as of yet.


Thursday, June 23, 2022

Resurrecting the metric: initial claims lead the unemployment rate; no recession signal so far


 - by New Deal democrat

 Initial jobless claims declined -2,000 to 229,000 last week, vs. the 50+ year low of 166,000 set in March. The 4 week average rose 4,500 to 223,500, compared with the all-time low of 170,500 eleven weeks ago.  Continuing claims rose 5,000 to 1,315,000, which is 9,000 above their 50 year low of 3 weeks ago:


Initial claims have been in an uptrend over the past 2.5 months. If this continues until the end of this month, they will no longer qualify as a “positive” in my array of short leading indicators, although they have not risen to levels that would change their rating to a negative.

Since the normal DOOOMers are baying that we are already in a recession, now is a good time to resurrect the construct that initial jobless claims lead the unemployment rate.

Why? Well, for example, the Sahm Rule is that when the 3 month moving average of the unemployment rate rises by 0.5% relative to its low in the previous 12 months, you’re in a recession. That’s somewhat conservative. On at least two occasions, 1953 and 1970, the unemployment rate only went up 0.1% for 1 month before a recession started. Paul Volcker started a recession in 1981 where the unemployment rate hadn’t moved up at all!

But in general, while the unemployment rate is a lagging indicator coming out of a recession, it is actually a negatively over-sensitive one, as it is a  slightly *leading* one going into recession.

With that in mind, here is the long term graph of initial jobless claims (red) vs. the unemployment rate (blue, right scale):


Typically a uptrend in initial claims leads an uptrend in the unemployment rate by 2-4 months.

Here’s the past two years:


The very mild uptrend in initial claims we’ve had in the past several months is similar to the one at the beginning of 2021 during the first winter wave of the pandemic. That led to a pause in the decline of the unemployment rate a few months later during spring 2021.

At worst, the current uptrend in claims (so far!) is consistent with a potential 0.1% uptick in the unemployment rate going into autumn.

Which means, while it’s not impossible, it’s very unlikely that the unemployment rate will signal the onset of a recession during that time.

Wednesday, June 22, 2022

Housing unaffordability closes in on bubble peaks; expect substantial price declines and increased foreclosures in the likely oncoming recession


 - by New Deal democrat

I last looked at the issue of housing affordability at the beginning of April. As we all know, mortgage rates have continued to skyrocket in the past several months. At present they are just under 6.10%:


This has changed the calculus on housing affordability considerably. So let’s take a look.

In April house prices in real terms were already almost identical to their 2006 highs. Depending on what house price index you use, nominally prices are up somewhere on the order of 60% since then. For example, here is a graph of new home prices and the FHFA index for the 2000s:


And here is the past several years:


Meanwhile the median price for an existing home peaked in July 2006 at $230,200. As we saw yesterday, as of last month they were $402,000. 

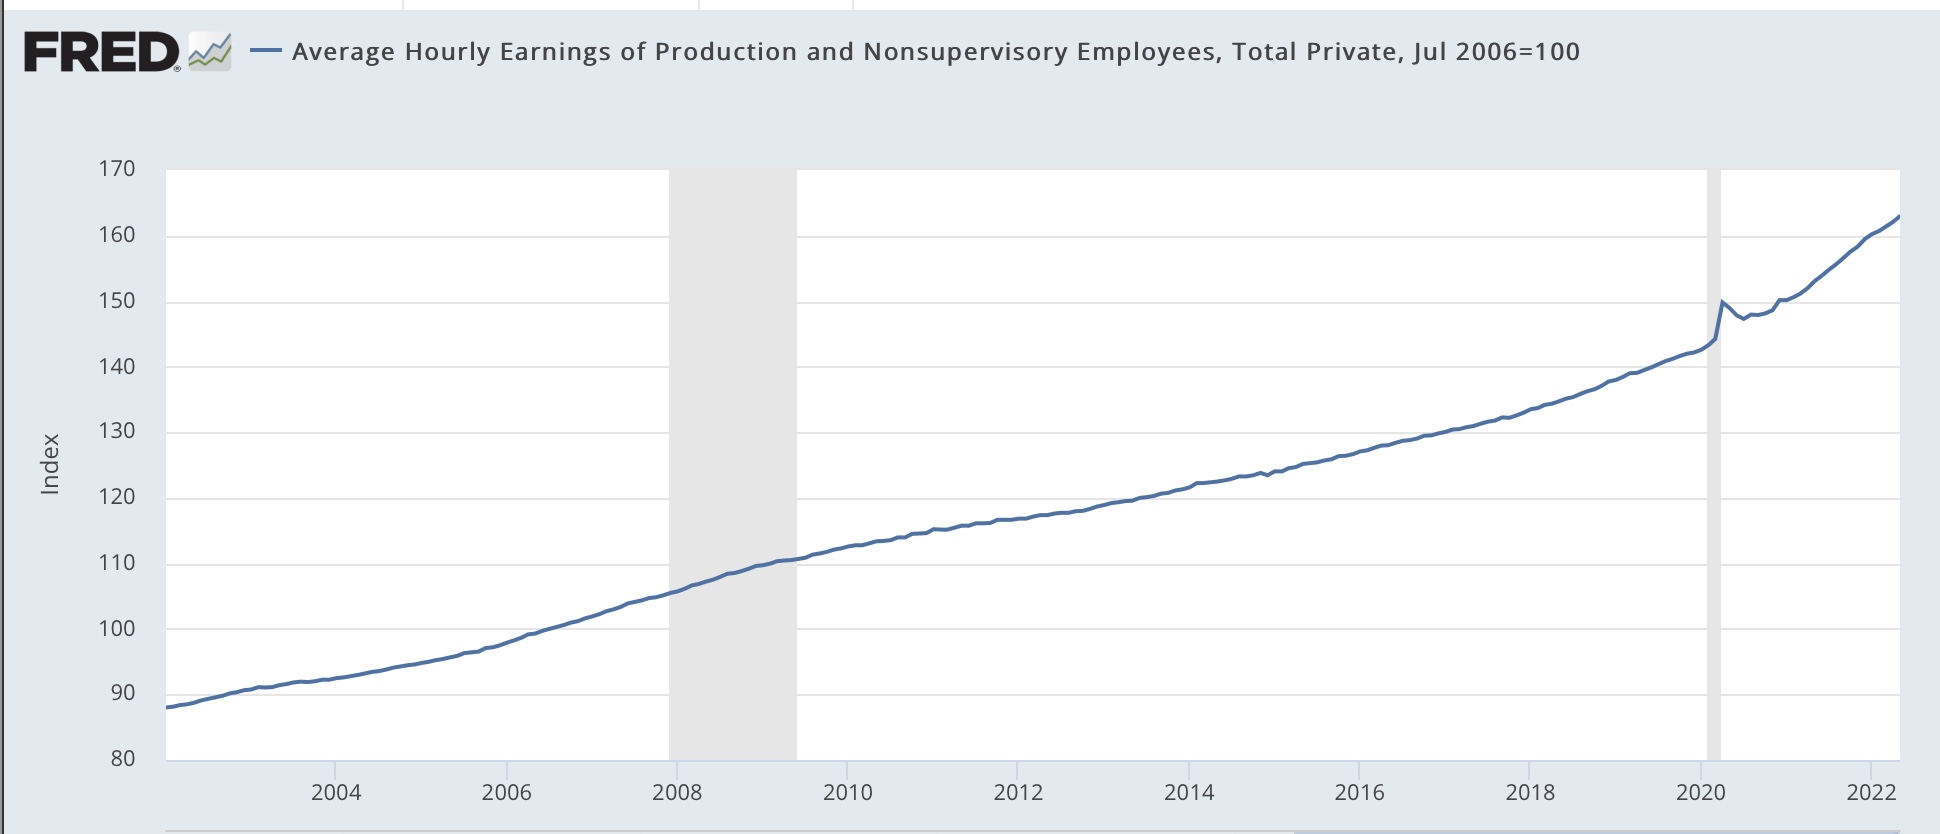
Average hourly wages for non-supervisory workers are also up a little over 60% since 2006:


Since in real, wage-adjusted terms, house prices are about the same now as they were at the peak of the housing bubble, let’s compare an identical mortgage then and now as well, for simplicity’s sake using $250,000, at the prevailing mortgage rates. Here’s the monthly payment for each:

April 2006: $1865.
July 2006: $1913.
April 2022: $1583.
June 2022: $1798.

The bottom line is that the average monthly mortgage payment has increased by about 13.6% in the past two months, and now is about 96% in real, wage-adjusted terms, of what it was at the peak of the bubble.

Even before yesterday’s report, the NAR’s “Housing Affordability Index” had dropped to 105 in April. How low is that? Well, for comparison here’s what the Affordability Index was during the 2000s:


At the worst of the housing bubble, it sat right at 100.

In short, housing is equal to its worst affordability levels in the past 35 years.

Frankly, I have been very surprised at this, since mortgage lenders are being much more careful now than they were at the peak of the bubble, when anything that fogged the mirror could get a loan.

This changes the calculus of the housing market - and the economy - going forward significantly. 

While I don’t see the banking system fallout that we had in 2008, when all the birds came home to roost on those ridiculous loans, creating a cascade of financial system defaults, I *do* now see it as being almost inevitable that there will be another significant decline in house prices that will last a number of years. This will trap a large number of younger homeowners in houses that are financially “underwater,” as they make payments on a house they can’t sell for the price at which they bought. And an increase in unemployment during a recession next year that looks increasingly inevitable will mean a substantial increase in foreclosures for some of these buyers as well.

Not so good.

Tuesday, June 21, 2022

Existing home sales: the freight train of price appreciation rolls on


 - by New Deal democrat

Although existing home sales are less economically important than new home sales, what has been happening with their prices, given the experience of the housing bubble and bust 15 years ago, is of added importance.


The simple summary is that sales have declined substantially, while price appreciation keeps rolling on.

Sales of existing homes were down 3.4% for the month, seasonally adjusted; down 8.6% YoY; down almost 20% from their January 2021 peak; and, at 5.41 million annualized, the lowest level since June 2020:


This isn’t a crash - at least, not yet. But it is certainly at a level consistent with an oncoming recession.

The story is completely different as to prices. At $407,600, the median price of an existing home increased 4.8% for the month and 14.8% YoY (Note: prices aren’t seasonally adjusted, so the YoY view is the best measure; graph does not show this morning’s data):


Prices were up over 25% YoY last June, so while this is a 40% deceleration, it is consistent with continued price appreciation if we were able to seasonally adjust.

Additionally, in May inventory was still down -4.1% YoY. Importantly, the NAR’s weekly update showed inventory increasing YoY in the last week of May and the first several weeks of June, so this may be the last hurrah for that metric.

Bottom line: Prices follow sales, and will in this case as well, but they haven’t - yet.


Monday, June 20, 2022

Coronavirus dashboard for June 19: documenting the transition from pandemic to endemic


 - by New Deal democrat

The COVID-19 pandemic is ever so gradually transforming into an endemic illness, the major risks of which still mainly fall on seniors.


Here is the long-term view of cases (dotted line) and deaths (solid line) in the US:


While cases are similar to the peaks of 2020, but far below those of 2021, deaths are lower than at any point except for June and July last summer.

Similarly, hospitalizations remain lower than at any point except several months during summer 2020 and 2021:


Focusing on the last 3 months, cases have been generally unchanged in the range of 100-110,000 for the past month, and deaths have varied between 250-330 for the past 1.5 months (the several gaps higher in deaths are due to periodic data dumps by North Carolina that can be ignored):


Essentially, both cases and deaths have plateaued at current levels, despite the changing landscape for variants, as Ba.2.12.1 replaced Ba.2, and now Ba.4&5 are increasing.

Here is the latest from Biobot, which tracks wastewater, an early warning system:


“Real” cases are down sharply in the Northeast, where Ba.2.12.1 was most prevalent, and slightly down in the Midwest and West, but rising again slightly in the Midwest.

We should know within a week or two whether the emergence of Ba.4&5 as the dominant strain is going to create any renewed wave or not. So far, very preliminarily, the answer is “not.”